The Neighborhood Poverty Project
Introduction
In the span of just a few weeks, the U.S. economy went from “recession proof” to facing one of the largest single-quarter contractions since the Great Depression. From mid-March to mid-April, 26 million workers filed for unemployment, surpassing the nearly 23 million jobs created over more than ten years of economic growth.
The recession currently underway will hit the most economically vulnerable places the hardest. Persistent geographic inequality defined the record-long economic expansion that has just come to an end. “Winning” places pulled rapidly ahead while others stagnated or declined. While very few places are likely to emerge from this crisis unscathed, distressed American communities, where work was already scarce and household finances were already precarious, are the least resilient heading into the current storm, and their ranks have proliferated over the past several decades.
EIG’s latest research initiative, the Neighborhood Poverty Project, tracks changes in the number and composition of metropolitan high-poverty neighborhoods from 1980 to 2018. It finds that the number of neighborhoods in which 30 percent or more of the population lives in poverty doubled from 1980 to 2010 and has remained stubbornly high despite a decade of national economic expansion. Unlike the 1990s expansion, the recovery from the 2009 financial crisis failed to meaningfully reduce the country’s accumulated stock of poor communities or raise their household incomes. This project aims to clearly demonstrate that, as policymakers wrestle with how to ameliorate the damage of the current crisis, a return to the pre-crisis “normal” of national growth is not enough if we are to lift America’s most vulnerable communities.
High-poverty neighborhoods enter the next recession severely disadvantaged relative to low-poverty places (defined here as places where less than 20 percent of residents are below the poverty line). One-quarter of adults living in a high-poverty neighborhood lack even a high school diploma. Residents are half as likely to have obtained a bachelor’s degree as someone living in a low-poverty neighborhood. The average median household income for a high-poverty neighborhood is less than half the national average, and residents of these neighborhoods are much more likely to be out of work and rent-burdened. Concentrated economic hardship defines high-poverty neighborhoods and is the primary reason that the proliferation of these neighborhoods is so troubling.

The average life expectancy in a high-poverty neighborhood is 74 years, compared to 80 years for a low-poverty neighborhood. This six-year difference is the culmination of systemic gaps in economic, social, and physical well-being and reflects uneven access to economic opportunity, quality healthcare, and strong social capital. For example, 24 percent of high-poverty neighborhoods are food deserts compared to just 7 percent of low-poverty places. With respect to healthcare access, the share of residents of high-poverty neighborhoods who are uninsured is more than double the rate of low-poverty places, 15 percent versus 7 percent.
This project is divided into two research reports. The first report, The Expanded Geography of High-Poverty Neighborhoods, looks at the proliferation of metropolitan high-poverty neighborhoods between 1980 and 2018. It highlights the surge of high-poverty neighborhoods in the 2000s and the failure of the last decade to meaningfully reduce that number. Even more troubling, this report finds that the average real household income for high-poverty neighborhoods has declined over the past two decades. Real progress against the country’s neighborhood poverty problem seems to have ceased at the turn of the century.
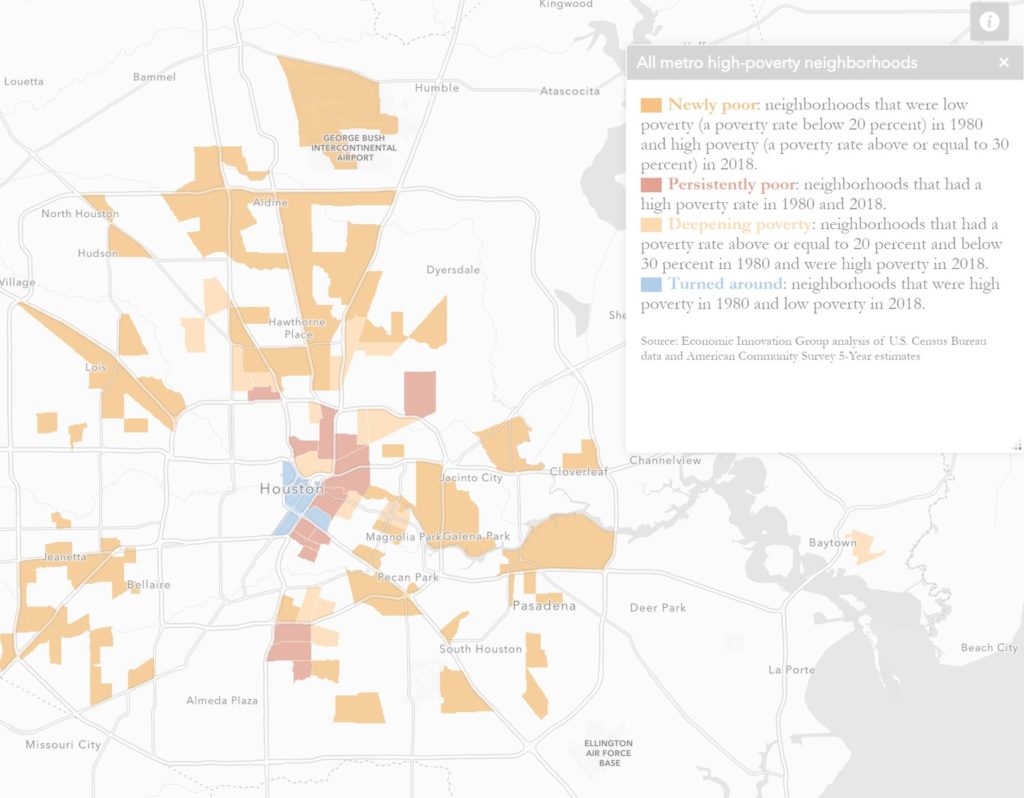
The second report, The Persistence of Neighborhood Poverty, zooms in on urban areas, which are not only under unprecedented strain in the current crisis, but are also where the majority of high-poverty neighborhoods are located. It draws the stark conclusion that, across American cities, new high-poverty neighborhoods have proliferated, established high-poverty neighborhoods have become entrenched, and very few communities have experienced meaningful turnarounds. In total, 64 percent of neighborhoods that were high poverty in 1980 were still high poverty in 2018, 38 years later. Only 14 percent had meaningfully turned around—most of which were in New York City, on the suburban/exurban fringe of metro areas, or immediately adjacent to downtowns.


