Neighborhood Poverty Project
Key findings
- From 1980 to 2018, nearly 4,300 neighborhoods, home to 16 million Americans, crossed the high-poverty threshold (a 30 percent poverty rate or higher).
- Alongside these new high-poverty neighborhoods, 2,134 neighborhoods, home to 6.8 million people, were persistently high poverty.
- In total, two-thirds of metropolitan neighborhoods that were high poverty in 1980 were still high poverty in 2018.
- It is rare for an initially high-poverty neighborhood to ever become low poverty. In the past 38 years, just 14 percent of neighborhoods that were high poverty in 1980 had turned around (flipped to low poverty) by 2018.
- New York City alone accounts for 22 percent of all turnaround neighborhoods nationwide.
- Nearly 4 in 10 at-risk neighborhoods, those with a poverty rate between 20 and 30 percent in 1980, became high poverty by 2018.
- In some cities, the rate of downward neighborhood mobility over the last several decades has been alarming. In Detroit, 61 percent of neighborhoods that were low poverty in 1980 flipped to high poverty in 2018. In Cleveland, that number is 49 percent, and in Rochester, NY, it is 44 percent.
Tracking neighborhood change
An examination of longitudinal census tract level data going back to 1980 reveals that a surge of new high-poverty neighborhoods has taken root across American cities. At the same time, poverty has become persistent for thousands of other neighborhoods, and very few once-poor places have successfully turned around.
We established three categories to frame our discussion of current high-poverty neighborhoods:
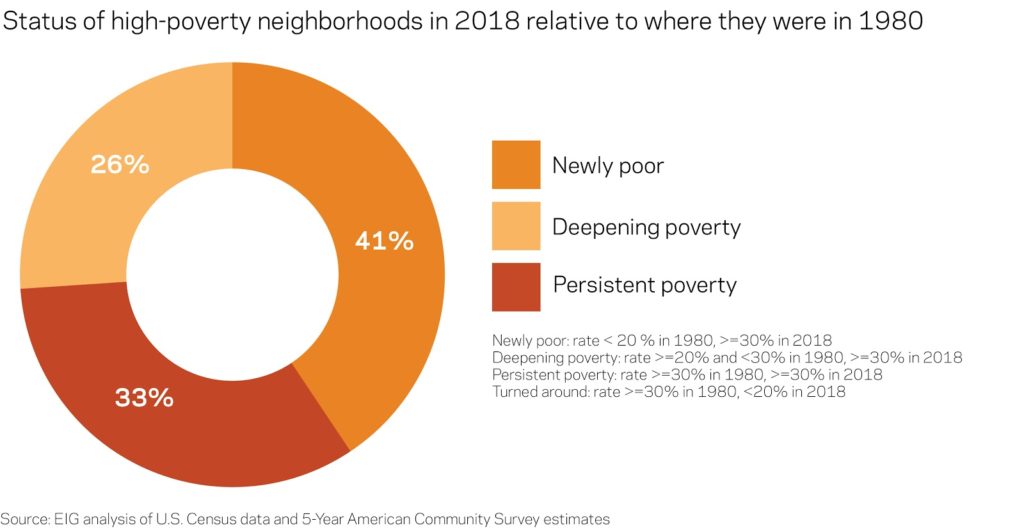
- Newly poor describes neighborhoods that were low poverty (a poverty rate below 20 percent) in 1980 and high poverty (a poverty rate above or equal to 30 percent) in 2018. Due to the proliferation of high-poverty neighborhoods since 1980, a majority of currently high-poverty neighborhoods fall into this category.
- Persistent poverty describes neighborhoods that had a high poverty rate in both 1980 and 2018. Although this category does not consider whether a neighborhood temporarily fell out of the high-poverty bracket at any point between 1980 and 2018, 75 percent of these persistently poor neighborhoods were high poverty at every decade mark between 1980 and 2018.
- Deepening poverty describes neighborhoods that had a poverty rate above or equal to 20 percent and below 30 percent in 1980 and were high poverty in the latest data.

In addition, this paper also looks at one other category for 1980 high-poverty neighborhoods: those that turned around. Turned around neighborhoods are ones that were high poverty in 1980 and low poverty in 2018.
Far more neighborhoods slip into poverty than climb out of it
For initially impoverished neighborhoods, persistent poverty is the norm and major turnarounds are exceedingly rare. Just 14 percent of all neighborhoods that were high poverty in 1980 had successfully turned around by 2018, while 64 percent stayed high poverty.
From 1980 to 2018, nearly 4,300 neighborhoods, home to 16 million Americans, crossed the high-poverty threshold. Alongside these new high-poverty neighborhoods, 2,134 neighborhoods, home to 6.8 million people, were persistently poor. In total, the country contained over 6,400 high-poverty neighborhoods in 2018. By comparison, just 464 neighborhoods that were high poverty in 1980 had turned around by 2018.
Assessed in its entirety, this historical perspective strongly implies that it is far easier for neighborhoods to become and stay poor than it is for them to climb out of poverty. Stickiness is the norm for neighborhoods at both ends of the distribution, but the prevailing trend is that far more places have switched to high poverty over the past 38 years than experienced a meaningful turn around. In the end, for every one high-poverty neighborhood that dramatically improved, there were five low-poverty ones that suffered dramatic deterioration.
Evolving maps of urban poverty
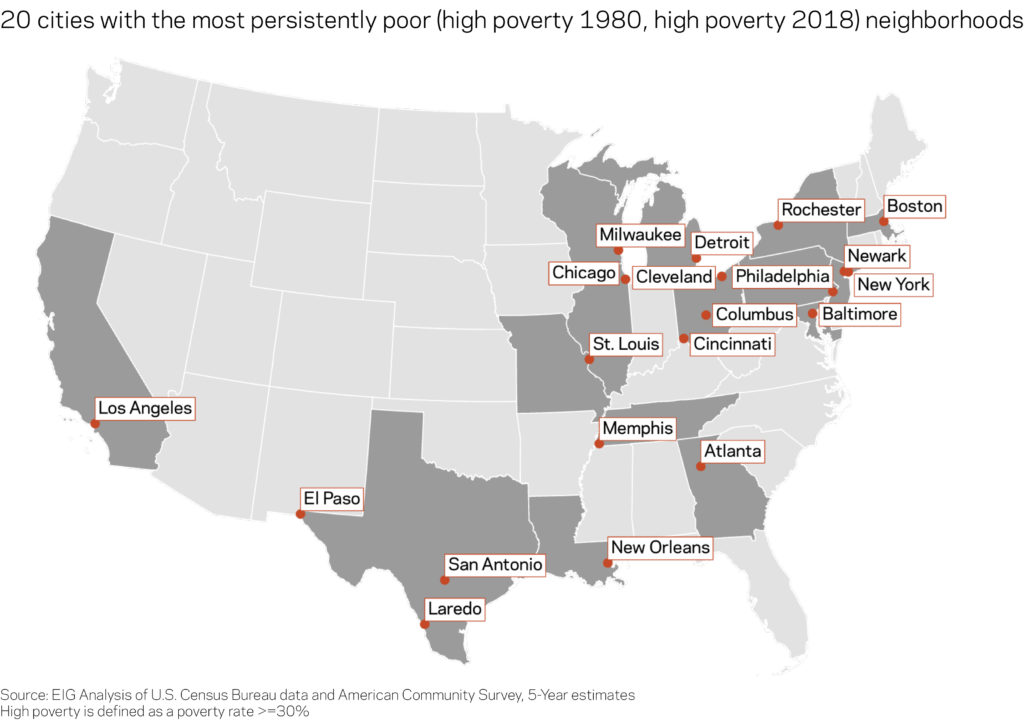
The country’s persistently high-poverty urban neighborhoods are overrepresented in the Northeast and the South and tend to be clustered around central cities. Black Americans make up half of the population in the average persistent poverty census tract, substantially greater than their share of the typical high-poverty neighborhood in general (39 percent). Popular conceptions (and misconceptions) of urban poverty were formed around many of these neighborhoods decades ago; the persistence of poverty in the same places since points to the meager progress the country has made in tackling long-standing social, economic, and racial inequalities, and how difficult it is to uproot poverty once it has taken hold.

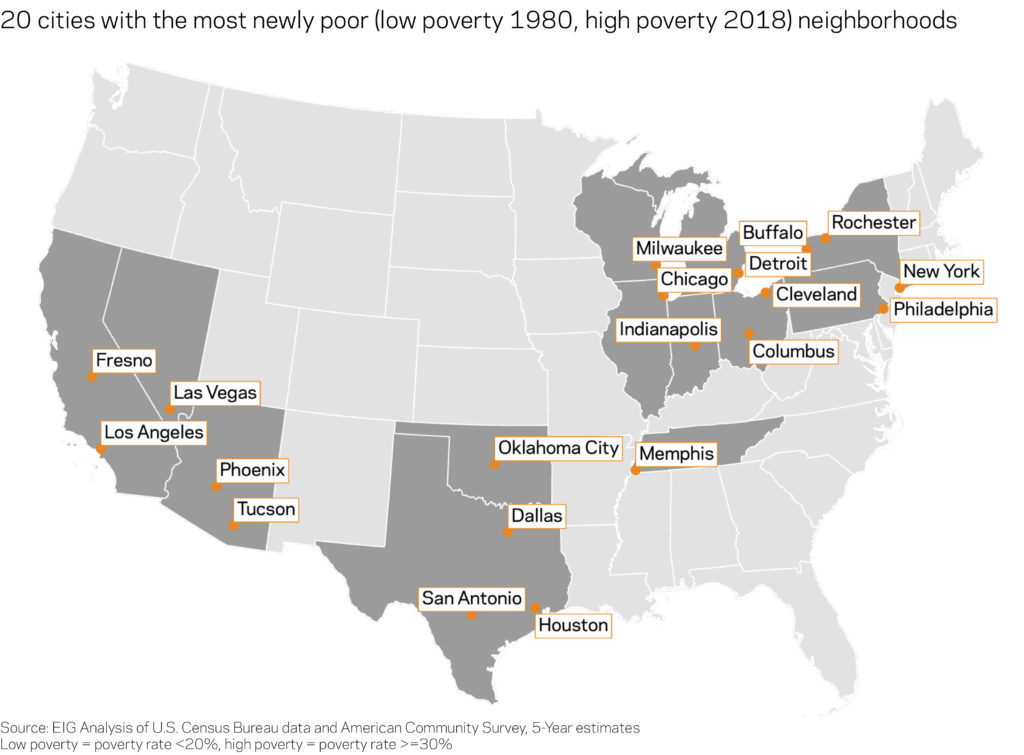
In general, the cities with the largest number of newly poor neighborhoods are a mix of those with large stocks of persistently poor neighborhoods (typically in the Rust Belt) and high population growth cities in the Sun Belt. These neighborhoods have grown far more diverse as they’ve become poorer. In 1980, non-Hispanic whites made up nearly three-quarters of the population of the typical low-poverty neighborhood that would go on to become high poverty. By 2018, the Black, white, and Hispanic shares were roughly equal in the average newly poor neighborhood.

In some cities, the rate of downward neighborhood mobility over the last several decades has been alarming. In Detroit, 61 percent of neighborhoods that were low poverty in 1980 flipped to high poverty in 2018. In Cleveland, that number is 49 percent, and in Rochester, NY, it is 44 percent. While Rust Belt cities have been the hardest hit by this trend, even in Sun Belt growth poles, such as Houston and Phoenix, about one in five neighborhoods that were low poverty in 1980 were high poverty in 2018.
Turnaround neighborhoods, for their part, are quite uncommon. New York City alone accounted for 22 percent of the country’s neighborhoods that went from high poverty in 1980 to low poverty in 2018. Add in Chicago and Los Angeles, and the country’s three largest cities contained over one-third of all turnaround neighborhoods. Forty-seven of the country’s 100 most populous cities had no turnaround neighborhoods at all. For some cities this is because they had few or no high-poverty tracts in 1980. Las Vegas, for example, only had one high-poverty neighborhood in 1980, which did not turn around. It now has 23 new high-poverty neighborhoods.
Conclusion
Vast sums of dollars and good intentions have been poured into the country’s poorest neighborhoods over the past several decades. The findings presented here suggest that the resources have been insufficient compared to the scale of the task at hand and relative to the other forces at work in the U.S. economy that make it hard for places that fall into poverty to climb back out again. With another economic crisis of unprecedented nature now underway, the need to forge new tools for community revitalization is more acute than ever.

