The Neighborhood Poverty Project

Like many American cities, New York started down a path of urban decline beginning in the 1960s. By 1980, one-quarter of the city’s population lived in a high-poverty neighborhood. Although the figure was higher in many other cities at the time (in nearby Newark, 59 percent of the population lived in a high-poverty neighborhood), as the country’s most populous city it was nonetheless home to a staggering number of people packed into economically depressed neighborhoods. The city’s overall poverty rate has hardly changed since the 1980s, dropping only slightly from 20 percent to 19 percent. Despite this, its number of high-poverty neighborhoods fell sharply from 499 in 1980 to 352 in 2018, putting New York in rare company. Out of a total of 114 cities nationwide with a population over 200,000, only 15 contain a greater number of tracts that moved from high poverty to low poverty than the inverse.[1] In total, NYC accounted for 22 percent of the country’s turnaround neighborhoods.
Most of New York City’s turnaround neighborhoods are concentrated in Brooklyn, where they are in close proximity to the borough’s persistent poverty neighborhoods. The rapidity and scale of such a turnaround has made Brooklyn a focal point for the nation’s debates around gentrification and displacement. Yet the dynamics at work are complex and hard to pin down, especially in a city as transient as New York. Consider that while the number of poor living in a high-poverty neighborhood in Brooklyn decreased by 29 percent from 1980 to 2018, the total number of poor living in Brooklyn increased by 3 percent.[2] Such figures suggest that the poor were deconcentrated within Brooklyn—having either moved to mixed income neighborhoods or stayed put while income mixes changed around them—but were not necessarily pushed outside of the borough.
Despite the prevalence of turnaround neighborhoods in the city, New York retains an exceptionally high number of persistent poverty neighborhoods and a stubbornly large number of people living in high-poverty neighborhoods. New York City’s landscape of poverty is a unique patchwork of entrenched poverty, rapidly transitioning neighborhoods, and new high-poverty neighborhoods on the city’s periphery.

New York’s persistently high-poverty neighborhoods are tightly clustered. Roughly half of them are in the Bronx, which contains only two turnaround neighborhoods. If the Bronx were treated as its own city, its poverty trends would be dismal. Its number of high-poverty neighborhoods increased from 148 in 1980 to 156 in 2018. As of 2018, 48 percent of all neighborhoods in the Bronx were high poverty, comparable to Memphis, TN, and 53 percent of the borough’s population lives in a high-poverty neighborhood. With 752,000 people living in such neighborhoods, the Bronx by itself has more people living in high-poverty conditions than any other American city.
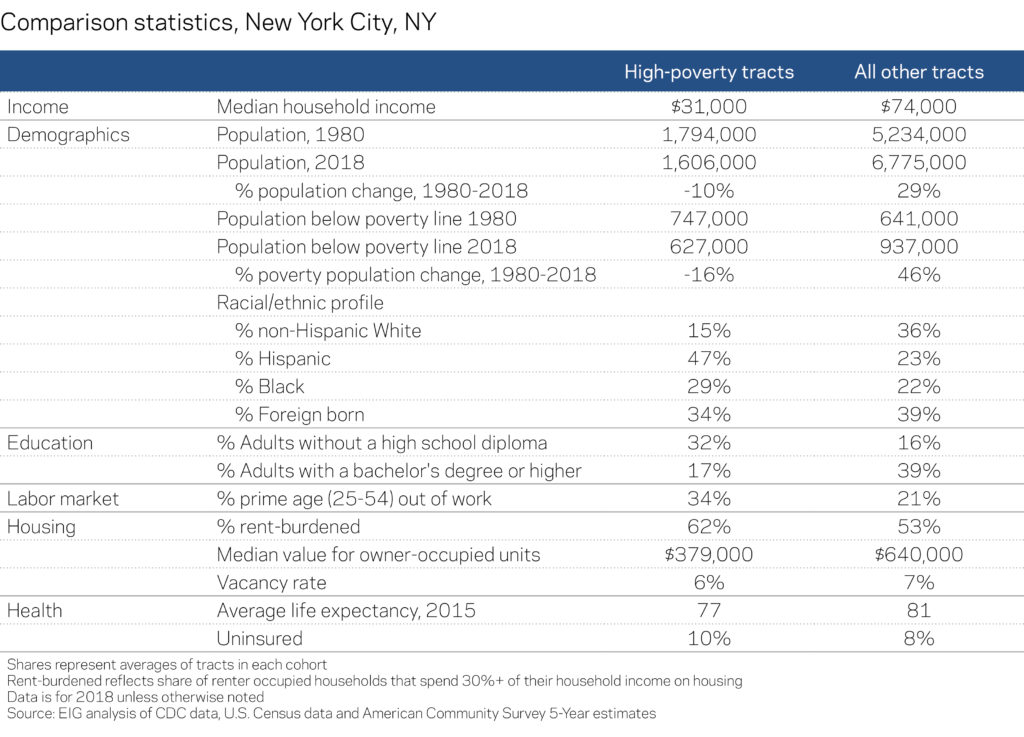
Looking at these high-poverty neighborhoods vis-à-vis non-high-poverty neighborhoods demonstrates their concentrated disadvantage. The median household income in New York City’s high-poverty neighborhoods is less than half that of all other neighborhoods. One-third of individuals 25 and older living in these high-poverty neighborhoods lack a high school diploma. The constraints of a tight housing market are felt especially acutely in high-poverty neighborhoods, where the vacancy rate is a percentage point lower on average than in non-high-poverty neighborhoods.
New York City may be representative of gentrification in the popular consciousness, but the city is still home to 1.6 million people residing in high-poverty neighborhoods. Even though this figure has fallen significantly since 1980, it is roughly equal to the total number of people living in high-poverty neighborhoods in the next three largest cities (Chicago, Los Angeles and Houston) combined. This stat alone points to how much more work remains to restore economic opportunity to more corners of the country’s leading metropolis.
[2] This is in line with recent research (Dragan, Ellen and Glied, 2019) that argues for decoupling gentrification, a likely explanation for many of Brooklyn’s turnaround tracts, and displacement of low-income populations. The study uses longitudinal New York City Medicaid records from January 2009 to December 2015 to track the mobility of a cohort of low-income children over seven years. Its authors found that while displacement is a common occurrence for low-income populations, it occurs irrespective of gentrification.