The Neighborhood Poverty Project

Key findings
- From 1980 to 2018, nearly 4,300 neighborhoods, home to 16 million Americans, crossed the high-poverty threshold (a 30 percent poverty rate or higher).
- Alongside these new high-poverty neighborhoods, 2,134 neighborhoods, home to 6.8 million people, were persistently high poverty.
- In total, two-thirds of metropolitan neighborhoods that were high poverty in 1980 were still high poverty in 2018.
- It is rare for an initially high-poverty neighborhood to ever become low poverty. In the past 38 years, just 14 percent of neighborhoods that were high poverty in 1980 had turned around (flipped to low poverty) by 2018.
- New York City alone accounts for 22 percent of all turnaround neighborhoods nationwide.
- Nearly 4 in 10 at-risk neighborhoods, those with a poverty rate between 20 and 30 percent in 1980, became high poverty by 2018.
- In some cities, the rate of downward neighborhood mobility over the last several decades has been alarming. In Detroit, 61 percent of neighborhoods that were low poverty in 1980 flipped to high poverty in 2018. In Cleveland, that number is 49 percent, and in Rochester, NY, it is 44 percent.
A missed opportunity to reduce the country’s stock of high-poverty neighborhoods
The number of high-poverty neighborhoods increased dramatically across U.S. metro areas from 1980 to 1990, rising by 41 percent from 3,558 in 1980 to 5,000 in 1990. Robust economic growth in the 1990s succeeded in partially reversing this trend, leading to a 4 percent reduction in the number of high-poverty neighborhoods by 2000. This modest improvement turned out to be short-lived. The economically turbulent 2000s pushed the number of high-poverty neighborhoods up to 6,489 by 2010. Deep into the recovery from the Great Recession, the 2018 count of high-poverty neighborhoods remained elevated at 6,547—almost double the number of high-poverty neighborhoods in 1980.
High-poverty neighborhoods are especially exposed to the economic fallout from stay-at-home orders and related measures: 14 percent of individuals living in high-poverty neighborhoods work in the accommodation, food service, entertainment, and related industry sectors, for example, compared to 9 percent of individuals living in low-poverty neighborhoods. Such figures speak to the precariousness and vulnerability to adverse economic shocks endemic to poor areas.
In retrospect, the most recent era of national economic growth seems at best to have temporarily halted the spread of high-poverty neighborhoods, standing in contrast to the progress made during the 1990s expansion in meaningfully reducing their numbers. Now, with another severe economic shock underway, it is almost certain that the number of high-poverty neighborhoods will climb yet again. Some of these will be cyclical, climbing back out of poverty once the next recovery takes hold. But the experience of the past four decades suggests that many others will add to the country’s accumulated stock of persistently high-poverty neighborhoods.
The total population residing in high-poverty neighborhoods doubled between 1980 and 2018, rising from 12 million to 24 million Americans (of those 24 million, 8.9 million were themselves below the poverty line). By comparison, the total U.S. population only grew by 44 percent over the same period. Over time, poor Americans have become increasingly concentrated into moderate and high-poverty neighborhoods and significantly rarer in very low poverty areas. The number of high-poverty neighborhoods is rising in part because poor and non-poor populations are sorting into separate communities.
Declining household income for high-poverty neighborhoods over the last 20 years
After narrowing in the 1990s, neighborhood income gaps are widening again, decreasing the likelihood that their high-poverty status will only be fleeting. During the 1980s and 1990s, the income of the median household in the typical high-poverty neighborhood grew significantly in real terms. In the 1990s, income growth in high-poverty neighborhoods even exceeded that in low-poverty neighborhoods—underscoring just how inclusive the geography of economic growth was during that era. Yet, high-poverty neighborhoods have on average experienced a decline in median household income over the last twenty years. The modest upticks in low-poverty neighborhoods in the years since 2010 still elude most high-poverty neighborhoods in the latest data.
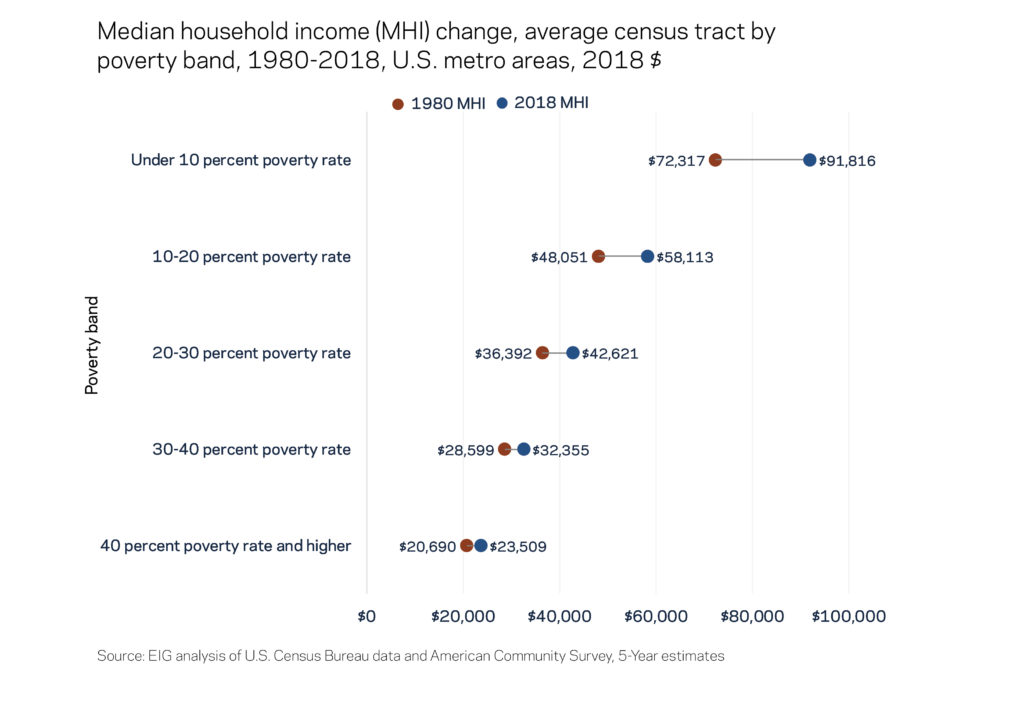
This disturbing trend means that the most vulnerable neighborhoods have seen household income gains rollback in real terms since the turn of the century to levels just above where they were in 1980. For neighborhoods with a poverty rate below 10 percent, the average median household income has surged from $72K to $92K while neighborhoods with a poverty rate above 40 percent have only seen household income increase from $21K to $24K, further widening the gap between the prosperous parts of the country and the most distressed.
The changing demography of high-poverty neighborhoods
The racial and demographic composition of high-poverty neighborhoods has shifted dramatically over the course of the past several decades. The Black share of the high-poverty neighborhood population fell from 57 percent in 1980 to 34 percent in 2018, as the Hispanic share surged and the non-Hispanic white share increased moderately. Both Blacks and Hispanics grew less likely to live in a high-poverty neighborhood over time. Non-Hispanic whites, by contrast, grew slightly more likely to live in such a neighborhood. Despite these changes, immense racial gaps remain as Hispanics are four times as likely as non-Hispanic whites to live in a high-poverty neighborhood and Blacks nearly six times.
Conclusion
Income inequality has been on the rise for several decades now and manifests itself at all levels of geography—across regions and states, but also within cities and metropolitan areas. While not all high-poverty neighborhoods share the same disadvantages, they are generally places where economic opportunities are scarce and poverty is an intergenerational burden. Communities of color are disproportionately impacted by the spread and persistence of high-poverty neighborhoods, but the entrenchment of poor places impairs the entire economy. Put simply, the U.S. economy cannot reach its full potential if large shares of its citizens cannot reach theirs. Now more than ever, the country needs a reimagined, reinvigorated agenda to lift people and places together.