By August Benzow
The Economic Innovation Group (EIG) recently launched the Neighborhood Poverty Project, which features two reports that analyze the spread and persistence of high-poverty neighborhoods throughout the United States over the last four decades. Together, these reports find that while the last national economic expansion brought growth and prosperity to many areas, it failed to meaningfully reduce the country’s stock of high-poverty neighborhoods.
On May 13th, EIG hosted a webinar with the authors of the report to discuss the findings in more detail. The authors were joined by Alan Mallach and Alan Berube. Mallach is a senior fellow at the Center for Community Progress in Washington, D.C., and Berube is a senior fellow and deputy director at the Metropolitan Policy Program at Brookings and coauthor of Confronting Suburban Poverty in America.
You can visit EIG’s website to read The Expanded Geography of High-Poverty Neighborhoods and The Persistence of Neighborhood Poverty, and explore our interactive map of high-poverty neighborhoods across the United States.
A recording of the webinar can be found here.
Key Takeaways
Expanding Geography of Neighborhood Poverty
- The U.S. experienced a 41 percent increase in high-poverty neighborhoods (poverty rate above or equal to 30 percent) from 1980-2018.
- The 2018 count of high-poverty neighborhoods remains relatively unchanged from 2010 at 6,547.
- Poor Americans in 1980 were more likely to live in a very low-poverty neighborhood (with a poverty rate below 10 percent) than in a high-poverty neighborhood. Today, this relationship has inverted.
- High-poverty neighborhoods have experienced a decline in real median household income over the last twenty years.
- Hispanics are four times as likely as whites to live in a high-poverty neighborhood and Blacks nearly six times.
Persistence of Neighborhood Poverty
- Nearly two-thirds of all neighborhoods that were high poverty 40 years ago are still high poverty today.
- Black Americans represent half the population in the average persistent poverty tract, compared to 39 percent in all high-poverty tracts.
- Newly poor tracts are more common in the Great Lakes and Southwest.
- In most cities, turnaround tracts are rare and exceptional spaces: downtowns or downtown-adjacent; university districts; innovation districts; rehabilitated industrial lands.
- Houston claims 80 newly poor neighborhoods in the country, the largest number after Detroit.
- National economic growth is clearly insufficient on its own to lift poor neighborhoods.
Vulnerable Regions and the Covid-19 Crisis (Alan Berube)
- High-value jobs are growing in fewer places, innovation is concentrated in superstar metros.
- Covid-19 is unlikely to change this dynamic.
- Knowledge economy isn’t going anywhere, superstar metros will continue to benefit from it.
- The virus is beginning to spread in the Heartland.
- Many high-poverty communities did not recover fully from the last recession.
- Major federal commitment to lagging regions is needed.
- Neighborhood poverty may have different impacts on the people living there now versus 40 years ago.
Neighborhood Change and National Covid-19 Statistics (Alan Mallach)
- Very few low-income neighborhoods ‘come back.’
- The ones that do are in hot markets, adjacent to centers of activity, or have distinct architecture.
- Covid-19 Recovery
- The U.S. is not likely to see a full recovery until January 2022 at the earliest.
- Double-digit unemployment into 2021.
- Residential and small business tenants will struggle to pay.
- There will be a significant loss of local government revenue.
Register for our May 21 webinar with guest speakers Dr. Austan Goolsbee and Dr. Kenneth Rogoff on Navigating COVID-19: Addressing the Economic Impact and Launching an Equitable Recovery.
Audience Q&A Responses
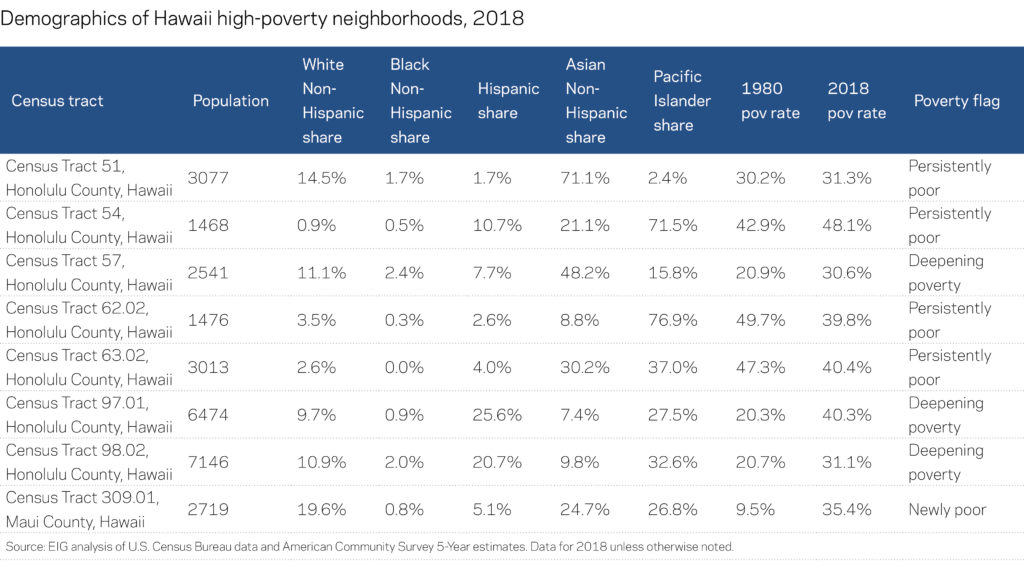
Are there any “high-poverty neighborhoods” in Hawai’i? Are there any statistics on poverty rates for Asian Americans? Hawai’i has a very large homeless population as well as many people who are considered “low income.” Hawai’i also has a huge Asian American population.
August Benzow: The report only looks at Black, Hispanic, and non-Hispanic white populations, since these groups are the most prevalent in metropolitan high-poverty neighborhoods. However, data is also available for Asian and Native Hawaiian/Pacific Islander populations. Hawaii has eight high-poverty neighborhoods. Seven are in Honolulu County and one is in Maui County. One of these high-poverty neighborhoods is majority Asian and two are majority Pacific Islander and all of them have high populations of both groups.
The persistently poor “20 cities” slide shows that Black Americans represent half the population in the average persistent poverty tract. Many of those are in the Northeast and Midwest. How does that compare with the “regional race and poverty distribution” bar chart? The Northeast has a surprisingly relatively even distribution.
August Benzow: The average persistently poor neighborhood in a Northeast city with a population above 200,000 is 44 percent Black. That share drops to 33 percent in high-poverty neighborhoods in Northeast cities with a population under 200,000. So, one reason that non-Hispanic whites make up nearly a quarter of the population of Northeast high-poverty neighborhoods is that persistently poor neighborhoods in lower population communities tend to be whiter. Another reason is that newly poor neighborhoods in the Northeast are on average only 26 percent Black, while persistently poor neighborhoods are 40 percent Black on average. In the Northeast and elsewhere, poverty is no longer primarily taking root in Black communities as it was in the 1980s.
Please share examples of “turnaround neighborhoods” where displacement and gentrification did not occur, and “real neighborhoods” were preserved. Where and how?
August Benzow: Decennial census data and American Community Survey data do not track people over time, so using these datasets, it is impossible to say how many people are being displaced (or not) in a given neighborhood. High-poverty communities generally experience high resident turnover, so we can try to identify neighborhoods that turned around without undergoing a demographic transformation by looking for relatively stable racial and ethnic profiles over time. There are a few neighborhoods, for example, that were majority Black in both 1980 and 2018 and also flipped from high poverty to low poverty. The Weequahic neighborhood in Newark, a city that has made a concerted effort to address its large stock of high-poverty neighborhoods, was 96 percent Black in 1980 and 2018, and saw its poverty rate fall from 32.4 percent in 1980 to 14.4 percent in 2018. Similarly, the Oliver neighborhood in Baltimore was 97 percent Black in 1980 and 93 percent Black in 2018 and also experienced a steep decline in its poverty rate from 43.4 percent in 1980 to 18.6 percent in 2018.
Turnaround neighborhoods are great, but is the economic development we’re seeing a) pushing lower-income residents to surrounding neighborhoods, or b) investment in all residents to ensure mixed income neighborhoods and diversity in race, class, income etc.?
August Benzow: This research does not attempt to quantify displacement in turnaround neighborhoods. Some turnaround neighborhoods are neighborhoods on the edges of cities that flipped from low-density rural in 1980 to suburban in 2018, suggesting minimal displacement. Urban turnaround neighborhoods are more likely to have been the product of downtown revitalization efforts, big economic development programs, or dynamics many would associate with the concept of gentrification, or the new desirability of certain neighborhoods for certain demographics. Such neighborhoods generally have unique attributes — physical proximity to downtowns, intact historical districts, and the like. The dynamics are very complex and existing data sources, unfortunately, don’t allow us to track individuals over time to accurately estimate any displacement effects of neighborhood revitalization. Given the high resident turnover and general housing instability of poor neighborhoods, however, scholars (such as those cited in the reports) find few observable instances of displacement. Nevertheless, anecdotally it is clear that some revitalization efforts produce more inclusive outcomes than others.
Alan Mallach: It’s a mixed bag. It does often take the form of gentrification. The experience of concentrated poverty neighborhoods turning into truly diverse and stable mixed income neighborhoods is sadly rare, and seems to hardly ever (if ever) happen without an influx of new population. The two examples that I briefly cited in the webinar (one in St. Louis and one in Baltimore) are examples where, as both neighborhoods gentrify, intentional strategies have led to the creation of significant amounts of long-term affordable housing in both neighborhoods, which in turn have preserved significant low income population shares and ensure that these neighborhoods will have a sustained mixed-income character.
Pittsburgh is often held up as an example of an industrial city that pivoted successfully to thrive in an innovation and knowledge economy. Are the policy and economic choices made there relevant to these other Midwestern ‘rust belt’ areas? Or is that not a fair comparison?
August Benzow: On the map, Pittsburgh looks very similar to other ‘rust belt’ cities that have pivoted from a manufacturing base to a knowledge economy base. A handful of desirable neighborhoods have turned around, while a greater number of other neighborhoods have stayed high poverty or flipped from low to high poverty. Indianapolis, profiled in depth as part of the project, is another example of this. The proliferation and persistence of poverty in these cities suggests that replacing relatively low-skilled manufacturing jobs with high-skilled knowledge economy jobs does not in fact lift all boats.
Alan Mallach: It depends. Pittsburgh has indeed pivoted successfully up to a point, but it had unusual assets that made that possible, including perhaps the highest concentration of research-oriented universities and medical facilities relative to the population of any city in the United States with the University of Pittsburgh, Carnegie-Mellon and the University of Pittsburgh Medical Center, which is the largest private sector employer in Pennsylvania. They made a lot of good decisions, to be sure, but they also were lucky in their basic institutional endowment. Other cities with similar although perhaps smaller ‘eds and meds’ networks have also been able to build new economic engines around those networks with some success, including St. Louis, Baltimore and Philadelphia. Cleveland, on the other hand, with an impressive array of eds and meds has seen some progress, but much less. The key issue is whether the city has strong, nationally- and research-oriented institutions on which to build that kind of economy. Most, especially smaller, rustbelt cities do not; a Pittsburgh-type strategy might work in St. Louis, but it won’t work in Dayton or Youngstown. It’s worth pointing out, though, that despite Pittsburgh’s success, it still has severe problems of poverty and social inequity, that have been affected only to a very limited extent by its pivot to a knowledge economy.
Are there high poverty areas that are beyond recovery? This becomes an important question about allocation of resources and the prevention areas competing against each other.
Alan Mallach: Again, it depends on what you mean. The data suggests that the likelihood of more than a modest percentage of the high-poverty areas turning into low-poverty areas is small and that most of them, barring a dramatic change in circumstances, will remain high-poverty. That tells me that the real issue is not ‘recovery’ or ‘revitalization’. We have to think differently about these places. People live in them, and will continue to do so. The key issue is not to focus on whether or not they will recover in the sense of turning into low-poverty neighborhoods, but on how to ensure that they provide the people who live there with a decent quality of life – health, safety, access to basic needs – and opportunities to change their individual circumstances through education and jobs, whether or not they end up staying in that neighborhood.
Does the rise of virtual work offer hope to spread opportunity meaningfully beyond the superstar geo clusters?
August Benzow: This might benefit some lower cost regions that are suffering from population loss, but is unlikely to change the map of high-poverty neighborhoods, since providing better economic opportunities for the current residents of those neighborhoods is the optimal way to improve the long-term standing of those neighborhoods.
What role has structural racism played in preventing certain neighborhoods from turning around?
August Benzow: The reports provide some historical context in order to make the case that historical practices, such as redlining, that segregated Black Americans in economically disadvantaged neighborhoods continue to define the map today. Andre M. Perry’s recently published Know Your Price: Valuing Black Lives and Property in America’s Black Cities addresses this question in depth.
Alan Mallach: The history of African-American neighborhoods is completely interwoven with structural racism in the United States. The creation of high-poverty Black neighborhoods is a consequence of the historic denial of opportunities to Black men and women in education and the workforce, patterns of residential segregation that persist despite fair housing laws and the devaluing of Black neighborhoods by the market—a direct function of their being shunned by white Americans. Likewise, the decline of Black middle-income neighborhoods into areas of concentrated poverty has been propelled by the targeting of many of these neighborhoods by subprime lenders in the late 1990s and early 2000s. All of these factors also increase the rarity with which Black high-poverty neighborhoods escape that status. In that light, it is worth noting that, as a rule, gentrification tends to shun Black neighborhoods, and focus primarily on white (and to a lesser extent) Latinx working-class neighborhoods. An exception is Washington DC, where virtually the only ‘gentrifiable’ neighborhoods were African-American. I have a chapter on the role of race in my book, The Divided City, but even more, I recommend you read Thomas Sugrue’s book, The Origins of the Urban Crisis.
What are the best methods for incorporating cost of living into poverty comparisons? Since poverty thresholds do not adjust for cost of living by region, many tracts moving out of high poverty in high-growth metro areas (where costs of living have outpaced incomes) are still just as impoverished on a relative basis.
August Benzow: This is certainly true and a reason why the number of high-poverty neighborhoods presented in the reports is meant to be a subset of economically distressed neighborhoods and not an exhaustive portfolio of neighborhoods where residents struggle to make ends meet. The Census Bureau currently publishes a Supplemental Poverty Rate at the national and state level, which factors in cost of living. If this enhanced poverty rate ever becomes published at the census tract level, it would likely do a better job flagging these areas where cost of living outpaces incomes.
Is the objective to make poverty-stricken people richer, or is the objective to mix more wealthy people with the poorer people to decrease the poverty rate?
August Benzow: A combination of these two approaches likely makes the most sense. Mixed-income neighborhoods have benefits even for their poorest residents, such as better funded schools and better access to employment opportunities. However, as the project’s reports show, part of what is driving the growth and persistence of high-poverty neighborhoods is not just heightened segregation by income, but also more people falling below the poverty line. Reducing the country’s stock of high-poverty neighborhoods has to start with improving the economic standing of the poorest residents of these neighborhoods.
Is there research to show Opportunity Zones affect poverty rates within Census Tracts?
August Benzow: It is still too early in the implementation of Opportunity Zones to determine the impacts of designation on poverty rates as compared to other eligible but undesignated low-income census tracts. That said, we are already seeing the incentive applied to build affordable and workforce housing, invest in high-growth companies, and revitalize manufacturing on former brownfield sites, to name a few examples. Our OZ Activity Map highlights Opportunity Zones investments, funds, and initiatives across the country that are positively impacting their communities.