
The Neighborhood Poverty Project

In many respects, Indianapolis is an economic success story, an example of a Rust Belt city that has been able to rebuild its economy after shedding manufacturing jobs in the 1970s and 80s. Its population grew by 11 percent from 2000 to 2018, with much of that growth concentrated in and around downtown. Looking at job growth across industries is more of a mixed story. The city has lost another 26,000 manufacturing jobs since 2000, even though it more than made up those job losses with big gains in the professional and business services, education, and health sectors, which combined added 54,000 jobs to the city’s economy. Yet some parts of the city are falling behind as Indianapolis becomes more dependent on knowledge economy jobs.
Remarkably, unlike many legacy cities, Indianapolis has very few persistently high- poverty neighborhoods. Only four neighborhoods have been persistently poor over the past 38 years. Other Midwestern cities that are typically associated with robust knowledge economy growth have far more persistently poor neighborhoods. Columbus, OH, has 17 of them, and Minneapolis, MN, has 13. More distressed cities, such as Cleveland and Milwaukee, have 36 and 28 of them respectively. Part of the explanation lies in the fact that Indianapolis only had 15 high-poverty neighborhoods to begin with in 1980, which was far fewer than its peers. But the bigger story is that Indianapolis’ downtown and many of its adjacent neighborhoods have all seen steep decreases in their poverty rates, pivoting from either high to low poverty or high to moderate poverty (the latter not depicted on the map). All four of Indianapolis’ turnaround neighborhoods are close to downtown.
While this is undoubtedly a positive development, new high-poverty neighborhoods have sprung up on the periphery of the city instead. Indianapolis ranks ninth among U.S. cities for its number of newly poor neighborhoods. By comparison, the city ranks 16th for total population. In total, one-quarter of the city’s neighborhoods, home to one-fifth of its population, are now high poverty.
The city’s Far Eastside, 12 miles from downtown, is an example of a community that prospered in the boom period after World War II only to be hit hard by the loss of manufacturing jobs, after which smaller businesses and much of the area’s retail disappeared in turn. The community now even lacks a grocery store. One census tract in the Far Eastside saw its poverty rate climb from 12 percent in 1980 to 27 percent in 2010 to 34 percent in 2018, while the poverty rates in other nearby tracts climbed from below 10 percent in 1980 to above 40 percent in 2018. These high-poverty neighborhoods on the east side of the city, along with most of those to the north of the city, are majority Black, but many of the new high-poverty neighborhoods south of downtown are majority white. One such tract, which is 75 percent non-Hispanic white, saw its poverty rate climb from 11 percent in 1980 to 35 percent in 2018.

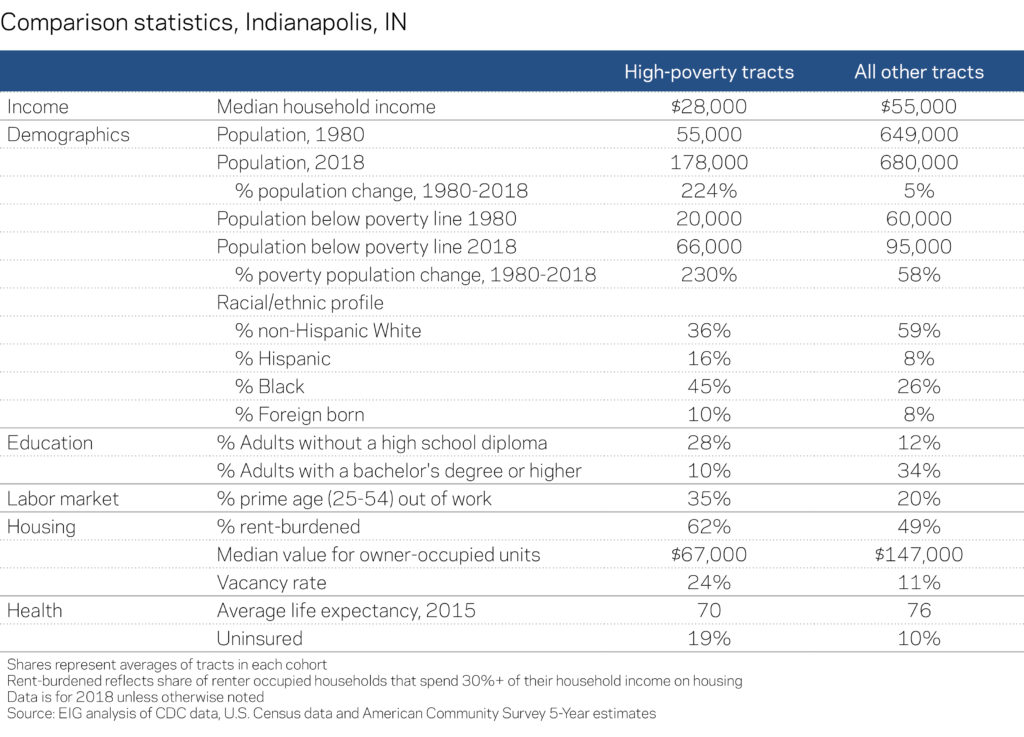
Unlike many other cities, the population of Indianapolis’ high-poverty neighborhoods is more evenly distributed by race and ethnicity: 45 percent of the population of Indianapolis’ high-poverty neighborhoods are Black, 36 percent white and 16 percent Hispanic. The biggest change from 1980 is the Hispanic share, which was just 1 percent in 1980 when there were fewer than one-thousand people who identified as Hispanic living in the city’s high-poverty neighborhoods, compared to 31,000 today. Indianapolis also has an especially high housing vacancy rate of 24 percent in its high-poverty neighborhoods, identical to cities such as Cleveland and Cincinnati. This provides yet another indication that Indianapolis combines multiple archetypes—traditional Rust Belt with pockets of severe distress, on the one hand, and burgeoning knowledge-based economy, on the other.