By: Kenan Fikri, August Benzow, and Nora Esposito
Key Findings:
- The economic trajectory of politically important “flipped” counties, which generally experienced a weak recovery prior to the 2016 election, did not meaningfully change during the first two years of the Trump administration.
- Flipped counties continued to lag far behind on employment and business establishment growth through the end of 2018. The employment growth gap between flipped counties and the rest of the country grew wider over the past two years.
- 53 percent of flipped counties lost population from 2016 to 2018, and a staggering 94 percent have lost prime working age population over the past decade.
- Flipped counties added jobs at less than half the rate of both the comparison groups and the nation as a whole between December 2016 and December 2018.
- Flipped counties have seen their share of the national totals of jobs, businesses, and population diminish over the past two years, as they added jobs, business establishments, and residents in far lower volumes than would have been proportional.
- Growth rates have converged across consistently Democratic and consistently Republican counties due to somewhat decelerating growth in Democratic areas and modestly accelerating growth in Republican areas over the first two years of the Trump administration.
Introduction
Although the May 2019 U.S. jobs report showed some signs of a mild slowdown, the recovery’s jobs engine remains remarkably strong nine years into the economic cycle. Unemployment continues to plumb historic lows across much of the country and lingers near a 50-year low of 3.6 percent at the national level. Earnings have surged in recent months, especially for lower wage workers. Prime working age employment-to-population ratios continue to improve. Springtime headwinds aren’t yet strong enough to declare an end to the good times.
Yet for all the positive news, there remain significant pockets of labor slack across the country and in the population. Sixty-six metro areas still registered an unemployment rate of 5.0 percent or higher in the most recent available data, for example. Unemployment among blacks, though near record lows, remains 3.4 percentage points higher than among whites. And labor force participation economy-wide is still below pre-recession levels; among prime working age white men, it continues to decline.At the industry level, some sectors, such as manufacturing, have seen a surge in job growth rates over the last two years. Meanwhile, sectors like professional services and construction have remained on stable growth trajectories. Other sectors, including health and agriculture, have seen a slowdown in recent years. After increasing employment over the early years of recovery, retail, for its part, proceeded to shed 179,000 jobs over the last two years.
How these economic trends play out across the political map is of increasing interest as the 2020 election looms nearer.
This analysis tracks recent growth trends across three politically relevant geographies:
- The 489 counties that Hillary Clinton carried in the 2016 election, most of which typically vote Democrat in national elections. These counties overwhelmingly represented major metropolitan areas or minority-heavy rural ones.
- The 207 counties that Obama carried in both the 2008 and 2012 elections, but which went to Donald Trump in the 2016 election. These are the so-called “flipped’ counties that determined the outcome of the election.
- The remaining 2,403 generally small-city, suburban, exurban, and rural counties that have voted consistently Republican in recent presidential elections
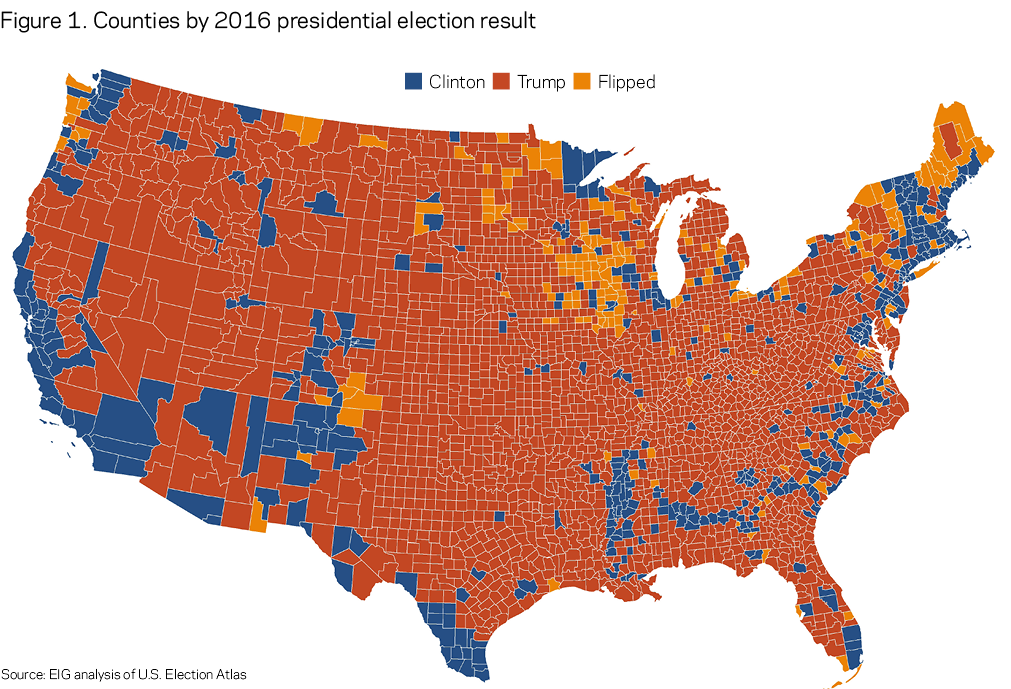
Specifically, we drill down into the pivotal subset of counties that flipped to explore whether this tract of the map that proved to be economically disconnected ahead of the election—and politically in flux through it—has seen a meaningful uptick in economic growth in the two years since. To the extent that flipped counties remain up for grabs, the answer may have implications for the 2020 presidential race.
According to EIG’s Distressed Communities Index (DCI), flipped counties came from across the spectrum of national economic well-being: Over half fall into the comfortable or mid- tier quintiles on the index, and as many are economically distressed as are truly prosperous. They range from Suffolk County, NY (Long Island) to Montgomery County, OH (Dayton). They stretch from the rural south to the Iowa plains, and from the border with Mexico to Washington’s Olympic Peninsula.
What they share is direction: As a general rule, flipped counties were more likely than consistently Democratic or Republican counties to have suffered a severe downturn during the Great Recession and to have experienced a sluggish recovery afterwards. Well-being may look stable on the DCI, in other words, but in a more dynamic sense flipped counties represent a distinct cohort of places that have generally been bypassed by the upsides of recent economic change. The reasons these counties shifted their political allegiances may not be strictly economic, of course, since many different factors shape political preferences. To the extent that an economic thread unites them, however, their performance over the first two years of the new administration bears special relevance.
Economic and Demographic Stagnation Define Flipped Counties
Flipped counties have slower growth in employment and business establishments.
The Bureau of Labor Statistics’ Quarterly Census of Employment and Wages (QCEW) provides data on employment levels and business establishment counts at the county level. The recently released data through the end of 2018 allow us to analyze trends over the first two years of the Trump administration and compare them to the last four years of the Obama administration. The following analysis examines counties for which both QCEW data and 2016 election data are available: 3,089 counties total and 204 of 207 flipped counties.
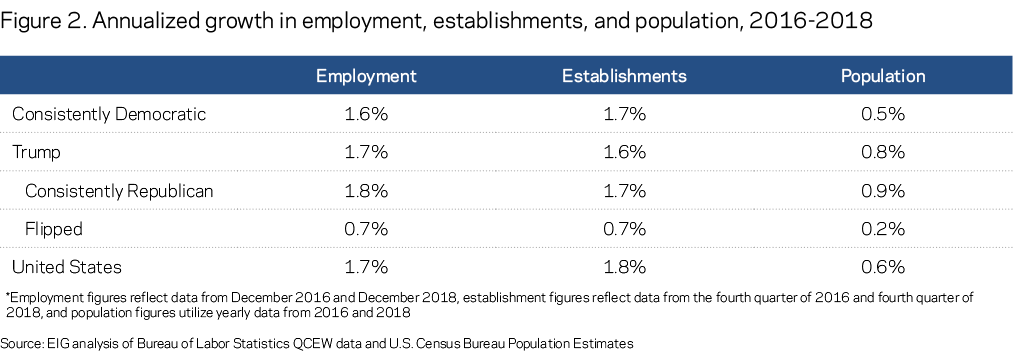
The data for all private businesses show that flipped counties experienced slower growth in employment and a slower rise in the number of business establishments than counties that remained consistently Democratic or Republican between the two most recent presidential elections. Flipped counties increased employment at less than half the rate of either comparison group or the nation as a whole. Figure 2 shows that employment across flipped counties increased by 0.7 percent annually from December 2016 to December 2018, compared to the 1.6 percent increase registered across consistently Democratic counties and the 1.8 percent increase across the remaining Republican counties.
The nation’s new business establishments were similarly distributed. Flipped counties added businesses at less than half the rate of comparison groups, seeing numbers rise by 0.7 percent on average annually from the fourth quarter of 2016 to the fourth quarter of 2018, compared to 1.7 percent among both consistently Republican and consistently Democratic counties.
Variation exists within each cohort, of course. Among flipped counties, 22 percent experienced employment growth at or above the national rate over the two-year period, while 37 percent lost jobs outright. By comparison, 36 percent of consistently Democratic counties and 37 percent of consistently Republican counties added jobs faster than the national figure.
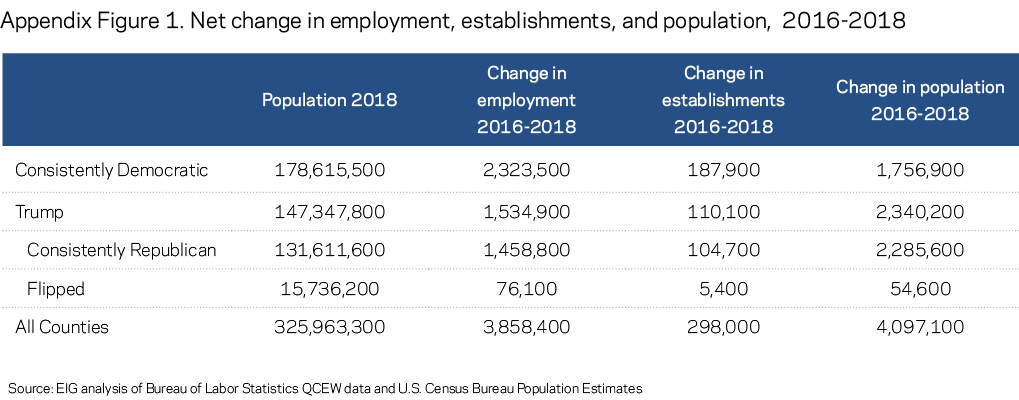
Total employment across flipped counties rose by 76,100 jobs, which represented only 2 percent of the national increase (compared to their 5 percent baseline share of total population). As a result, flipped counties are slowly losing relative economic significance, as the rest of the economy grows faster around them. See Appendix Figure 1 for a look at absolute increases across the three metrics assessed here for each cohort.
Flipped counties are also facing lackluster population trends.
Differences in population growth can explain some of the variation. The total population of flipped counties as a group increased by only 0.2 percent annually from 2016 to 2018, compared to 0.6 percent at the national level. Fifty-three percent of flipped counties actually lost population over the period.
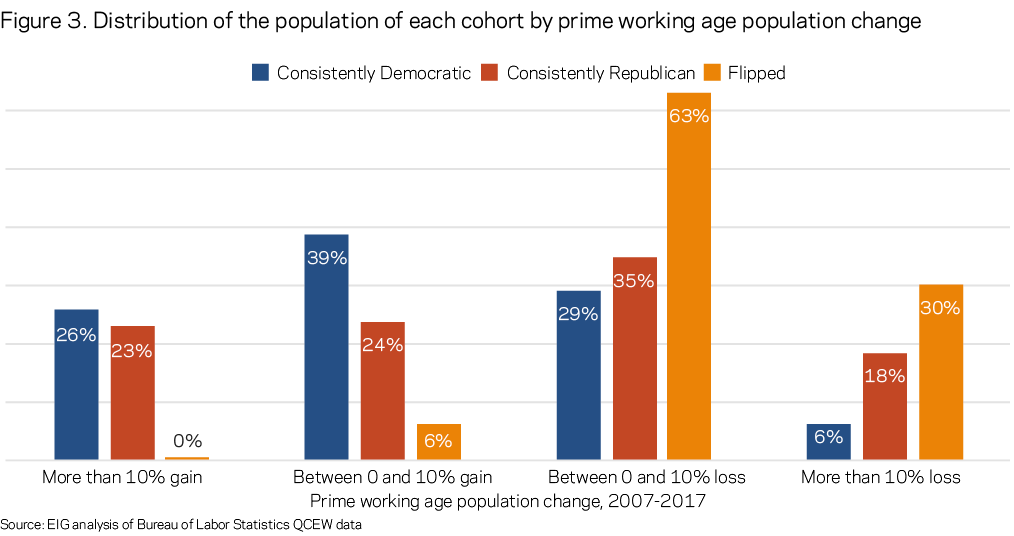
Looking just at prime working age residents (ages 25-54), nearly all of the population of flipped counties (93 percent) live in places that lost prime working age population from 2007 to 2017. By comparison, 53 percent of the population of consistently Republican counties live in a county that lost prime working age population and just 35 percent of the population of consistently Democratic counties live in such a county. Loss of prime working age residents can diminish economic dynamism as the local workforce shrinks, the effects of which reverberate through the local economy, for example via housing markets and municipal finances.
Adding jobs and businesses in the face of such headwinds is challenging; indeed demographic stagnation may be a driving force behind the economic stagnation that characterizes this otherwise relatively disparate group of places. Yet the relationship between population growth and economic indicators is neither simple nor strictly causal. Changes in population can drive changes in local services sectors, for example, but industry mix and the health of local employers matter too.
Basic trends are little changed since 2012
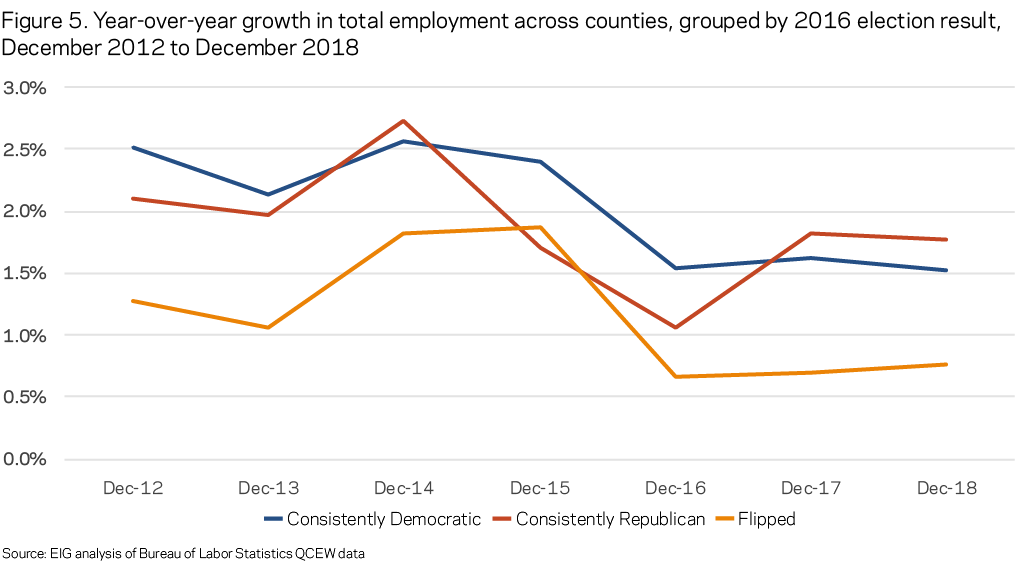
Taking the data back to 2012 provides additional perspective. Figure 4 shows that annualized employment growth rates have decelerated in the Trump era across the United States from 2.1 percent from December 2012 to December 2016 to 1.7 percent from December 2016 to December 2018. All cohorts of counties experienced decelerating rates of job growth, but the slowdown was modest among consistently Republican Trump counties. Consistently Democratic counties experienced the sharpest slowdowns across the board, reflecting perhaps a later, slower stage of expansion in the major metropolitan counties that had dominated national growth for several years prior to the election. Indeed, the end result of consistently Democratic counties’ slowdown is a broad convergence in growth rates across consistently Democratic and consistently Republican cohorts. Flipped counties remain an exception to this convergence, as the employment growth gap actually expanded between flipped counties and the rest over the past two years.
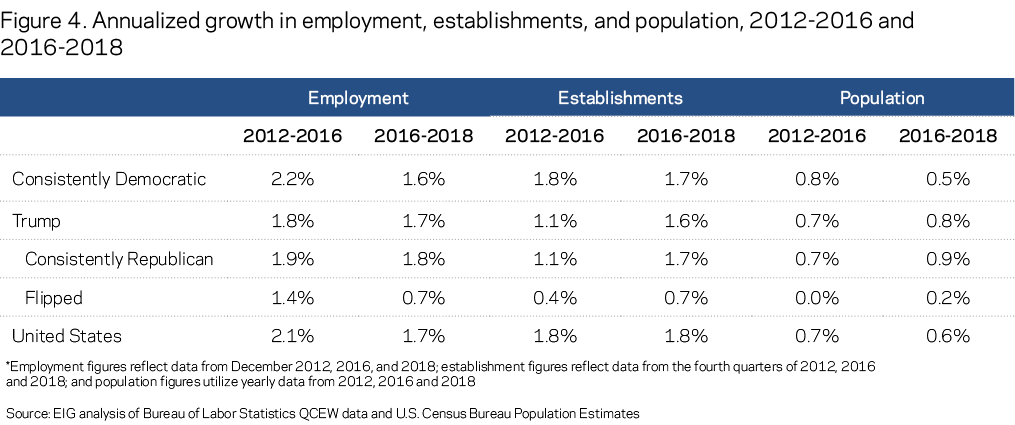
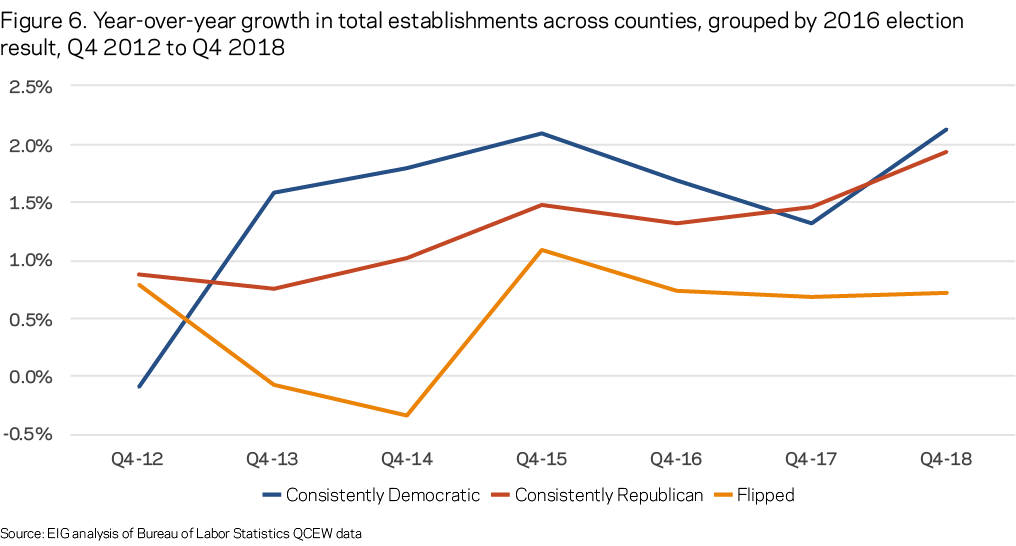
While employment growth slowed, the annualized rate of increase in business establishments remained unchanged between the two periods at the national level. The modest slowdown in consistently Democratic counties was offset by meaningful increases across both cohorts of Trump counties. Comparatively robust population growth across consistently Republican counties likely did its part to support business expansions there. Despite the small bump, flipped counties remained a full percentage point behind consistently Republican and consistently Democratic counties alike on establishment growth, and population growth was only a fraction of their peers’.
Again, the pattern of convergence between consistently Democratic and consistently Republican counties is clear, as establishment growth rates over 2017 and 2018 across both cohorts were nearly equal. Flipped counties remained outside of the trend of convergence.
Conclusion
The country’s political landscape is being changed by economic, demographic, and technological trends that are decades in the making. The national economy continues to enjoy record growth even as “left behind” places fail to see the same gains. The outsized political power of these “left behind” places, embodied in the group of flipped counties, was apparent in the 2016 election. Had voters in counties that switched party allegiances between the Obama and Trump eras hoped for a change in economic trajectory, their hopes have so far been unfulfilled.
What, if anything, has changed over the first two years of the Trump administration? Employment growth has continued, albeit at a slower pace. Business establishments have proliferated faster among the rural, exurban, and flipped counties that President Trump carried relative to before the election. But the gaps between left behind places and the rest have not meaningfully narrowed.
Places don’t change overnight, and any president has limited power to reorganize local economies. Historic trends like flatlined population growth and shrinking workforces require sustained, meaningful economic growth to see any kind of reversal. However, among voters there is a strong belief in the power of the executive branch. To the extent that flipped counties’ political swing reflected voter dissatisfaction with the status quo, the latest data provide no evidence that their trajectories will have meaningfully changed by 2020.
Download the data for this report here.