By: Kenan Fikri and August Benzow
Key Findings
- Manufacturing job growth accelerated at the national level and in every region over the first two years of the Trump administration. The annualized rate of job growth rose to 1.9% at the national level as the sector added 465,200 jobs between December 2016 and December 2018. That represents the largest volume of new manufacturing jobs created over a two-year period since before the recovery. Growth has continued through 2019, and by May there were 12.8 million employees in manufacturing in the United States, the most since December 2008.
- The employment surge was broadly felt but still uneven. A majority of counties (57%) saw their manufacturing growth rates improve, with either growth accelerating or decline slowing, over the first two years of the Trump administration relative to the last four years of the Obama one.
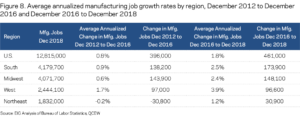
- Manufacturing’s expansion was broad-based across regions, but on average counties in western states saw the highest annual growth rates from December 2016 to December 2018. The South created the largest sheer number of new manufacturing jobs over the past two years: 173,900.
- Economically distressed counties are now benefiting from manufacturing’s continued expansion. Nearly two-thirds of them added jobs in the sector from December 2016 to December 2018. Over the four years prior, the average distressed county lost on average 0.5% of its manufacturing jobs; between December 2016 and December 2018, it added jobs again at an annual average rate of 2.9%.
- After two years of accelerated growth, the U.S. manufacturing sector is now showing signs of slowing down. Since February of 2019, the sector has added just 13,000 jobs, compared to 93,000 in the prior four month period. Production, new orders and exports also saw declines in recent months.
Introduction
Manufacturing’s rebound is real. After shedding manufacturing jobs relentlessly between the turn of the century and the Great Recession, the United States has now added them in 82 out of 100 months since January 2011. Such a turnaround is remarkable in a sector in which employment shrunk by nearly one-third between 2000 and 2010. As the 2020 election looms on the horizon, manufacturing, which has always occupied an outsized position in the American political consciousness, is sure be looked to as a barometer for the performance of the economy under President Trump.
An analysis of recent trends shows that the sector has been steadily adding jobs since 2010—doing its part to fuel one of the longest economic expansions in U.S. history. Annual average job growth in the sector accelerated further over the past two years, rising from 0.7% from December 2012 to December 2016—the last four years of Obama’s presidency—to 1.9% during the first two years of the Trump administration. This acceleration translates into nearly 144,400 extra manufacturing jobs added to the economy annually above trend since Trump took office.
Manufacturing’s rebound looks somewhat patchier underneath the national statistics, however, and there is intense variation within and across regions. An analysis of the latest Bureau of Labor Statistics numbers through December 2018 shows that approximately two-thirds of counties participated in manufacturing’s employment surge from 2016 to 2018 by adding jobs on net. The sector remained in retreat across the other one-third of the landscape.
The National Story
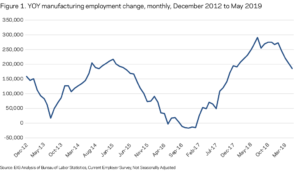
Manufacturing’s employment growth since 2010 has followed a pattern of two-year surges followed by slowdowns. During the most recent surge, from December 2016 to December 2018, the U.S. manufacturing sector added 465,200 jobs, the largest volume of new manufacturing jobs created over a two-year period since before the recovery. The rate of manufacturing job growth even pulled ahead of the rate of total U.S. job growth for several months in 2018. The latest available data at the national level point toward another slowdown, however, as trade tensions weigh on a sector that was already passing a cyclical peak (see chart below).
Most manufacturing subsectors saw modest to healthy growth in jobs from December 2016 to December 2018. A veritable boom was underway in food and beverage manufacturing, which added 84,400 jobs to the economy from December 2016 to December 2018. Beer, wines, and spirits accounted for much of that growth, adding 29,700 jobs and growing by 22% over two years. Job losses were concentrated in apparel and print-related industries. Those industries combined were responsible for a loss of 28,700 jobs.
Despite the sector’s consistent expansion over the past several years, recent progress must be placed in broader context. The U.S. economy is still far from recovering all of the manufacturing jobs lost between 2000 and 2010 due to offshoring, automation, and the Great Recession. Even on the current trajectory, it would take over two decades for total U.S. manufacturing employment to return to 2000 levels.
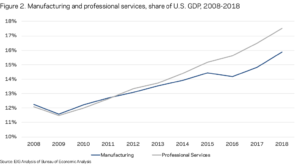
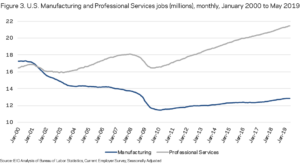
Of course, employment growth is neither the only nor necessarily the best metric to assess the economic vitality of any sector, including American manufacturing. Technological advances have allowed manufacturers to do more with the sector’s shrinking workforce: Manufacturing’s share of U.S. GDP has grown steadily since 2008, from 12% to 16%—increasing by a quarter. Manufacturing now contributes more to U.S. economic output than it did 10 years ago. However, manufacturing employment has been far surpassed by that of the professional services sector. In January 2000, there were 5% fewer business and professional services jobs in the United States than manufacturing jobs, whereas by May 2019 there were 67% more professional services jobs. Nevertheless, manufacturing—both in terms of employment and output—remains a cornerstone of the U.S. economy.
The Geography of Manufacturing Job Growth
In general, the past two years broadened the geography of manufacturing’s rebound. This factor, rather than an intensification in growth in the places that were already doing well, explain much of the national level acceleration in the sector.
The number of counties adding manufacturing jobs has increased
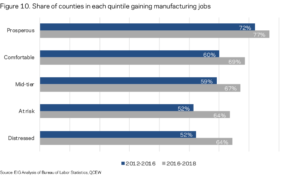
An examination of data from the Bureau of Labor Statistics’ Quarterly Census of Employment and Wages (QCEW) shows that more than two-thirds (68%) of counties gained manufacturing jobs from December 2016 to December 2018, over the first two years of the new administration. By contrast, only 59% added manufacturing jobs over the last four years of the Obama administration. Manufacturing employment across these counties increased by 588,700 positions. The other one-third of counties lost a combined 139,200 manufacturing jobs over the same period—far fewer than the 371,000 manufacturing jobs lost in declining counties over Obama’s second term.
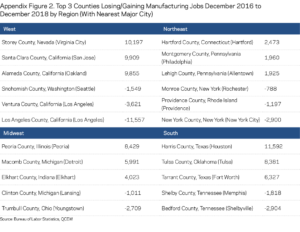
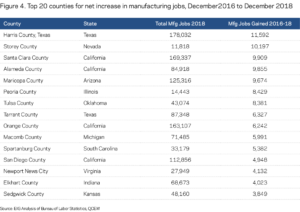
The top 20 counties for absolute increase in manufacturing jobs over the two-year period together added 126,600 jobs to the positive side of the ledger. Of these counties, four were in California, four in Texas and two in Michigan. They reflect a diversity of strengths in the sector, representing a mix of counties specializing in technology, energy, transportation equipment, aerospace, metals, instruments, and more.
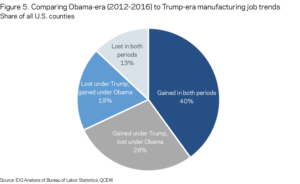
Comparing how trajectories have changed since 2016, we find that 40% of counties gained manufacturing jobs during both Obama’s second term and over the first two years of the Trump administration. A further 28% of counties moved into the growth column over the past two years, while 19% tipped into decline. Roughly one in eight counties lost manufacturing jobs over both periods. All together, 57% of counties saw their manufacturing growth rates improve, with the remaining 43% experiencing either slowing growth or worsening decline.
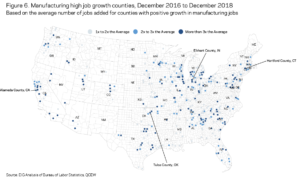
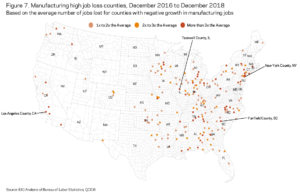
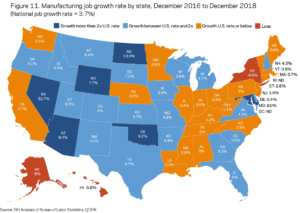
The maps below highlight the landscapes of manufacturing job growth and loss from December 2016 to December 2018 by showing the counties that gained or lost jobs faster than the average growth or loss county, respectively. Pockets of especially fast growth could be found in every region, although the West contained disproportionate numbers of high-growth counties (and disproportionately few steep-loss ones). In the South, high-growth manufacturing counties concentrated around major metro areas such as Nashville, Atlanta, and Charlotte, while several rural manufacturing counties registered high rates of job loss. The story in the Midwest and Northeast was even more jumbled, with high and low growth counties sometimes side by side even within the same metropolitan area.
Manufacturing’s expansion was broad-based across regions
The average western county added manufacturing jobs at an annual rate of 3.9% from December 2016 to December 2018, the highest in the country. That figure also represented a sizable acceleration over the 1.7% annual growth rate registered in the typical western county from December 2012 to December 2016. Somewhat miraculously, given that the United States as a whole closed 2018 with 4.6 million fewer manufacturing jobs than it contained in 2000, nearly one-quarter of U.S. counties (24%) now contain more manufacturing jobs than they did at the turn of the century. In the West, the figure is 42%.
In aggregate, however, the West, South, and Midwest all contributed significantly to manufacturing’s forward momentum over the past two years. Combined rather than on average, all counties in each region together added jobs at roughly the same rate, around 2.0%. With their already-expansive manufacturing bases, the Midwest and South remain the sector’s high-volume job creators, too. The manufacturing spurt over the past two years even reached the Northeast, which swung from decline from December 2012 through the end of 2016 to 0.9% growth annually thereafter.
Manufacturing job growth has finally reached many economically distressed areas
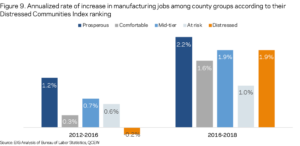
According to EIG’s Distressed Communities Index, counties up and down the spectrum of economic well-being added manufacturing jobs over the two years to December 2018. Yet the biggest news came from the bottom quintile of counties, which the index labels distressed: these economically struggling, often rural counties added 21,000 manufacturing jobs over the first two years of the Trump administration after grappling with decline from 2012 to 2016. Their collective rate of job growth swung more sharply than any other quintile.
Across the board more counties participated in manufacturing’s rebound, with at risk and distressed counties accounting for just over half of the newcomers to the growth club from December 2016 to December 2018.
Even more dramatic, the annual change in manufacturing jobs for the average distressed county swung from -0.5% from December 2012 to December 2016 to 2.9% from December 2016 to December 2018. As the U.S. manufacturing sector continues its expansion, it appears that job gains are increasingly penetrating into more struggling corners of the country.
Recent gains aside, only five states contain more manufacturing jobs now than they did in 2000
At the state level, 26 states registered manufacturing job growth rates that exceeded the national one over the recent period. Texas added the largest absolute number of manufacturing jobs from December 2016 to December 2018: a total of 56,300 jobs, or approximately 21,000 more jobs than California, the state with the second largest absolute increase. Nevada added manufacturing jobs at a rate of 33% from 2016 to 2018, the highest figure in the country and largely driven by the high-tech industrialization of Storey County. Low-population western states, such as Montana and Wyoming, also registered high rates of growth. Three states lost manufacturing jobs outright from December 2016 to December 2018, with New York posting the highest loss of 2,500 manufacturing jobs.
Many Midwestern states saw sizable absolute increases in manufacturing jobs from December 2016 to December 2018 but still added jobs at a lower rate than the United States as a whole. What is more, their different historical baselines provide for more sobering outlooks: Pennsylvania’s manufacturing base, for example, now employs only two-thirds the number of people it did in 2000. The state would have to keep adding the same number of manufacturing jobs it did over the past two years—5,570 jobs annually—for another 35 years to get back to where it was 18 years ago. To see how this compares to other states, the table at the bottom of this post expresses 2018 manufacturing jobs as a share of 2000 levels for all states and DC. Only five western states—Nevada, Alaska, North Dakota, South Dakota, and Utah—contained more manufacturing jobs at the end of 2018 than they did in 2000.
Concluding Thoughts
After a tumultuous start to the new century, manufacturing in the United States has not only stabilized but become a reliable contributor to U.S. job and output growth. Yet below the national level, the story is far more complicated. Manufacturing, and its geography, continues to evolve.
Whether or not manufacturing’s comeback feels real varies from one county to the next. Saratoga County, New York, is seeing a manufacturing boom driven by GlobalFoundries’ computer chip production, while much of the rest of New York state continues to lose manufacturing jobs. Tesla’s giga-factory in Storey County (combined with the near total absence of a manufacturing sector in the state prior to the financial crisis) explains how Nevada now has 30% more manufacturing jobs than it did in 2000. As manufacturing becomes more tech-enabled and automated, it can blossom in places where labor is specialized and expensive (Santa Clara or San Diego County, CA, for example) as well as in traditional mid-sized heartland metro areas.
At the same time, manufacturing is especially sensitive to developments in the global economy and slight changes in market outlooks or sentiment. In May 2019, the Markit Purchasing Managers’ Index for manufacturing fell to its lowest level since 2009, signaling a slowdown in factory activity. Slowing job growth in early 2019 and a drop in output in March have economists wondering whether manufacturing will fall into a mild recession by the end of the year.
In many ways, manufacturing’s real but patchwork expansion rests squarely in the larger story of the geographically uneven nature of recovery and growth in the wake of the Great Recession. As this economic cycle—the longest economic expansion in post-war history—progresses, questions inevitably arise about the durability of the gains recorded over the recent past and the vulnerability of manufacturing in all U.S. communities to future disruptions and downturns. While shrunken relative to its size in 2000, the sector’s recent history suggests that U.S. manufacturing has realigned. It looks poised to enter into the next downturn on firmer footing than it did the 2009 recession, but the fragility of recent gains remain untested.