By Kenan Fikri
On September 30th the U.S. Census Bureau completed its redesign to the Business Dynamics Statistics program and published long-awaited data through 2018 on the firm-level composition of the U.S. economy. The enhanced dataset now contains rich geographic and industry-level detail and provides essential information on elements of business dynamism that maintain a healthy U.S. economy such as startup rates, firm closure rates, employee churn across businesses, and much more.
Here are five key observations from the new and improved data through 2018, eight years into the decade-long economic expansion that the COVID-19 pandemic brought to an end:
- Startup numbers stagnant: The total number of firms launched in the United States in 2018, approximately 430,600, represented a continued stagnation in the only-partial recovery on this measure experienced in the wake of the financial crisis. In 2018, the country only generated three-quarters the number of startups it did in 2006. To compare against another benchmark: Near the peak of the 2010s expansion in 2018, the United States produced fewer startups than it did during the 2001 recession.
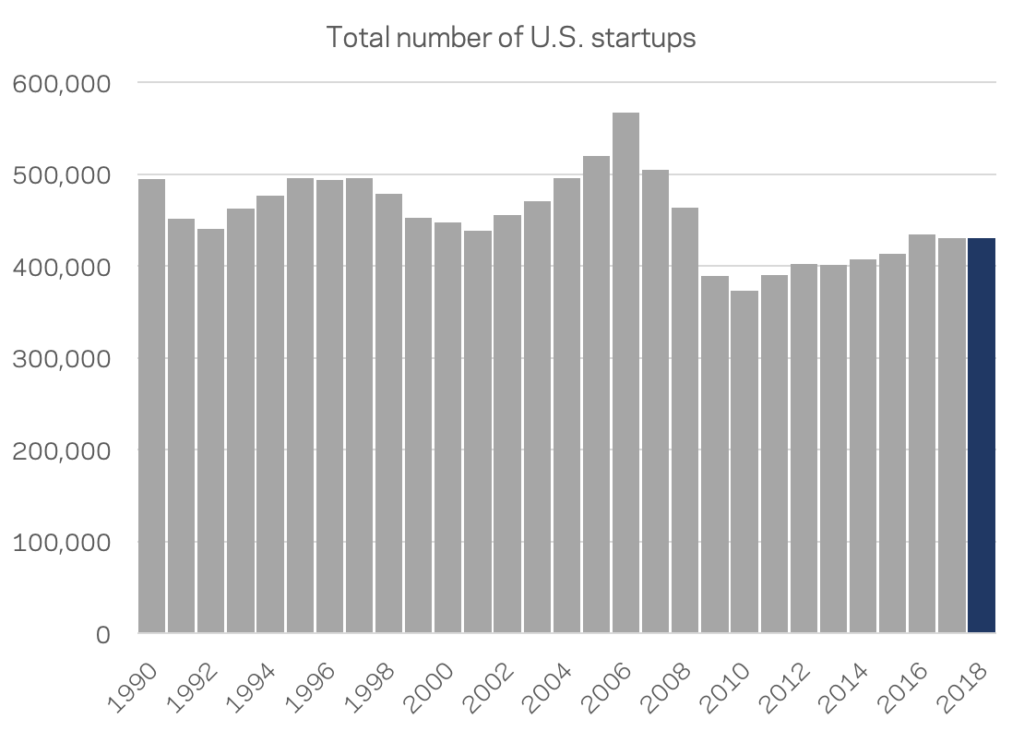

Source: EIG analysis of Business Dynamics Statistics data
- Troubling balance: The startup rate was basically equal to the firm closure rate in 2018. Businesses that failed and closed that year outnumbered those that formed by roughly 2,000. In other words, on net the U.S. economy added no additional firms in 2018—the first time on record this has happened during an economic expansion. Normally during periods of growth, the number of new firms spawned comfortably outpaces the number that are driven to close.
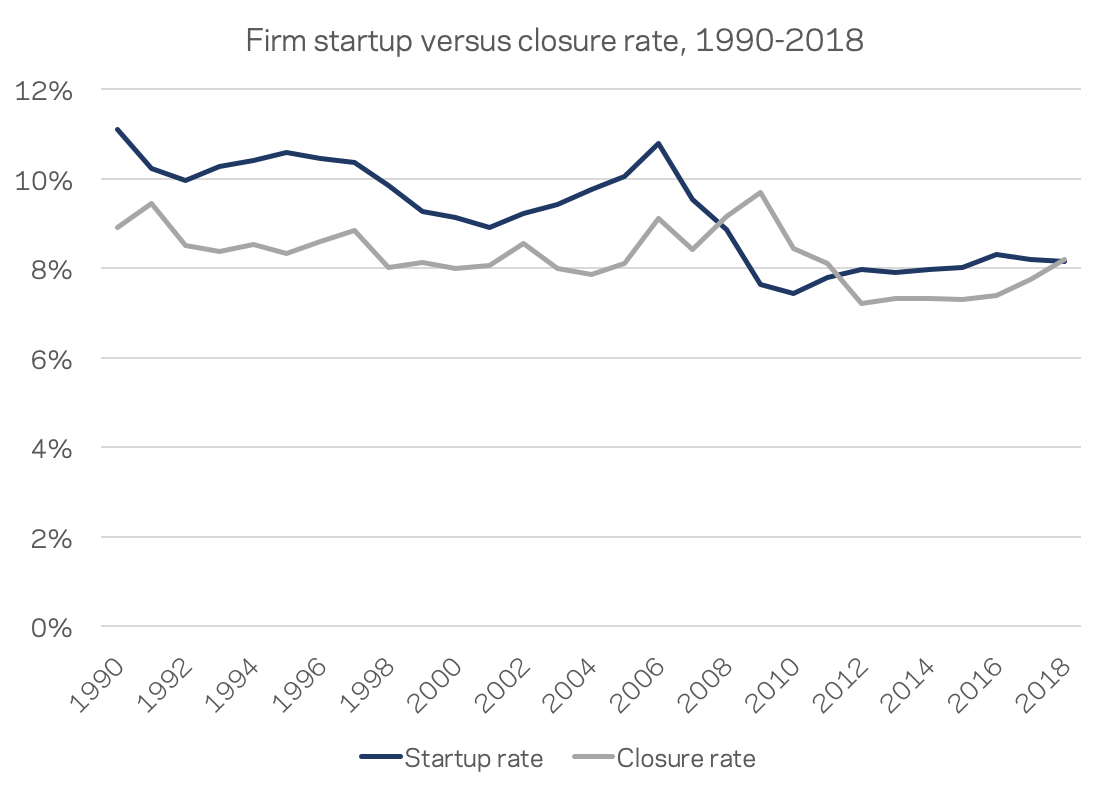
Source: EIG analysis of Business Dynamics Statistics data
- Incumbents on the march: Older firms continued to extend their reach over the American labor force as the share of total U.S. employment accounted for by firms at least 16 years old increased for the twenty-first straight year, climbing to 74.5 percent of all workers. The share of U.S. employment accounted for by startups (firms created in 2018) or young firms (firms aged five and under) has not recovered at all since the Great Recession and remained stagnant at 1.9 percent and 10.4 percent, respectively, in 2018.
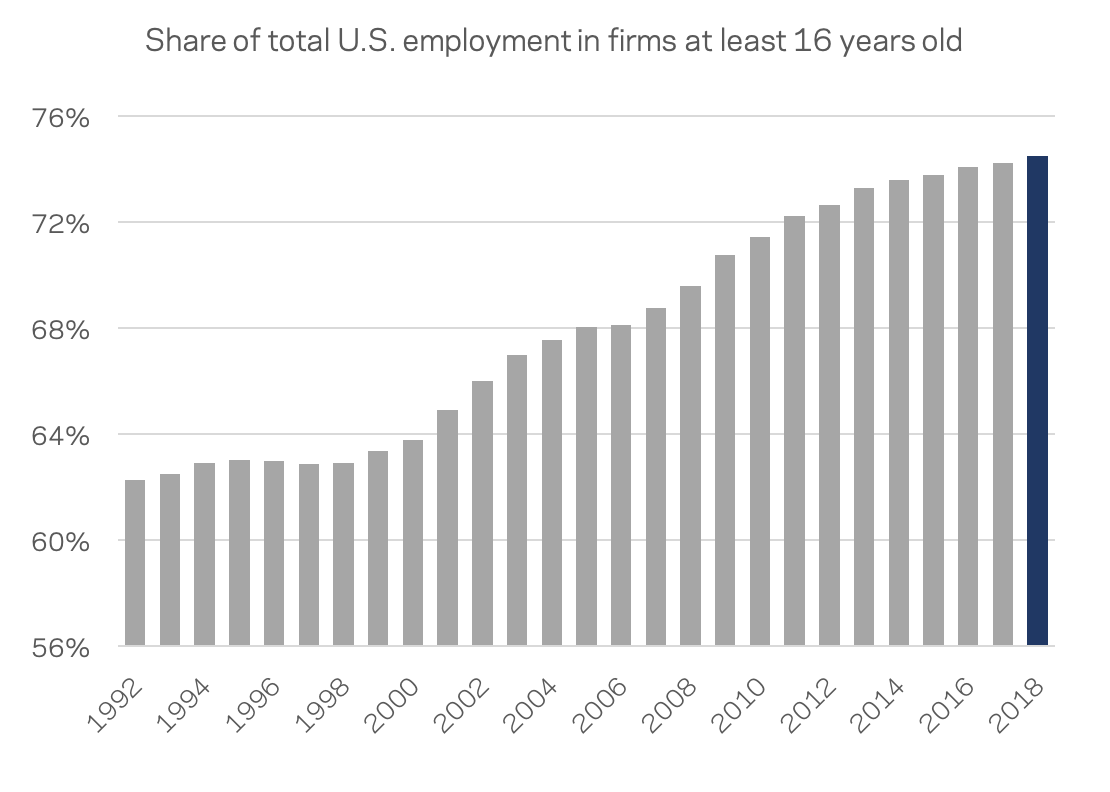
Source: EIG analysis of Business Dynamics Statistics data
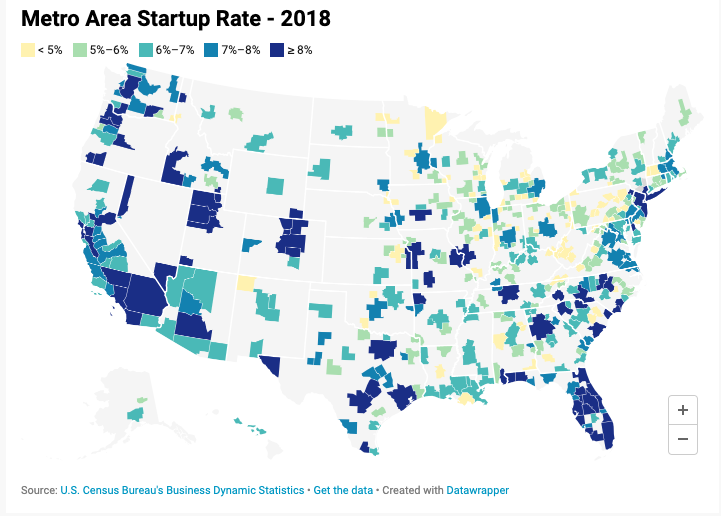
- Regional divides: In total, 53 of the country’s 383 metro areas (or only 14 percent of them) posted startup rates as high or higher than the country as a whole in 2018. This demonstrates strong regional concentration of the nation’s entrepreneurial activity. It also suggests, with startup rates as depressed as they are across the board, that population growth itself is one of the strongest differentiators across metro areas today. A substantial portion of startup activity is accounted for by new businesses forming to supply and service new residents. Accordingly, all of the nation-beating metro areas were located in the fast-growing South and West. Many leading metros are also immigrant gateways (such as Miami, FL) or tech hubs (Austin, TX). Outside of those regions, Des Moines, IA, and New York, NY, just missed the national benchmark. Startup rates in many smaller metro areas in the country’s heartland trail especially far behind—in some cases such as Johnstown, PA, or Danville, IL, with startup rates less than half the national one. Such depressed entrepreneurship makes economic renewal challenging.
- Aging heartland: In much of the Great Lakes region and parts of the South, old firms (defined here as those at least 11 years old due to differences in firm age data supplied at the metro area level) employ overwhelming majorities of the labor force. In some “company towns” such as Columbus, IN, (home to Cummins) and Peoria, IL, (home to Caterpillar), relatively old firms employ 90 percent or more of the local workforce. That compares to dynamic hubs such as Austin, TX, or Boulder, CO, where the figure is just shy of three-quarters.
*******
The pandemic recession has had an ambiguous effect on the landscape of business dynamism. On the one hand, it is shaping up to be a destruction event of massive proportions as numerous small businesses and those in vulnerable sectors fail to survive the crisis. On the other hand, shifts in consumer behavior have created new opportunities to start enterprises— and, for many displaced workers, new necessity. Another more contemporaneous Census Bureau dataset on Business Formation Statistics that tracks applications to start new enterprises shows a welcome spark in entrepreneurial intent. (EIG tracks it each week here). However, other indicators show large incumbent companies cementing their dominance and increasing market share, suggesting that the competitive environment may be turning against new entrants, at least in many sectors. Either way, the latest BDS figures for 2018 show that the country’s economic dynamism was in poor health going into this new crisis. Restoring it will be essential to ensuring a strong, rapid, and inclusive economic recovery on the other side. Stay tuned for much more from EIG on this topic in the coming months.