by Kenan Fikri
The country is headed into the 2022 midterm elections against a very different economic backdrop than it did the 2020 one. The pandemic upended established patterns in the geography of the nation's economic growth. Many rural areas are newly thriving. Corners of the Sun Belt are booming like never before. Superstar metros have been humbled by remote work. This analysis takes stock of how economic conditions have changed across a variety of the country's political geographies, what explains the emergent patterns, and what they may herald for our politics going forward. It finds that, two years into the Biden administration, the pandemic has weighed disproportionately heavily on the president's political heartland and allowed many less-affected Trump-leaning areas to pull ahead.
By early 2022, Trump counties had nearly recovered all the jobs they lost to the pandemic recession
County-level employment data is available through the Bureau of Labor Statistics (BLS) through the first quarter of 2022. By that time, counties that Donald Trump carried over President Biden had nearly fully regained all the jobs they lost to the initial pandemic downturn. By the end of Q1 2022, Trump country in aggregate was roughly 124,000 jobs short of where it stood prior to the pandemic, in Q1 2020. That left it facing an employment shortfall of about 0.3 percent of its former level. Counties carried by President Biden, in contrast, started the year with a continuing deficit of 1.7 million jobs, or 1.8 percent of total pre-pandemic employment.
Biden counties lost nearly four times as many jobs in the first year of the pandemic
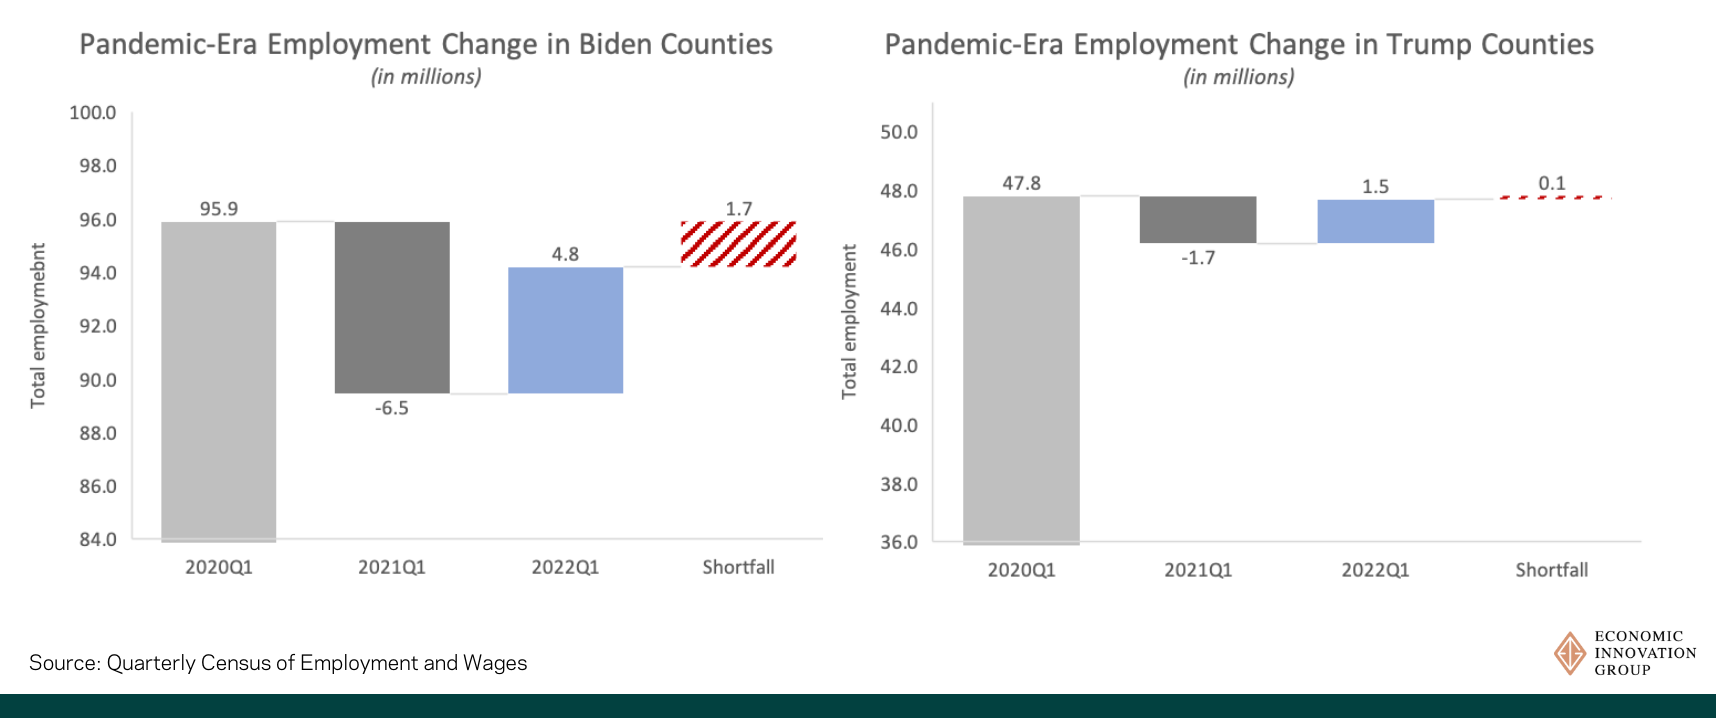
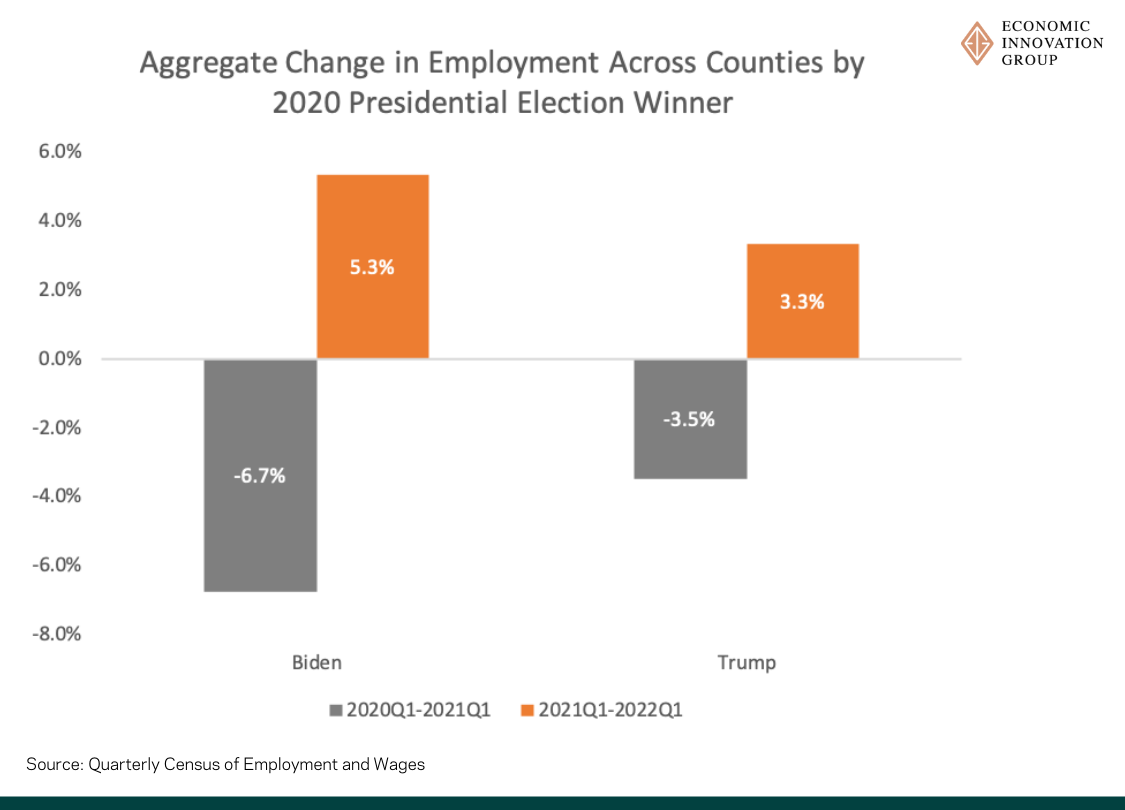
Home to many of the country's largest employment centers, Biden counties contained nearly twice as many jobs as Trump counties at the start of 2020. However, by the end of the pandemic's first year, they lost nearly four times as many jobs as Trump counties. In terms of growth rates, Biden counties have recovered at a faster rate over the year to Q1 2022, albeit confronting a far greater hole out of which to dig. The aggregate employment picture looks better in Trump counties not because growth is faster, but because they have less to recover.
Biden counties are recovering rapidly, but from a deep hole
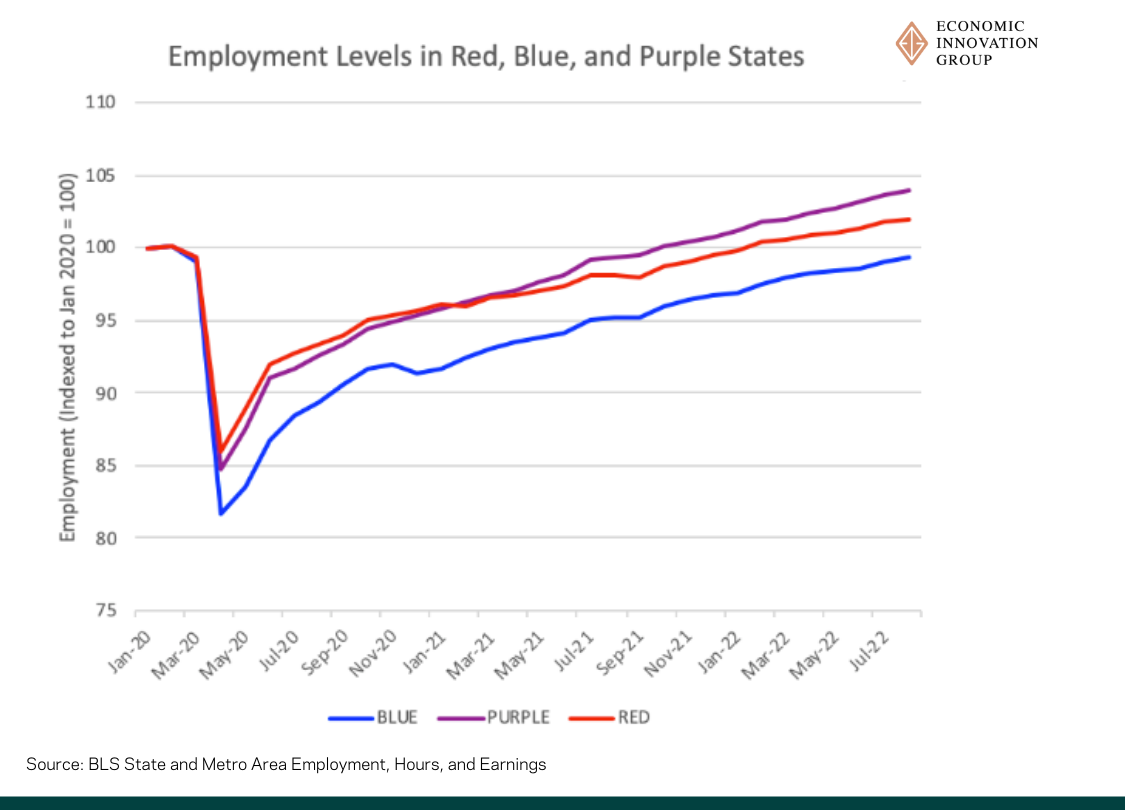
Purple battleground states have led the country's jobs recovery
Consistent with the county-level look, state-level data from the BLS, which extends through August 2022, show that Biden states will only recover all the jobs lost to the pandemic in late 2022 on current trendlines. States that Trump won, by contrast, surpassed pre-pandemic employment levels in January 2022.
Looking towards the midterm elections and a number of hotly-contested Senate races, it is clear that control of the upper house will be determined in some of the country's strongest state economies. As a group, purple states (Arizona, Florida, Georgia, Nevada, North Carolina, and Wisconsin) had recovered all the jobs lost to the pandemic a year ago now, by September 2021 (Wisconsin is the only one of the six still lagging on this measure). Red states followed six months later, in February 2022. Solidly blue states are on track to cross that benchmark by the end of the year, but they show no sign of converging with the purple leaders.
This cycle's most contested elections are taking place in some of the hottest state economies
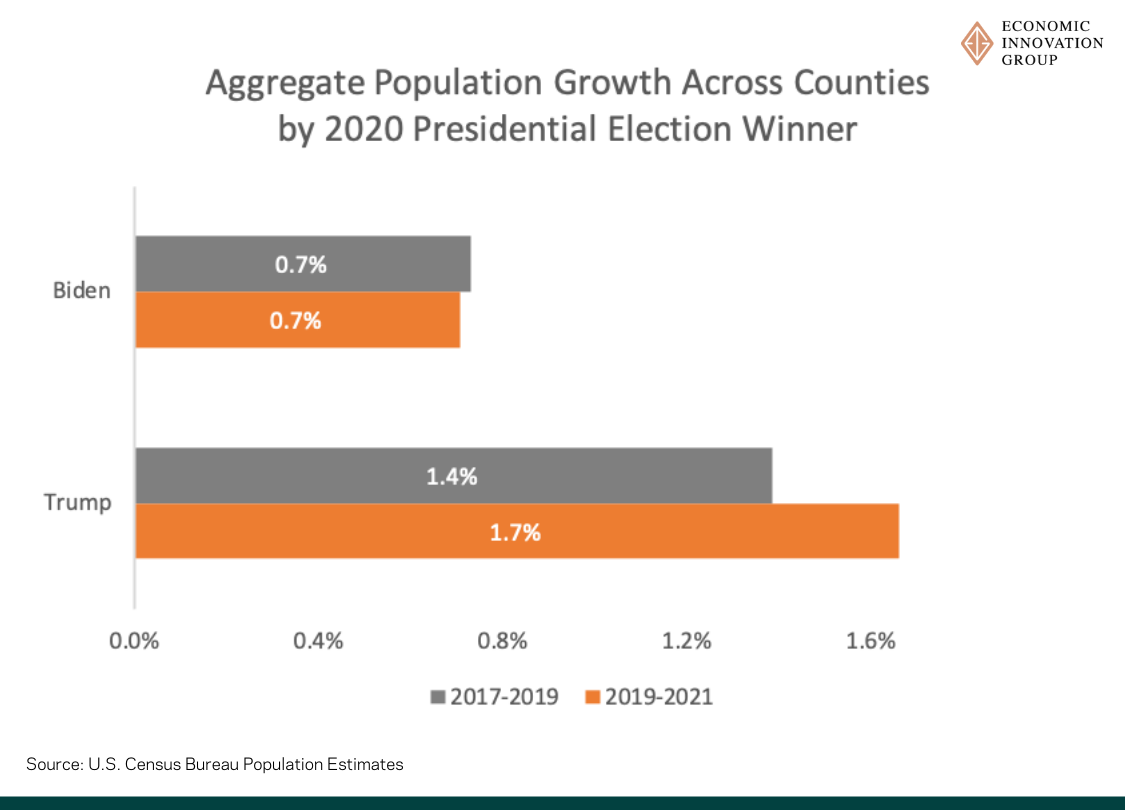
Trump counties continue to enjoy greater population growth
Despite the massive shocks the pandemic delivered to fertility rates, mortality rates, and patterns of domestic and international migration in the United States, Trump and Biden counties have in aggregate continued along established population growth trends. Biden counties dominated population growth in the early 2010s, but by the end of the decade, Trump counties had pulled ahead, growing by 1.4 percent between 2017 and 2019 compared to 0.7 percent in Biden counties. Fast forward to the 2019 to 2021 period and population growth in Trump counties accelerated slightly to 1.7 percent, buoyed by in-migration to rural areas, while Biden country's population growth rate held steady at 0.7 percent.
Population growth has accelerated modestly in Trump counties
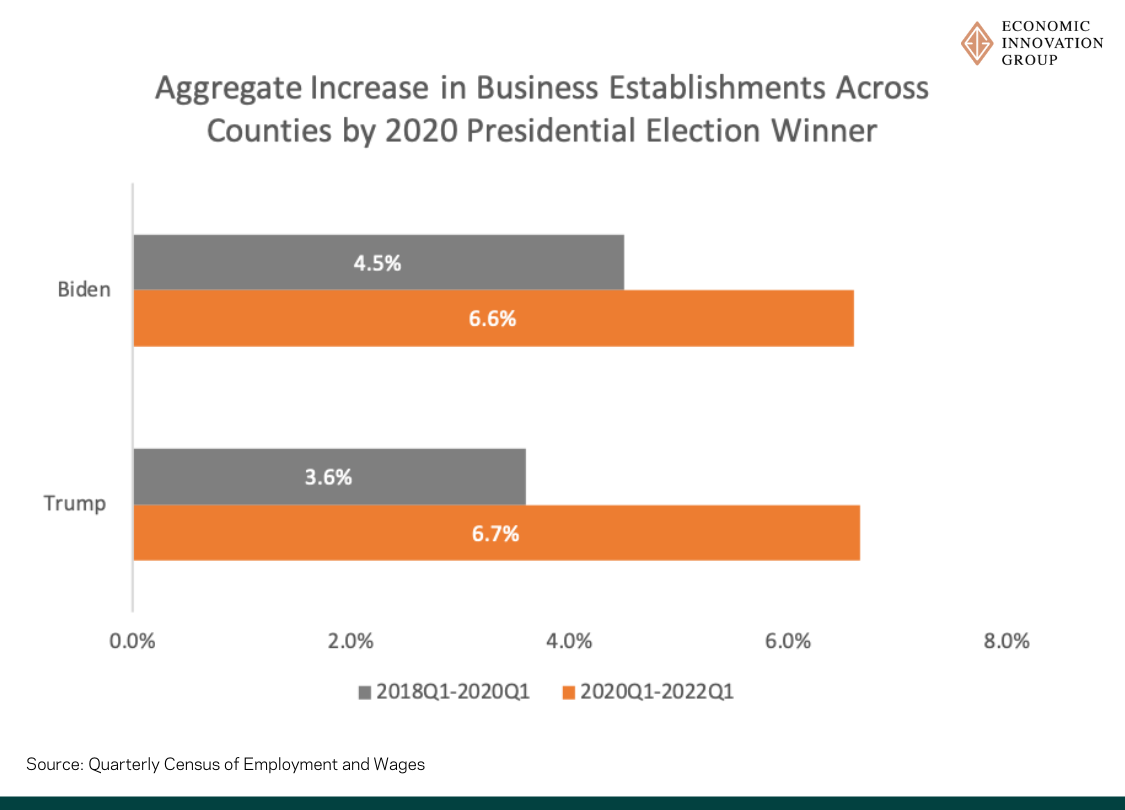
On business measures, political-geographic divides are smaller
The headline performance of Trump and Biden counties is much closer on important indicators of business activity; however, that parity in fact stems from stronger improvements in Trump counties under the Biden administration. The total number of business establishments (i.e. active, physical places of business) rose 6.6 percent in Biden counties from Q1 2020 to Q1 2022 compared to 6.7 percent in Trump counties. This represents more of an acceleration relative to pre-pandemic baselines for Trump counties: between Q1 2018 and Q1 2020, Biden counties saw 4.5 percent establishment growth while Trump counties grew 3.6 percent. In terms of new business applications (i.e. tax-related filings for new employer identification numbers), both Trump and Biden counties have been participating in the nationwide surge, with the number of new applications more than 50 percent above pre-pandemic baselines in both political geographies.
Trump counties now match Biden counties on business establishment growth
On earnings, another important measure, Trump and Biden counties are also neck and neck. Total wages earned by all workers over the first quarter of 2022 stood 10.4 percent higher in Biden counties and 10.5 percent higher in Trump counties than in the first quarter of 2020. Average earnings are consistently higher in Biden counties given the concentration of high-wage industries in urban areas, and average earnings have also grown faster in these places. However, much of that growth reflects a changing composition of the workforce as many low-income service sector jobs were destroyed by the pandemic, raising the overall average.
Inflation is biting harder in red and purple areas
Tempering the enthusiasm that an otherwise robust economy might be expected to foster for the incumbent party in some regions is the fact that inflation is also higher in more Trumpian–and more purple–parts of the country. Solidly blue areas with more labor market slack remain modestly more insulated from inflation's bite.
BLS provides subnational inflation data at the Census division level (these are multistate aggregates; for example, Kentucky, Tennessee, Alabama, and Mississippi comprise the East South Central region). Assigning each state its Census Division's inflation rate, purple states are clearly feeling the most heat: annual inflation in these states averaged 9.1 percent in August 2022, well above the 8.0 percent registered in the average blue state and 8.4 percent in the average red state. Again, these inflation estimates are based on division-level inflation data.
Inflation is running highest in parts of red and purple America
Thus, in the post-pandemic economy, hotter labor markets come with a downside: higher inflation rates. The unemployment rate in the average state Biden won stood at 3.6 percent in August 2022, above the 3.1 percent registered in the average Trump state. On this measure, purple states land in between the two camps, with 3.3 percent unemployment.
Biden areas are still recovering from the initial hit delivered by the pandemic
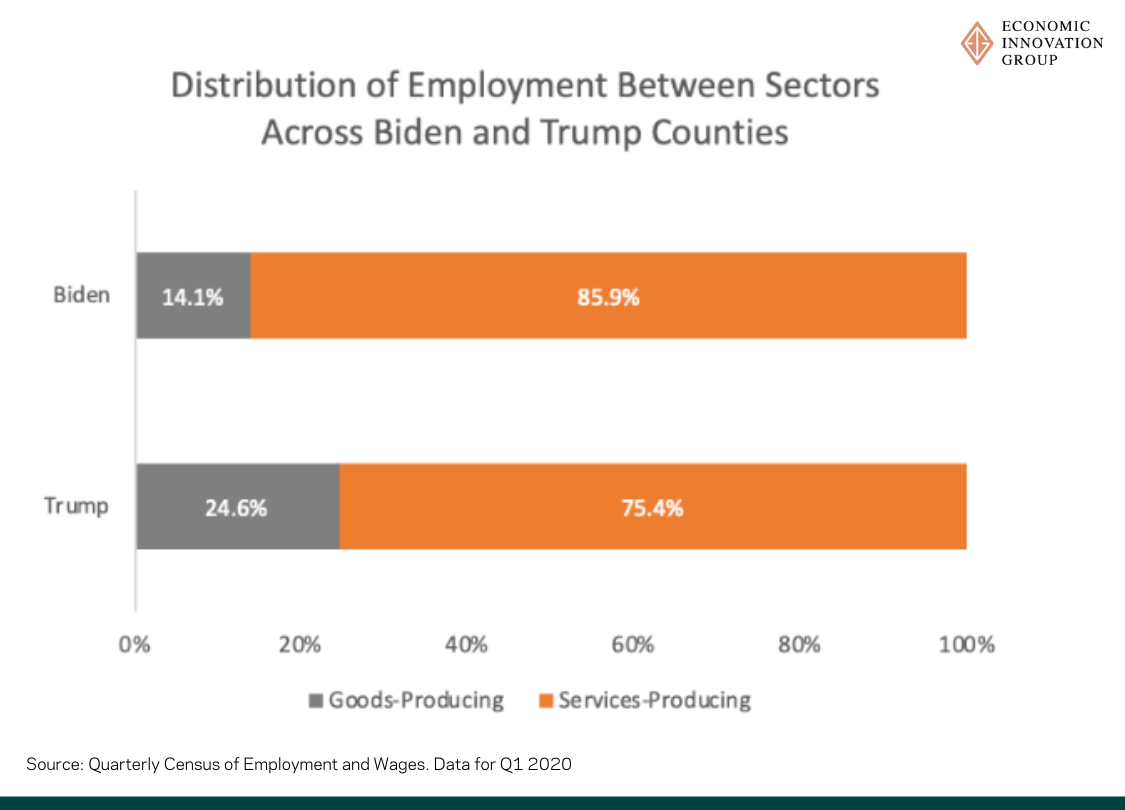
Why is Trump's political heartland performing better from certain economic angles than Biden's? Much of it comes down to luck: Biden counties were predisposed to suffer a relatively more severe blow from the particular economic shock rendered by the pandemic–and Trump counties were predisposed to be more resilient in the face of this particular shock–because of the very different economic and social natures of the competing political geographies.
Biden counties encompass almost all of the country's major metropolitan cores. While a few notable rural enclaves are part of the blue coalition, generally blue counties and states are much more urbanized, making a highly transmissible virus a more acute threat. Residents live at greater densities, commute more frequently via public transit, and consume a broader range of highly differentiated in-person services. They were also more likely to work in remotable knowledge economy jobs, leading to a much more elastic transition to working from home. That transition accelerated the out-migration of residents and served to depress demand for many local commercial services. By contrast, places that preferred Trump were generally more rural and featured economies more oriented arounds goods production, for which demand surged during the pandemic. Cultural factors had economic implications, too—residents of blue counties generally revealed themselves to be much readier to stay at home and social distance than those of red counties, where economic life resumed more quickly.
Differential economic performance stems from differing industry structures
Much of the explanation for the continued jobs shortfall in blue America can be found downtown: Biden counties cover basically every central business district in the nation. The districts are home to far fewer jobs to this day, after much of the downtown economy simply disappeared with the pandemic and rise of remote work. The District of Columbia, for example, hosts the Washington, DC, metro area's central business district and contained roughly 31,500 fewer private sector jobs in March 2022 than it did in March 2020. Cook County, IL, contained 74,400 fewer, and Manhattan (New York County) still confronted a massive 168,600 jobs deficit at the start of the year.
Thus, Trump-leaning areas are doing better on certain labor market indicators because the winds of economic and social change that blew in with the pandemic favored them–with economies more oriented towards goods-production, more affordable housing markets, and less intensely urban lifestyles. During the 2010s, Biden areas enjoyed a decade cashing in on powerful forces of agglomeration, which concentrated high-value economic activity in very populous areas. Technological change, remote work, and household preferences now push in the other direction. As a result, Democrats' political heartland faces greater headwinds emerging from the pandemic than that of Republicans. Of course, the extremely dense base of human capital in blue areas endows them with considerable resilience, too, and belatedly urban cores may be reheating. Purple areas, for their part, have some of the highest in-migration rates in the country–hubs of economic growth and opportunity that Americans continue to seek out.
Stepping back, it seems that the pandemic has been a force for convergence across the U.S. economy: modestly lifting up many formerly-struggling and right-leaning areas while weighing down formerly-dominant and left-leaning ones. However, the country's politics remain as polarized as ever. Voters still view the economy through a partisan lens, and Republican voters show no signs of crediting President Biden for the success of their state and local economies–readier to fault him for high inflation, instead. Shifting economic sands look unlikely to lead to shifting political ones for the time being.