
By Jiaxin He and Adam Ozimek
Do H-1B visa holders earn more or less than Americans? There are two different ways to answer this. If we compare H-1B holders to the average native-born worker, the answer is unequivocal that the visa holder is paid more. Median H-1B pay in 2024 was $120,000 per USCIS, compared to $67,000 for the average native-born worker.[1]
However, when we compare H-1B holders to otherwise similar native-born workers, the question becomes more complex. Answering it correctly requires careful examination. Unfortunately, a recent attempt at answering this question from Harvard economist George Borjas contains major errors.[2]
In this analysis, we correct those errors and present a clearer picture. The answer to whether H-1Bs are underpaid depends on which workers we examine. Older H-1B workers earn less than otherwise similar native-born workers, while younger H-1B workers earn more. Overall, there is a small average wage gap, but it is only one-third as large as the flawed analysis claimed.
The paper not only reached flawed conclusions but also influenced the Trump administration’s $100,000 H-1B fee policy. Borjas, serving as a senior economist on the Council of Economic Advisors, advocated for an “optimal” fee based on “average employer wage savings” derived from this methodology. As we will argue, this policy solution is deeply mistaken.
The H-1B fee is based on data errors
Borjas’s February 2026 working paper attempted to answer whether H-1B workers earn less than comparable native-born workers by combining data on actual H-1B earnings with American Community Survey data on native workers. The conclusions are negative, with H-1B holders earning 16 percent less. But these findings result from substantial data errors.
In our replication of Borjas’s analysis, we identified several.[3] The most significant mistake is a crucial temporal mismatch between his H-1B and native-born samples: the H-1B applications span 2020-2023, while the ACS data covers just 2023.[4]
Nowhere did the paper mention controlling for inflation or wage growth. Given 15.1 percent inflation[5] and an 18.7 percent wage increase for software occupations alone[6] from 2020 to 2023, comparing wages of H-1B workers from 2020 to 2023 to a native-born wages from 2023 only produces negatively biased results that overstates the wage gap.
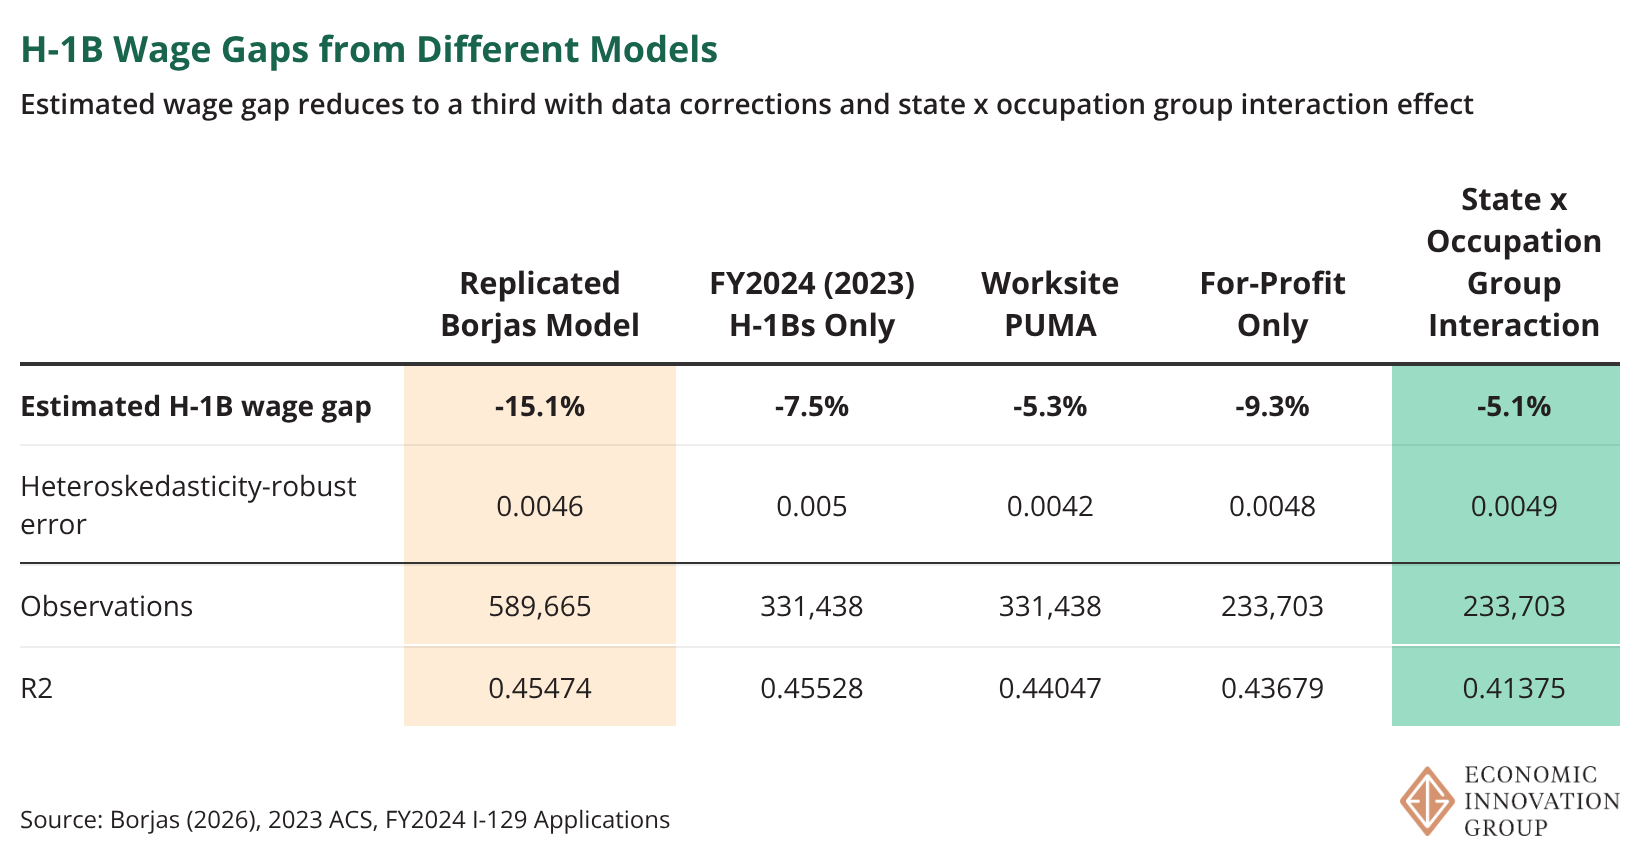
A simple approach is to directly compare the 2023 H-1B observations (FY 2024) to 2023 ACS data. Alternatively, we can use all years but adjust for inflation and convert all years to real 2023 dollars. Both approaches cut the wage gap roughly in half. We prefer direct comparison using only 2023 data, which also accounts for real wage growth beyond inflation.
The second error stems from controlling for geographic wage drivers using each worker’s PUMA (public use microdata area). PUMAs are Census Bureau geographic units corresponding to at least 100,000 people that do not cross state lines. The problem is that Dr. Borjas uses the PUMA where visa holders work alongside the PUMA where native workers live. Consider a native-born software developer working at Google in Mountain View who resides in a cheaper area like Fremont. If residential areas have lower average wages than business districts, this mismatch systematically inflates the apparent native wage and negatively biases the H-1B wage gap.
While Borjas notes this discrepancy in a footnote, he incorrectly claims the choice is necessary. The ACS already offers place-of-work PUMAs (POWPUMAs) for its respondents. Although POWPUMAs are larger and often contain multiple residential PUMAs, they more accurately reflect employment patterns than smaller residential units and allow apples-to-apples comparisons between H-1B holders and natives.
Using worksite state-POWPUMA combinations as geographic fixed effects, combined with restricting the sample to only 2023 data, further reduces the H-1B wage gap to just 5.3 percent — about a third of what Borjas found, without altering model specifications.
The much smaller wage gap obtained from data corrections alone casts doubt on Borjas’s other results. His robustness test to address tenure[7] by applying the regression to male workers under 30 now yields an insignificant coefficient close to zero. Because his calculation of the optimal H-1B fee is based on average employer wage savings derived from his flawed wage gap estimation, our findings call the administration’s $100,000 fee into question.
A final data error is that Borjas filtered H-1B workers to for-profit private enterprises without applying the same criteria to native-born workers, causing him to overestimate the H-1B wage gap since native-born non-profit and government workers earn less.
The misuse of place
Another issue with the analysis is more conceptual. At EIG, we love place-based studies and policies. But different levels of geography require different types of analyses.
The Census Bureau delineates PUMAs based on roughly 100,000 inhabitants, but in urban areas, boundaries may contain just a handful of high-density neighborhoods. Controlling for PUMA does not just control for labor market wide differences in cost of living or agglomeration, it controls for a specific part of a labor market where someone works. This is especially problematic for Borjas’s use of geographies that correspond to a worker’s residence. If the most highly paid workers sort into more expensive areas within a city, this is not a difference you want to control for.
A PUMA simply does not correspond to a labor market. Unlike what Borjas’s PUMA-level fixed effects suggest, a typical San Francisco worker does not wake up and decide to seek employment only in the residential PUMA containing SoMa, Mission, and Potrero Hill. They compete against similarly specialized workers across all seven residential PUMAs making up the place-of-work PUMA of San Francisco County and throughout the wider Bay Area.
A more ideal level of geographic controls would be larger geographies like core-based statistical areas (CBSAs) that incorporate labor market patterns around urban centers. This would more accurately model a software engineer living in Fremont competing for jobs in Berkeley, San Francisco, and Oakland simultaneously across the wider San Francisco–Oakland–Fremont metropolitan area. Unfortunately, the ACS has poor CBSA coverage.
Since H-1B workers congregate in the largest metro areas of their states, state-level fixed effects serve as a better proxy.
An additional benefit of state-level controls is it enables us to account for occupational sorting due to establishment location decisions by adding an interaction term between geography and the 19 Census occupation categories to the fixed effects. This allows us to get even closer to an apples-to-apples comparison — comparing workers doing a similar job in the same state.
Our preferred model with education, age, state, occupation, and state-by-occupation controls, and correcting the data errors noted above, reduces the H-1B wage gap to 5.1 percent.
While this still represents a non-zero difference in pay, the overall effect obscures significant underlying patterns worth examining.
Younger H-1B lottery winners outearn their American peers
Controlling for age in wage analyses is important because we do not want estimated differences in wages to reflect one sample being relatively older or younger than the other. However, the estimated overall wage gap obscures an important and policy-relevant pattern in wage gaps across age groups.
We can see this pattern more clearly by including an age-by-H-1B status interaction in the model. This allows us to assess whether H-1B workers make more or less than natives of the same age. Younger H-1B workers make significantly more than natives while older H-1B workers make much less.
H-1B workers aged 22–23 fresh from college earn over 20 percent more than their native-born counterparts. Those finishing Optional Practical Training (OPT) or graduate degrees in their mid 20s to early 30s still earn more, and the negative wage gap only emerges around age 34. While 21-to-33-year-olds represent a minority of the overall labor force, H-1B holders skew younger due to program design: over two-thirds of lottery winners from FY2020 to FY2024 were 33 or younger. Nearly 70 percent of these young H-1B workers transitioned from an F-1 visa, including a substantial share of OPT participants. In contrast, only 10 percent of H-1Bs above age 33 had previously held student visas.
Two-thirds of H-1B workers are skilled young professionals, often with American education, whose companies pay premium wages exceeding those of comparable native-born workers. Their wage advantage, however, gets offset by the one-third of older H-1B workers who are more likely to arrive from abroad and work for large IT outsourcers at lower wages than native-born Americans.
Policy design lessons
While Dr. Borjas’s research contains data errors and conceptual issues, the policy implications present the most serious concerns. He argues that the existence of underpaid H-1Bs suggests tax revenue could be maximized via a fee of $100,000 or more.
This solution works only for employers underpaying their foreign workers. The logic is peculiar: identify a worrisome level of underpayment, then propose a policy that maximizes revenue from this practice rather than correcting it. Moreover, as we have demonstrated, the most underpaid workers are older visa holders, while the youngest earn a wage premium compared to native-born workers. The policy derived from Borjas’s analysis will penalize young workers and firms that pay them more, tilting the H-1B program toward employers hiring the oldest workers.
This is the exact opposite approach we would take if we wanted to preference workers more likely to be innovative and generate the largest economic spillovers. Even from a strictly fiscal standpoint, research from Daniel Di Martino shows that the long-run fiscal impact of workers is highest for the youngest skilled workers. For immigrants with a bachelor’s degree, the 30-year fiscal impact of a 30-year-old is $1.6 million. The impact for a 40-year-old is $918,883, and for a fifty year old it is negative $91,517.
Dr. Borjas’s policy would benefit firms who are underpaying older workers with worse long-run fiscal impacts. It is a bad conclusion from a paper with a variety of serious errors. Reforming the H-1B program is essential. But utilizing an age-and-cost-of-living adjusted wage ranking as proposed by EIG here would result in a more positive economic impact for the U.S. economy and its workers.
View the Github with code for replicating this analysis here.
Update 2/23/2026
EIG Chief Economist Adam Ozimek has issued this addendum following a conversation with George Borjas:
Professor Borjas tells us that he does inflation adjust. Borjas’s Table 1 indeed indicates all figures are in 2023 dollars, but the actual mean H-1B salary adjusted to 2023 dollars using PCE is $109,600 when accounting for the fact that FY2021-2024 petitions were filed in 2020-2023 and reflect wages from those earlier years. This is 8.4 percent higher than what his Table 1 reports. In addition, when we nominally adjust the data this way, the coefficient is half of what he reports.
As such, we are unable to replicate the nominal adjustment. It is possible that he has misunderstood the discrepancy between fiscal year and actual year and mistakenly aligned FY2021-2024 with calendar years 2021-2024 rather than 2020-2023. In that case, the adjusted mean wage in 2023 dollars would be $105,200 and the coefficient would be -0.12, again both inconsistent with his reported results. Regardless, the correct way to address growth in inflation and real wages is to match ACS year to H-1B year as we have done below.
Notes
- Source: 2024 Current Population Survey Annual Social and Economic Supplements microdata.[↩]
- “The H-1B Wage Gap, Visa Fees, and Employer Demand” https://www.nber.org/papers/w34793[↩]
- Without direct access to Dr. Borjas’s code and data, we reconstructed his model from descriptions in the paper and successfully replicated his results. Our sample shows the same summary statistics, and we obtained a coefficient of -0.15 from an identical fixed-effect log wage regression, which is sufficiently close to his results. This indicates an H-1B holder on average earns 15 percent less than a comparable native-born worker with the same age, gender, education, occupation, and location. According to Borjas, the H-1B sample includes FY2021-2024 I-129 petitions obtained by Bloomberg via a Freedom of Information Act request and linked with FY2017-2024 Labor Condition Applications (LCAs) for new H-1B employment. Only lottery winners with approved H-1Bs are included. The native-born sample is drawn from the 2023 1-year American Community Survey (ACS). Both samples are limited to full-time, salaried, college-educated workers aged 21 to 50, with the H-1Bs further restricted to workers at for-profit firms. Those making under $30,000 annually are excluded from both samples, and H-1B workers making more than $1.22 million (top 0.05 percent) are also excluded. ACS wages are top-coded, eliminating the need for a ceiling.[↩]
- In the data, H-1B observations are labeled according to the fiscal year. However, 2024 data really represent 2023 observations. Per USCIS, cap-subject I-129 petitions for a given fiscal year are filed in March of the preceding calendar year when the H-1B lottery opens. Those visa holders then are able to begin working in October of that year. For example, FY2024 applications were filed in March 2023 with wages at that moment in time. Those wages are then paid beginning October, 2023. FY2021-2024 applications thus contain nominal wages from 2020 to 2023.[↩]
- Bureau of Economic Analysis, accessed through FRED.[↩]
- Software and Web Developers, Programmers, and Testers (SOC 12-1250) includes the most common occupations within the H-1B sample, accounting for 42.5 percent of workers. Wage data is obtained from Occupational Employment and Wage Statistics.[↩]
- H-1Bs in the I-129 data are new hires who tend to earn less than long-tenured workers[↩]