
by Eric Carlson, Kenan Fikri, and Connor O’Brien[1]
Introduction
As the first phase of the Tech Hubs program, the Economic Development Administration (EDA) announced the designation of 31 regional technology hubs. Designation confers prestige and signaling power, but most concretely it grants access to a second round of competition for five to 10 implementation grants of between $40 to $75 million each from a total pot of nearly $500 million. These Tech Hubs semi-finalists span 32 states and Puerto Rico, encompassing a mix of urban and rural regions but largely skewing towards places where existing technological capabilities are quite strong.
Shortly after the passage of the CHIPS and Science Act, the Economic Innovation Group (EIG) developed a “Hubs Index” to identify metro areas that would be strong contenders for Hub designation given the mandates of the program—namely, to push the frontiers of technology while forging a more diverse geography of American innovation. At the time, we were worried that EDA would feel pressured to designate Hubs in areas too distressed for limited grants to fundamentally change their economic trajectories. The Index is a data-driven way to highlight places that could optimize the competing interests of the program and maximize the results.
Examining the newly designated Hubs through the lens of EIG’s Index suggests awardees were more tilted towards places with relatively strong innovation ecosystems than we anticipated. This introduces a different set of risks into the next round of the competition, specifically that scarce awards will end up flowing to places where their impact will be marginal rather than transformative. Of course, the Tech Hubs program is a competition, meaning that program administrators are entirely dependent on the quality of applications in front of them. But if a prestigious national competition such as this struggles to source compelling visions from second and third-tier innovation hubs for the next round of awards, it will end up casting a disappointing verdict on the capacity of American regions.
What is the EIG Hubs Index?
The Hubs Index was designed to identify regions across the country poised for a blend of innovation and rejuvenation given the right set of investments. The Index internalized the dual mandate of the program and, drawing from a range of data sources, scored regions based on their latent technological potential and their need for local investment. This balance was intended to identify where federal dollars could have a significant impact on both local communities and national economic growth.
The exercise was strictly quantitative, focused on the higher-level building blocks of innovative clusters that could make economic take-off more likely. Who ultimately emerges successful from a competitive grant program such as this depends on a combination of these regional factors and the quality of specific applications, which cannot be gleaned from descriptive statistics. EDA, the awarding agency, ultimately filtered applications for strengths in key technology areas and scored them on elements including the vibrancy of the local innovation ecosystem, alignment of key economic actors, and commitment to equitable outcomes. Nevertheless, a comparison between EDA’s selections and the top scorers on the Hubs Index can tell us a good deal about the nature of the places selected, how EDA balanced the competing priorities of the program, and what policymakers need to focus on next to ensure the policy succeeds.
Figure 1. Map of EDA-Designated Tech Hubs
Note: The map shows metropolitan statistical areas and includes any micro areas that are part of a hub. Counties that are part of a hub but are not part of metro or micro areas are not included in the figure.
In total, eight metro areas from our shortlist were included among the designated Tech Hubs. Both Madison, WI, and Greenville, SC, were top scorers on the Hubs Index and received designation from EDA, for example.[2] Of EIG’s 100 overall highest-scoring metro areas, 20 were selected as regional Hubs. Importantly, the Hubs Index scored each metro area independently, while several ultimate designees were multi-metro consortia or regions. As a result, the 31 designated Tech Hubs actually encompass 50 different metropolitan areas. That fact, combined with our strict one-metro-per-state filter, explains some of the foundational differences between the two lists.
Note: This table only shows metro areas that are included in a consortium. Micro areas and counties that are not part of Core Based Statistical Areas are not included. In addition, the Critical Minerals and Materials for Advanced Energy is based in the Rolla, MO, micropolitan area but is attributed to nearby St. Louis for our analysis.
Most fundamentally, our Hubs Index was a largely theoretical exercise while the official selection process was a practical one based on the specific details of each application. The Hubs Index combined publicly available data with a theory of geographic optimality that explicitly paired a metro’s potential to produce innovative and commercializable products with its need for investment. In contrast, the competitive designation process was conducted entirely off of information that was ex ante unobservable. This includes information about specific regional partnerships, the role of the private sector, specific lab-to-market approaches, and the proposed impact on U.S. national security. Ultimately, a weak application from a theoretically optimal metro would lose to a strong application from a metro that scored lower on our index.
Unobservables at work
Winning applications were often backed by entities with long institutional track records and included clear visions of how stakeholders would be engaged to drive economic change. For example, in Ohio, an application from a very young Toledo glass consortium lost, while an application from a more established polymer Hub in Akron won. Toledo ranked 6th out of 384 metros on EIG’s Hubs Index overall, and Akron ranked 7th–a functional tie.
The difference came down to the specifics of each application. Reflecting on Toledo being bypassed, Mayor Wade Kapszukiewicz, noted that, at just over a year old, the Toledo glass consortium was younger than Akron’s consortium by over a decade. Local innovation officers fretted that Toledo did not have “a long-term voice coming from the region” and may not have been able to make as strong a case as older consortia. In contrast, the Sustainable Polymers Tech Hub in Akron will build on roughly 15 years of experience. The application lays out a clear explanation for how the consortium will engage the private sector and how they plan to manage their regional partnerships to boost productivity.
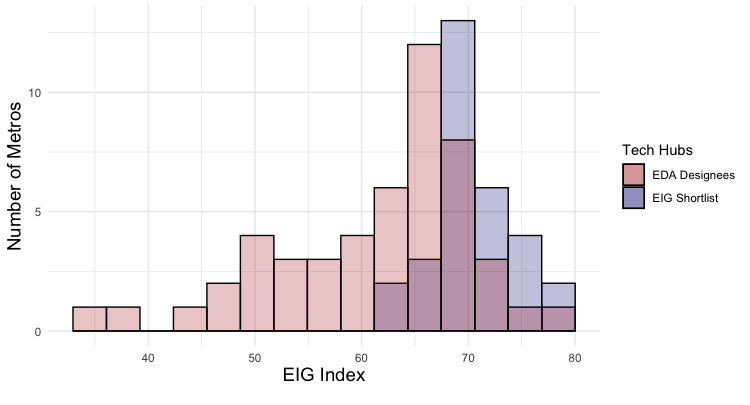
By construction, EIG’s candidates spanned a smaller range of Index values relative to the EDA designees. EIG’s shortlisted hubs clustered around a median index value of 69.8 (on a scale from 0 to 100), with a range of 13.8. On the other hand, designees had a slightly lower median of 64.4 but a much larger range of 43.9. In part this is due to the multi-metro nature of several Tech Hubs consortia, which combined high- and low-scoring areas behind a single application. For example, the “Loop” lithium battery tech hub in Nevada combines high-scoring Reno with low-scoring Carson City. Similarly, the New Energy New York Battery Tech Hub consists of multiple metro areas across Upstate New York from high-scoring Albany to lower-scoring Elmira.
The differences in the distribution of overall Hubs Index scores between EDA designees and EIG’s shortlisted hubs candidates are shown in Figure 2 below. The horizontal axis shows the index score on a scale from 0 to 100, and the vertical axis shows the number of metro areas that fall within each bin. The distribution of scores for EDA designees is shown in light red while the distribution of scores for EIG’s candidates is shown in light blue. The darker sections of each bar show where the distributions overlap.
Figure 2. EDA Tech Hubs Spanned a Wider Range of Index Scores than EIG Tech Hubs Candidates
Designated Hubs skew towards high-potential areas
Overall Index scores can be split into two components: a “potential” score based on four equally-weighted measures of underlying technological capacity, and a “need” score based on five equally-weighted measures of economic underperformance.[3] Figure 3 plots each metro area’s potential component on the horizontal axis and need component on the vertical axis. Top Hubs Index scorers are tightly clustered at the top right of the distribution–a product of the underlying optimization function.
Figure 3. Compared to EIG, EDA Generally Selected Hubs with Higher Potential and Lower Need
Designated Hubs include several interior points but concentrate in the lower right-hand portion of the graphic—areas with high potential scores but lower need ones. For example, Chicago and Philadelphia are now designated Tech Hubs that scored low on measures of need but high on measures of potential.
Examined through this lens, Tech Hubs designations look more like they were extended to build on excellence than to help lagging regions catch up. Indeed, this is in line with the administration’s recent commentary around the Tech Hubs program, which characterizes it as a key pillar of the wider mission to secure national economic competitiveness at the heart of the CHIPS and Science Act. For those who believe, as these authors do, that national competitiveness is forged through strong regions, this commitment to building on strengths is welcome. It is also in line with the emerging division of labor between Tech Hubs and the Recompetes Pilot Program—the other flagship place-based policy of the CHIPS and Science Act—which is more specifically targeted to lagging regions. As we’ll discuss below, however, it also comes with risks that program administrators will have to manage downstream.
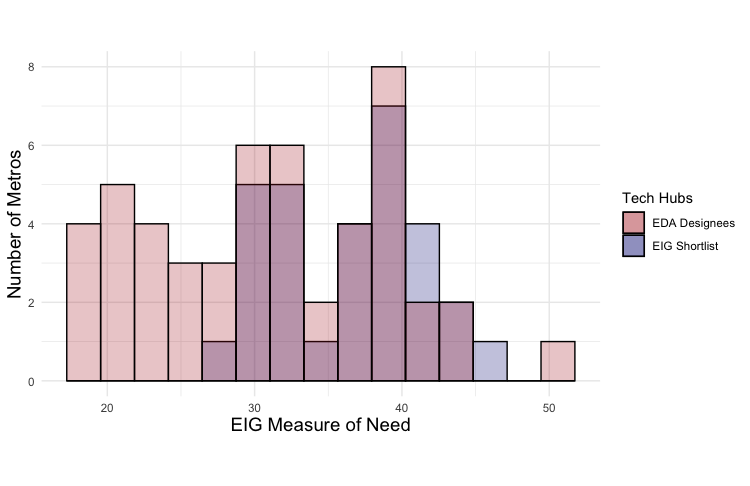
Figure 4. EDA Tech Hubs Spanned a Wide Range of “Potential” Scores and Lower “Need” Scores than EIG Tech Hubs
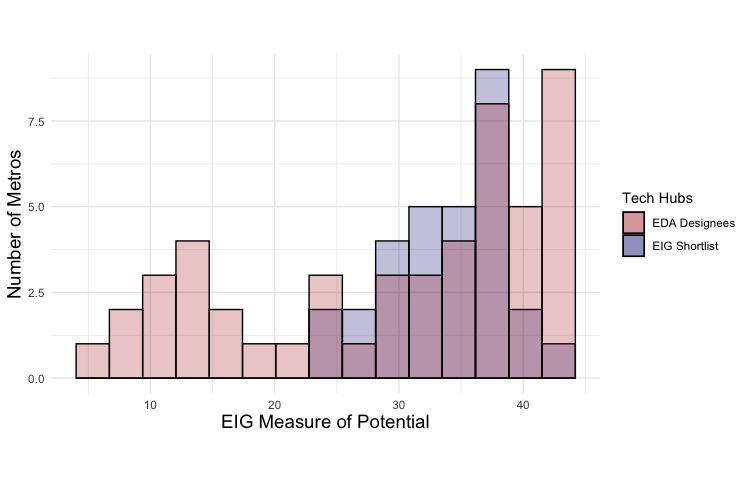
Importantly, the portfolio of designated Hubs does balance a high-potential mode with a long-tail of lower-potential areas, many of which piggybacked on the strengths of larger partner metros on the same application. For example, St. Joseph, MO-KS, scored low on our measures of potential but was designated as part of the Inclusive Biologics and Biomanufacturing Tech Hub centered around Kansas City. The broad geographical footprint of this hub provides just one example of how smaller metros and rural areas were pulled into final designations, as called for by Congress.
Low levels of need amplify risk factors down the road
EDA’s selections not only favored metros with high potential but also included several with very low need scores (see Figure 4b). Places that scored low on need indicators generally have tight labor markets, high cost bases, good proximity to major agglomerations, and low rates of brain drain. Designated metro areas such as Denver, CO, and Missoula, MT, already face severe housing cost crises. Philadelphia, PA, and Chicago, IL, already host two of the largest R&D ecosystems in the country (ranking ninth and tenth for total business R&D spending, respectively). Dallas-Fort Worth, TX, is home to 23 Fortune 500 companies.
In the end, four of the country’s 10 most populous metro areas grabbed one of these coveted designations intended to widen the geography of American innovation beyond the usual suspects.
Down the road, successful Tech Hubs in these locations risk running against binding constraints on their growth, including inelastic housing markets or already-tight labor supply. If they were to win implementation awards in the second round, their elevated cost bases could erode the marginal value of each federal dollar invested into the ecosystem. The immense size of some of the designated local economies poses the risk that additional federal investment makes too small of a ripple–drops in the bucket that could have made bigger splashes somewhere else.
By the same token, the payoff of turbo-charging an underperforming powerhouse such as Philadelphia could be huge given the latent potential in such a place. In particular, the application from the Philadelphia Tech Hub notes that they have already received a great deal of funding from other sources, including $1 billion in NIH funding and $1 billion in venture capital in the relevant industries. While a Hubs award would only represent a small share of innovation-related funding flowing to the region, it could be a valuable force multiplier if it were spent filling in the right space between other sources.
Conceptual parallels between the index and the cases made by applicants
One of the four indicators of “need” in the Hubs Index was a measure of brain drain: the ratio of the flow of new college graduates to the existing stock of bachelor’s degree (or higher) holders in a metro area. Areas where the flow of new graduates is high relative to the base of degree holders in the workforce contend with a gap between the amount of human capital they produce and the amount they actually deploy.
The concept of brain drain appeared as both a motivating concern and an actionable opportunity for several consortia. For example, the Ocean Tech Hub application highlighted the flow of college graduates with specialized degrees from Southeastern New England institutions and argued that a Tech Hub in their region would be able to productively engage many of these graduating students. Similarly, the South Carolina Nexus for Advanced Resilient Energy Tech Hub cited concerns about the large number of “higher ed graduates seeking employment outside the SC Nexus region and state” as motivation behind their proposal. In both cases, brain drain signaled an underutilization of local assets that Hubs designation–and the initiatives that won it–could rectify.
Low need scores help elucidate the risk factors that administrators must weigh in later stages of the competition when the federal government is not wagering titles but real dollars. Namely, those risks are that already-hot economies overheat or that the scale of support on offer from EDA is simply too small to move the needle in a massive local economy. Administrators will need to make the case that $75 million (the maximum Hub award size) invested in Chicago or Dallas can unlock more of a delta than $75 million in places like Madison, Birmingham, Akron, or Syracuse.
Another consideration: the impact of awards to already-large innovation ecosystems may be hard to empirically detect, reducing the value of this policy experiment to future federal place-based development efforts.
If the portfolio of designees skewed lower-potential, higher need, another set of risks would be at play: that the ecosystems may simply have been too far from the technological frontier to deliver on the program’s lofty goals for both winning regions and the country, for example. As it stands, however, the risks of playing it too safe—and through that, undercutting the policy’s own catalytic potential—look more acute.
Future Considerations
At the end of the day, Tech Hub designation confers two core benefits: prestige and access to compete in the next round of funding. EDA could extend Hub designation more liberally than it will be able to make awards.
As EDA further narrows its list of 31 designated hubs to a smaller list of those who will ultimately receive up to $75 million in Implementation awards, it should double down on its role as that of a catalyst. The final selection process for funding should carefully identify regions and teams for which federal funding is most likely to spark outsized economic growth and additional innovation activity at the leading edge of strategic industries. In places with existing, well-developed, and well-coordinated ecosystems, additional funding may yield only modest growth. Conversely, in hubs with insufficient capacity to see ambitious R&D initiatives through to scaled-up commercialization, additional funding alone is unlikely to change the region’s economic trajectory. Identifying the sweet spot in between–of emergent hubs on the cusp of something transformational–is what administrators should aim to unlock in the next round.
Designation is much more a vote of confidence than it is a set of laurels on which to rest; however, it can also be a powerful catalyst to help activate regional networks to coordinate their energies and activities towards the shared goal of making new Hubs successful. Whether the new program succeeds at cultivating the sort of world-beating innovation ecosystems it set out to–with the express goal of Hubs being globally competitive in their key technology areas in 10 years–depends largely on what happens next both in Washington and in the states and regions that won the first round of the competition.
What comes next
There is no shortage of steps that state, local, and federal officials can take to position the country’s new Tech Hubs for success.
At the state level, policymakers need to dedicate themselves to rekindling economic dynamism and fostering innovative entrepreneurial ecosystems. For example, imagine the impact that signing the ban on non-compete agreements currently sitting on Governor Hochul’s desk would have on the two Hubs designated in hard-up Upstate New York—the Battery Tech Hub centered around Binghamton and the semiconductor-focused Hub centered around Syracuse, where Micron recently announced a massive new investment.
Non-competes have been shown to slow the rate of innovation, hem-in productivity growth, and stymie startups from inception onward. Freeing workers to follow the best ideas and start-up or spin-out the enterprises that are the essence of dynamic industry clusters would be one of the single strongest signals the state could send that it’s committed to using this unprecedented federal investment to reactivate its storied but seriously flagging innovation engines upstate.
At the local level, new clusters will face at least two types of challenges that designation or federal grants will not address: permitting and cost of living. New technologies emerging from Hub-assisted research may encounter permitting barriers when translating to commercial applications. These barriers will be unique to each region. Local officials should pay close attention to the ways in which scaling up commercial activity in emerging technologies may interact with land-use, environmental review, or permitting rules. Along similar lines, successful incubation of a Hub may exacerbate cost-of-living concerns if local governments do not allow housing supply to grow sufficiently along with demand. Both of these areas underscore the fact that even after a region assembles a productive team of researchers, the task of ultimately scaling up commercial technologies that emerge from Hubs can be constricted by policies which most do not think of as innovation policy.
At the federal level, the task is much the same: create the conditions that allow innovation to flourish. Immigration policy is one tool to do just that. Greater access to skilled immigration–in addition to Hub activities promoting the domestic workforce–will boost Hubs’ odds of growing into booming, innovative clusters of entrepreneurship. Tailored immigration pathways like the Chipmaker’s Visa or tweaks to the H-1B program to allow Hub-affiliated firms to sponsor more employees for this visa without being subject to the private sector annual cap could provide key talent in Hubs’ critical early days.
Tech Hub designation should provide an impetus for all layers of government to think through how they can use this moment to align programming, regulation, and all the tools at their disposal behind their new status in order to make the most of the opportunity at hand. With only five percent of Hubs’ envisioned appropriation actually authorized–and spending fatigue setting in rapidly–these 31 Tech Hubs and their stakeholders have a singular chance to demonstrate how when done right, regional innovation policy can meaningfully grow the national economy. The map may now be set, but the real work is just beginning.
Notes
- The authors would like to thank Cassie Nestor for her research assistance.[↩]
- In our comparison, whenever a designated tech hub included multiple metro areas, each metro area in our data set was labeled as an EDA designee. For example, the Nevada Lithium Batteries and Other EV Material Loop included both Carson City and Reno. Since the Hubs Index methodology selected Reno but not Carson City, this is counted as an agreement between EIG and EDA.[↩]
- The four “potential” measures are the number of college graduates with STEM degrees, the number of patent authors, total employment in advanced industries, and a measure of economic complexity. The five “need” measures are the ratio of graduating college students to the population of college graduates over the age of 25, the ratio of graduating college students with STEM degrees to the population of college graduates with STEM degrees over the age of 25, a measure of local prices, the share of prime age workers out of work, and a measure of distance from employment agglomerations.[↩]