
by Eric Carlson, Adam Ozimek, and Kenan Fikri
EIG developed a novel Innovation Hubs Index that balances economic need with innovation potential to inform the selection of 20 regional Innovation Hubs authorized in the CHIPS and Science Act. Top metropolitan area contenders on the index include Greenville, SC; Provo, UT; Tucson, AZ; Toledo, OH; and Greensboro, NC.
The CHIPS and Science Act authorized $10 billion in federal funds over five years to invest in 20 geographically distributed regional "Innovation Hubs" across the United States. This provision of the statute has two broad goals: first, it is meant to increase U.S. output of translational research–research that converts basic scientific findings into industrial applications; and second, the legislation serves as a regional development policy intended to seed innovation ecosystems in lagging regions. [1] In speeches on the Senate floor on July 27, 2022, Senate Majority Leader Chuck Schumer (D-NY) and Senator Todd Young (R-IN) described their motivations for the bill. Speaking on increasing research output, Senator Young said that the "…bill will establish regional technology hubs across our country, which will become centers for the research, development, entrepreneurship, and manufacturing of new key technologies." Focusing on regional development, Senator Schumer added that the "…bill will help turn cities like Buffalo and Indianapolis into new centers for innovation…" While the legislation has provided broad eligibility criteria, it has not given specific guidance for selecting the location of hubs. [2] The Economic Development Administration (EDA) within the Department of Commerce is charged with implementing the program–which Congress still needs to fund–and is in the process of drawing up the terms and timelines on which regions will compete for Hubs status and funding.
EIG developed the Hubs Index as a provisional, data-driven guide to the selection of hub locations that balances the program's dual–and sometimes competing–intentions. We determined our criteria based on the broad goals of the statute and selected specific measures to reflect those objectives. First, consistent with the policy's goals of promoting translational research, hubs should be located in metros that have the potential to invent new technologies and put those new technologies into practice. This includes, for example, regions with a great deal of human capital and regions with innovative and complex industrial bases. Second, consistent with the policy's goal of bringing new regions to the technological frontier, hubs should be located in lagging regions or in areas that are otherwise undershooting their economic potential. This includes, for example, regions far from so-called superstar cities, regions with low prime-age employment rates, and regions experiencing brain drain. In short, we consider both innovation potential and economic need in determining whether a given location merits selection.
Given the logic of regional economic agglomeration and clustering on which the hubs concept rests, the unit of analysis is the metropolitan statistical area (MSA). [3] Every state contains at least one metro area [4], and these geographies represent functional economic areas spanning the urban-rural continuum that generally conform to local labor markets. With populations that can run under 70,000 people, some metros, such as Walla Walla, WA, represent areas that are commonly considered rural. We collect data on each variable, normalize the measures to a scale from 0 to 100, and aggregate our variables using a weighted average of each measure.
Our baseline model applies equal weights to each variable. Our normalization combined with the equal weighting scheme prevents any one indicator from driving the value of the index. There is a great deal of variation in the baseline index with the top metro areas scoring 77.4 out of a possible 100 (Greenville-Anderson, SC, and Provo-Orem, UT) and the bottom metro area scoring only 23 (Ocean City, NJ). Given the range of criteria we examine, the top metros based on our methodology include a mix ranging from college towns to former industrial centers. For example, top hubs contenders include Provo-Orem, UT; Tucson, AZ; Greenville-Anderson, SC; Toledo, OH; and Greensboro-High Point, NC.
Methodology
EIG collected data on indicators reflecting a metro area's potential to generate and commercialize innovative technologies as well as its need for economic investment. A metro area's potential for innovation is assessed through its stock of human capital and through its industrial composition. A metro area's need for investment is measured based on its relative inability to retain a skilled labor force, the share of the prime-age population that is not working, and its distance from other superstar metros. These measures of need also reflect opportunities. For example, hubs in metro areas suffering from brain drain–in this context, generally college towns without the economic base to absorb and retain their graduates–would have ready access to a young, skilled workforce coming out of local universities. In addition, a hub located in a place with high rates of prime-age nonemployment would take root against the backdrop of considerable labor market slack, which could insure against any local economic overheating, and would also carry the prospective benefits of bringing workers back off the sidelines and into the productive economy.
Alone, measures of innovative potential skew towards the already high-performing superstar metropolitan areas that are decidedly not the intended recipients of these federal investments. Similarly, measures of economic need skew towards remote and chronically struggling locales where hubs would have to be built largely from scratch. Thus, the utility of EIG's Hubs Index lies in identifying metro areas that occupy the sweet spot between these two extremes–high performance and economic need–balancing the tensions at the heart of the program's mission.
Measures of potential
Human capital is a key ingredient for innovation. We measure a region's human capital using the number of STEM graduates between the ages of 25 and 64 as well as the number of patent authors. The number of STEM graduates come from the 2019 5-year American Community Survey (ACS) summary tables and the number of patent authors comes from patentsview.org. The number of authors measures patenting activity at the extensive margin–the number of workers who have produced a successful patent–rather than the intensive margin–the total number of patents produced. [5] Authors are assigned to metro areas based on the geographic information available on their latest patent. Innovation hubs located in regions that score high on this metric are likely to have access to a labor force of workers who know how to turn ideas into products as well as people who know how to navigate the American intellectual property space. We use total values rather than population shares because innovation rests on having a critical mass of certain inputs, especially human capital. The top metros based on the number of STEM graduates include New York, NY; Los Angeles, CA; and Washington, DC. [6] The top metros based on the number of patent authors include San Jose, CA; San Francisco, CA; Seattle, WA; New York, NY; and Boston, MA.
In order to deploy new technologies productively, hubs should be located in metros with sophisticated industrial bases. We proxy this by using the industrial composition of each metro area, as well as an index of each metro's economic complexity. We measure industrial composition using total employment in Advanced Industries within a metro where Advanced Industries are defined as in Muro et al. (2015), the predecessor work to Atkinson, Muro, and Whiton (2019), which incubated the very concept of these Innovation Hubs. Economic complexity is measured using the index developed in Fritz and Manduca (2021). Top metros based on these measures are superstar cities such as New York, Chicago, Boston, and Seattle.
Measures of need
In their role as a pillar of federal place-based policy efforts, innovation hubs should build on regional assets and help regions retain their human capital. Hubs should therefore gravitate towards metros that produce skilled workers but lose them to more dynamic areas. We identify regions that suffer from brain drain by comparing the flow of skilled graduates generated in a location to the stock of skilled workers active in the local economy. Flows of skilled graduates are based on 2019 college graduation data from the Integrated Postsecondary Education Data System (IPEDS), and stocks of skilled workers are based on the number of adults between the ages of 25 and 64 with at least a Bachelor's degree from the ACS. First, we measure the ratio of all recent college graduates to the total number of college-degree holders. Then, we repeat the same flow-to-stock ratio but for graduates and workers with degrees in STEM fields. Unsurprisingly, top metros by these measures are in less populous college towns like State College, PA (Penn State), and Blacksburg, VA (Virginia Tech). These areas produce very large crops of college-educated and STEM talent relative to the sizes and structures of their local economies. Hubs in metros experiencing such brain drain will therefore have easier access to a pool of young, skilled workers and enjoy tremendous opportunities to capitalize on assets already present in the region and build out their local economies.
In addition, hubs are intended to bring new employment opportunities to lagging local labor markets. We measure this by the share of the prime-age population (those between the ages of 25 and 54) that is either unemployed or not in the labor force. Employment data are from the 2019 ACS 5-year summary tables. Top metros based on this measure include Pine Bluff, AR; El Centro, CA; Hanford-Corcoran, CA; Beckley, WV; and Vineland-Bridgeton, NJ. Metros in which large shares of the prime age population are not working have available labor but clearly undershoot their economic potential. Hubs located in these communities could therefore help redeploy sidelined workers into productive employment opportunities, and hubs employers could hire large numbers of workers without crowding out local labor markets.
Finally, hubs should be located in parts of the country that are not already connected to superstar cities. Our index rewards metro areas that are not in close proximity to dense agglomerations and have lower costs of living, the latter of which serves as a proxy for congestion costs and an indicator of how far each federal dollar invested into a Hub may stretch. Our measure of agglomeration adjacency comes from 2019 Quarterly Census of Employment and Wages (QCEW) data on total employment by county from the Bureau of Labor Statistics. We use a non-linear distance-weighted average of nearby jobs based on the straight line distance between county centroids. Our measure of the cost of living is based on the regional price parity index from the Bureau of Economic Analysis (BEA). Metros that are farthest from superstars include Fairbanks, AK; Great Falls, MT; and Casper, WY. Top metros by regional price parity include Muscle Shoals, AL; Pine Bluff, AR; and Jackson, TN.
Constructing the index
Because the variables all come from different sources, are denominated in different units, and have different magnitudes, we first normalize each measure to take on values between 0 and 100. Although there are several ways to rescale our data, we normalize all variables except for weighted distance from superstar metros, using each metro area's percentile rank for that measure. Because the data are heavily right-skewed on most measures, the main consequence of this normalization is to flatten differences between two metros. That is, for a given variable, the difference between any two adjacent metros is 100/N where N is the number of metros in the sample.
We rescale the distance from superstar metros by dividing the measure by the maximum computed distance and multiplying by 100. This rescaling preserves the distributional features of this measure that were created by the non-linear distance weighting. In short, the distribution implies that being relatively close to agglomeration matters, but once you are a given distance from agglomeration, more distance does not matter. Going from 10 miles from a superstar city to 110 miles from one is a substantially bigger increase in geographic isolation than going from 400 miles to 500 miles.
To construct the index, we aggregate our data using a weighted average of each measure. In our baseline model, each variable is given equal weight and thus contributes equally to the index value. Since the law is ambiguous about how to balance innovative potential against economic need, we think that an even weighting method serves as a good baseline. As shown below, this method generates a diverse list of hubs candidates. However, because the choice of weights is subjective, we also conduct sensitivity analyses with different weights to demonstrate how the results are affected by these choices.
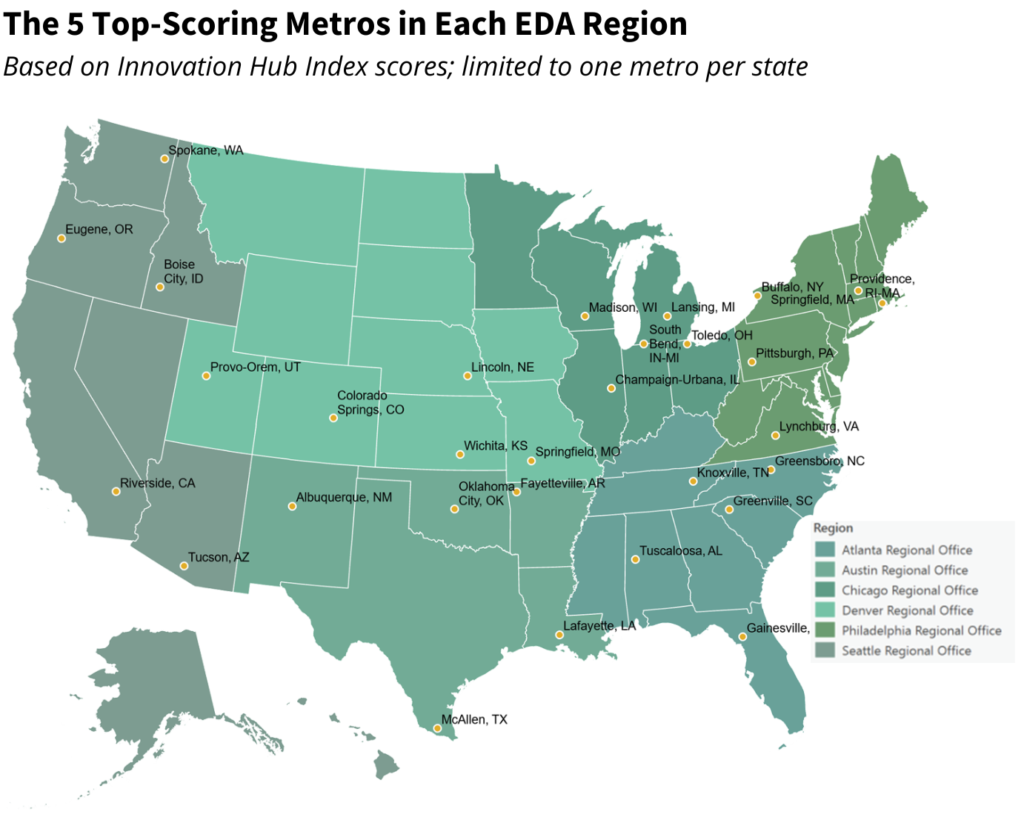
We use the index to rank metro areas within each state. In addition, the statute requires at least three hubs to be located in each EDA region. Therefore, our final list in the table below shows the top five state winners from each EDA region. The results are presented by state and region to showcase the geographic diversity of strong contenders and to reflect the reality that no one state is likely to get two hubs. (For an unfiltered ranking, see the appendix table or download the spreadsheet at the bottom of this post).
Results
As shown in the table below, the top metros by state and EDA region based on our index include a diverse mix of large and small cities. For example, Tuscaloosa, AL, and Lynchburg, VA, have populations under 300,000, while Riverside-San Bernardino-Ontario, CA, has a population near 5 million. Within each EDA region, metros are arranged in descending order by index value. Overall, the top 5 state winners are Provo-Orem UT; Tucson, AZ; Greenville-Anderson, SC; Toledo, OH; and Greensboro-High Point, NC. The table also includes notations for metro areas that host institutions specifically called out as priority partners in the authorizing legislation, including national laboratories, top-tier research universities, Manufacturing USA institutes [7], and Historically Black Colleges and Universities (HBCUs). In practice, the presence and involvement of such institutions may well tip the scales in the final designations.
Because the index weights each variable equally, the top metros were well-rounded across measures. For example, Tucson, AZ, and Provo-Orem, UT, scored in the top one-third for every measure except for regional price parity. Similarly, McAllen-Edinburg-Mission, TX, scored in the top one-third for every measure except for the number of patent authors.
The map of leading contenders from Table 1 is geographically diverse, as shown in the figure below. In the unfiltered ranking list, top-scoring metros within some states are adjacent to each other and functionally form cohesive economic regions that are already considered Combined Statistical Areas by the U.S. Census Bureau. Examples include Provo-Salt Lake, in Utah, and Greenville-Spartanburg, in South Carolina. In the real competition to be designated a Hub, such regions may be advantaged by submitting joint applications.
Additional Considerations
At the margins, the results are relatively robust to small changes in the weighting scheme. Because top-scoring metro areas are well-rounded across measures, eliminating the contribution of any single variable results in only minor changes in the ranking. For instance, removing the agglomeration penalty generates the same set of 30 top metros by state and region but in a slightly different order. Indeed, the top 2 metros from each EDA region remain unchanged. Any reordering is slight. For example, the adjacently-ranked metros Albuquerque, NM, and Baton Rouge, LA, change places.
More dramatic changes to the weighting scheme can change the results significantly. In the accompanying spreadsheet, interested users can manipulate the weights according to their own priorities or vision for how innovation hubs could be sited. At the extremes, if we just focus on innovative potential and remove brain drain, regional price parity, prime age non employment, and distance from superstars from our index, the top metro areas are all big cities: New York, Chicago, San Francisco, Boston, and Houston. If we instead focus solely on economic need and remove human capital and innovation variables, the top 5 metros are all small, economically distressed cities with relatively rudimentary local economies: Carbondale-Marion, IL; Cumberland, MD-WV; Terre-Haute, IN; Anniston-Oxford, AL; and Valdosta, GA.
The bill also requires that at least one Hub be in a low population state that is eligible to receive EPSCoR funding. [8] Using our baseline weighting methods, the top five metros in low population EPSCoR states are Burlington-South Burlington, VT; Fargo, ND; Missoula, MT; Grand Forks, ND; and Dover, DE. Compared to the other metros in this list, Burlington-South Burlington, VT, which has an index score of 61.1, has the most even mix of potential and need. For the other metros in low population EPSCoR states, need played a much larger role in their overall score. For example, the elements of need (brain drain and distance, primarily) constituted over 70 percent of the final index scores for Missoula, MT; Grand Forks, ND; and Dover, DE. The top 10 metros from low population EPSCoR states are shown in the table below.
Conclusion
The rankings presented in this report are intended to provide policymakers with an initial quantitative framework for considering how to balance competing public policy priorities in implementing a flagship new federal place-based policy, the Innovation Hubs authorized in the CHIPS and Science Act. The rankings provide a balanced assessment of regional economic need and innovation potential. Nevertheless, the data alone should not be decisive in determining which 20 U.S. regions become innovation hubs. Qualitative considerations such as the strength of local leadership, vibrancy of the local innovation ecosystem, and depth of the network of participating organizations will be just as determinative in the ultimate success of any given Hub as the quantitative exercise presented here. The competitive application process that EDA will run before making any awards should help further differentiate regions on these dimensions. Nevertheless, this index offers a good initial sense of where Innovation Hubs are likely to be both productive and helpful, advancing the public policy goals set out in the authorizing legislation. We hope it provides a useful tool for policymakers and stakeholders to navigate the intent of the statute to optimize the power of these coming federal investments. We look forward to feedback from the field and to iterating this model further.
.
Appendix
Data Sources
.
1. STEM graduates between the ages of 25 and 64
Measurement: Total number of people in metro area with bachelor's degree in STEM field
Source: Education data from American Community Survey table S1502 using 5-year estimates for 2019. STEM degrees defined as Science and Engineering fields and Science and Engineering Related fields.
2. Number of inventors
Measurement: Number of people with at least one patent. Authors assigned to metro areas based on geographic information provided in latest patent.
Source: Patents View
3. Advanced industry Employment
Measurement: Metro's total workforce employed in Advanced Industry
Source: Detailed employment data from 5-year ACS microdata for 2019. Industry classification from Muro et al. (2015)
4. Economic complexity
Measurement: Economic Complexity Index
Source: Data repository for Fritz and Manduca (2021)
5. Grad ratio (all majors)
Measurement: Total number of college graduates from bachelor's degree granting institutions in metro in 2019 divided by total number of workers between the ages of 25 and 64 with a bachelor's degree in metro in 2019
Source: Data on new college graduates from IPEDS and data on college graduates from ACS table S1502 using 5-year estimates for 2019
6. Grad ratio (STEM majors)
Measurement: Total number of college graduates with degree in STEM field from bachelor's degree granting institutions in metro in 2019 divided by total number of workers between the ages of 25 and 64 with a bachelor's degree in STEM field in metro in 2019
Source: Data on new college graduates from IPEDS and data on college graduates from ACS table S1502 using 5-year estimates for 2019
7. Regional price parity
Measurement: Percentage of overall price level for each metro
Source: Regional price parities table from BEA
8. Prime age not working
Measurement: Share of prime aged population who are either unemployment or out of the labor force
Source: Labor force status and population data from ACS table B23001 using 5-year estimates for 2019. Prime age population defined as people between 25 and 54 years of age.
9. Weighted jobs
Measurement: Employment weighted centroid distance from other metros
Source: Employment data from BLS QCEW and distance data from longitude and latitude information in shapefile
.
Notes
- According to the legislation, a Hub must "(1) have the potential to create an innovation ecosystem or enhance existing ecosystems and contribute to job creation in a region. (2) Demonstrate a capacity to engage and partner with multiple types of institutions of higher education, industry, labor, nonprofit organizations, civil society organizations, other Federal agencies, Federal laboratories, State, local, and Tribal governments, and other appropriate organizations, including to inform research directions and account for ethical, societal, safety, and security implications relevant to the potential applications of the research. (3) Demonstrate a capacity to broaden participation of populations historically underrepresented in STEM in the activities of the Regional Innovation Engine. And (4) demonstrate a plan and capability to prevent the inappropriate use or dissemination of the research and technology, including research results, data, and intellectual property, as appropriate and consistent with the requirements of the relevant award."[↩]
- To be eligible, a Hub must partner with one or more institutions that are either a historically black college or university, a tribal college or university, a minority-serving institution, an Established Program to Stimulate Competitive Research (EPSCoR) institution, an emerging research institution, or a community college. [↩]
- We have 381 MSAs instead of 384 because of missing data on the Economic Complexity Index from Dayton-Kettering, OH; Poughkeepsie-Newburgh-Middletown, NY; and Prescott Valley-Prescott, AZ[↩]
- From the Census Bureau: "Metropolitan statistical areas have at least one urbanized area of 50,000 or more population, plus adjacent territory that has a high degree of social and economic integration with the core as measured by commuting ties."[↩]
- Other potential measures of patenting include, for example, total patent counts, patents produced by specific industries, and patent counts from firms. Each of these alternatives have well-known problems. For example, successfully patenting an invention involves passing a minimum threshold as assessed by a patent office. Raw patent counts are therefore likely to overestimate the degree of innovation from a region. Patent counts by industry are hard to measure because individual patents can often apply to multiple industries so industrial assignment becomes unreliable. Patenting activity of firms is also hard to interpret because a firm's headquarters and it's R&D establishments may be in different metros, making the geographic information unreliable. Our variable captures the stock of workers who have both a proven ability to invent new technologies and proven knowledge of the patenting system while eliminating some of the issues biasing the alternative measures.[↩]
- We group Washington, DC, with Virginia metros when we construct the Hubs Index.[↩]
- Manufacturing USA is a network of research institutes in the United States that focuses on developing manufacturing technologies through collaboration among partners in industry, academia, and government.[↩]
- The bill defines "low population" states as states without an urbanized area with a population greater than 250,000 as reported in the decennial census.[↩]