By Kennedy O’Dell
This piece is the second in EIG’s “Redefining Rural” Series. In this series, EIG explores the economic well-being of rural America by examining gaps between rural and non-rural places and exploring rural prosperity.
Key Findings
- In spite of the fact that much of rural America is economically less prosperous than non-rural parts of the country, there are many rural areas that enjoy high levels of economic well-being and more communities continue to move into those highest tiers of prosperity.
- Those rural communities that are economically prosperous enjoy a high level of economic well-being, including in comparison to their prosperous non-rural counterparts.
- Looking at education, which is a good indicator for earnings, well-off rural areas outperform their well-off non-rural peers when it comes to the average share of adults without a high school diploma and the share of prime age adults working in a county.
- The geographic distribution of rural prosperity still has a clear center of gravity in the Midwest but has shifted somewhat since 2000.
- The group of counties that rose into the top ranks of economic well-being from 2000 to 2018, here called “budding prosperity,” is composed almost entirely of previously middling rural counties with already solid economic foundations in 2000, counties heavily involved in extraction, and exurban counties that are adjacent to metropolitan areas.
- Steady progress, not spontaneous renaissance, is the more common path to rural prosperity: Two-thirds of the counties that rose into the comfortable or prosperous tier from 2000 to 2018 were previously mid-tier.
- The fact that the state of Texas includes some newly well-off previously middling counties, extraction-focused counties, and exurban counties makes it a compelling case study in the geography of new found rural prosperity.
- Very few rural counties that rose into prosperity were majority-minority. Overwhelmingly, rural majority-minority communities remain in the lowest quintile of economic well-being.
EIG’s first piece in the Redefining Rural series found that, on average, rural places lagged behind non-rural places on nearly every measure of economic well-being from poverty rates to labor force participation. However, while much of rural America struggles with economic distress, a significant amount of prosperity does exist and in fact runs quite high in some rural communities. Shining a spotlight on systemic economic distress across much of rural America is important—the plurality of rural counties fall into the lowest quintile of economic well-being according to EIG’s Distressed Communities Index—but so, too, is analyzing what rural prosperity is and where it can be found. Indeed, assessing patterns in rural prosperity and rural distress are complementary. Exploring the geography of rural distress identifies what constraints and barriers lagging regions face and which require policy intervention; exploring the geography of rural prosperity paints a picture of what is possible and how it might be achieved. Identifying key patterns across economically successful rural communities and learning from places experiencing persistent, budding, and slipping rural prosperity is thus critical to creating informed public policy.
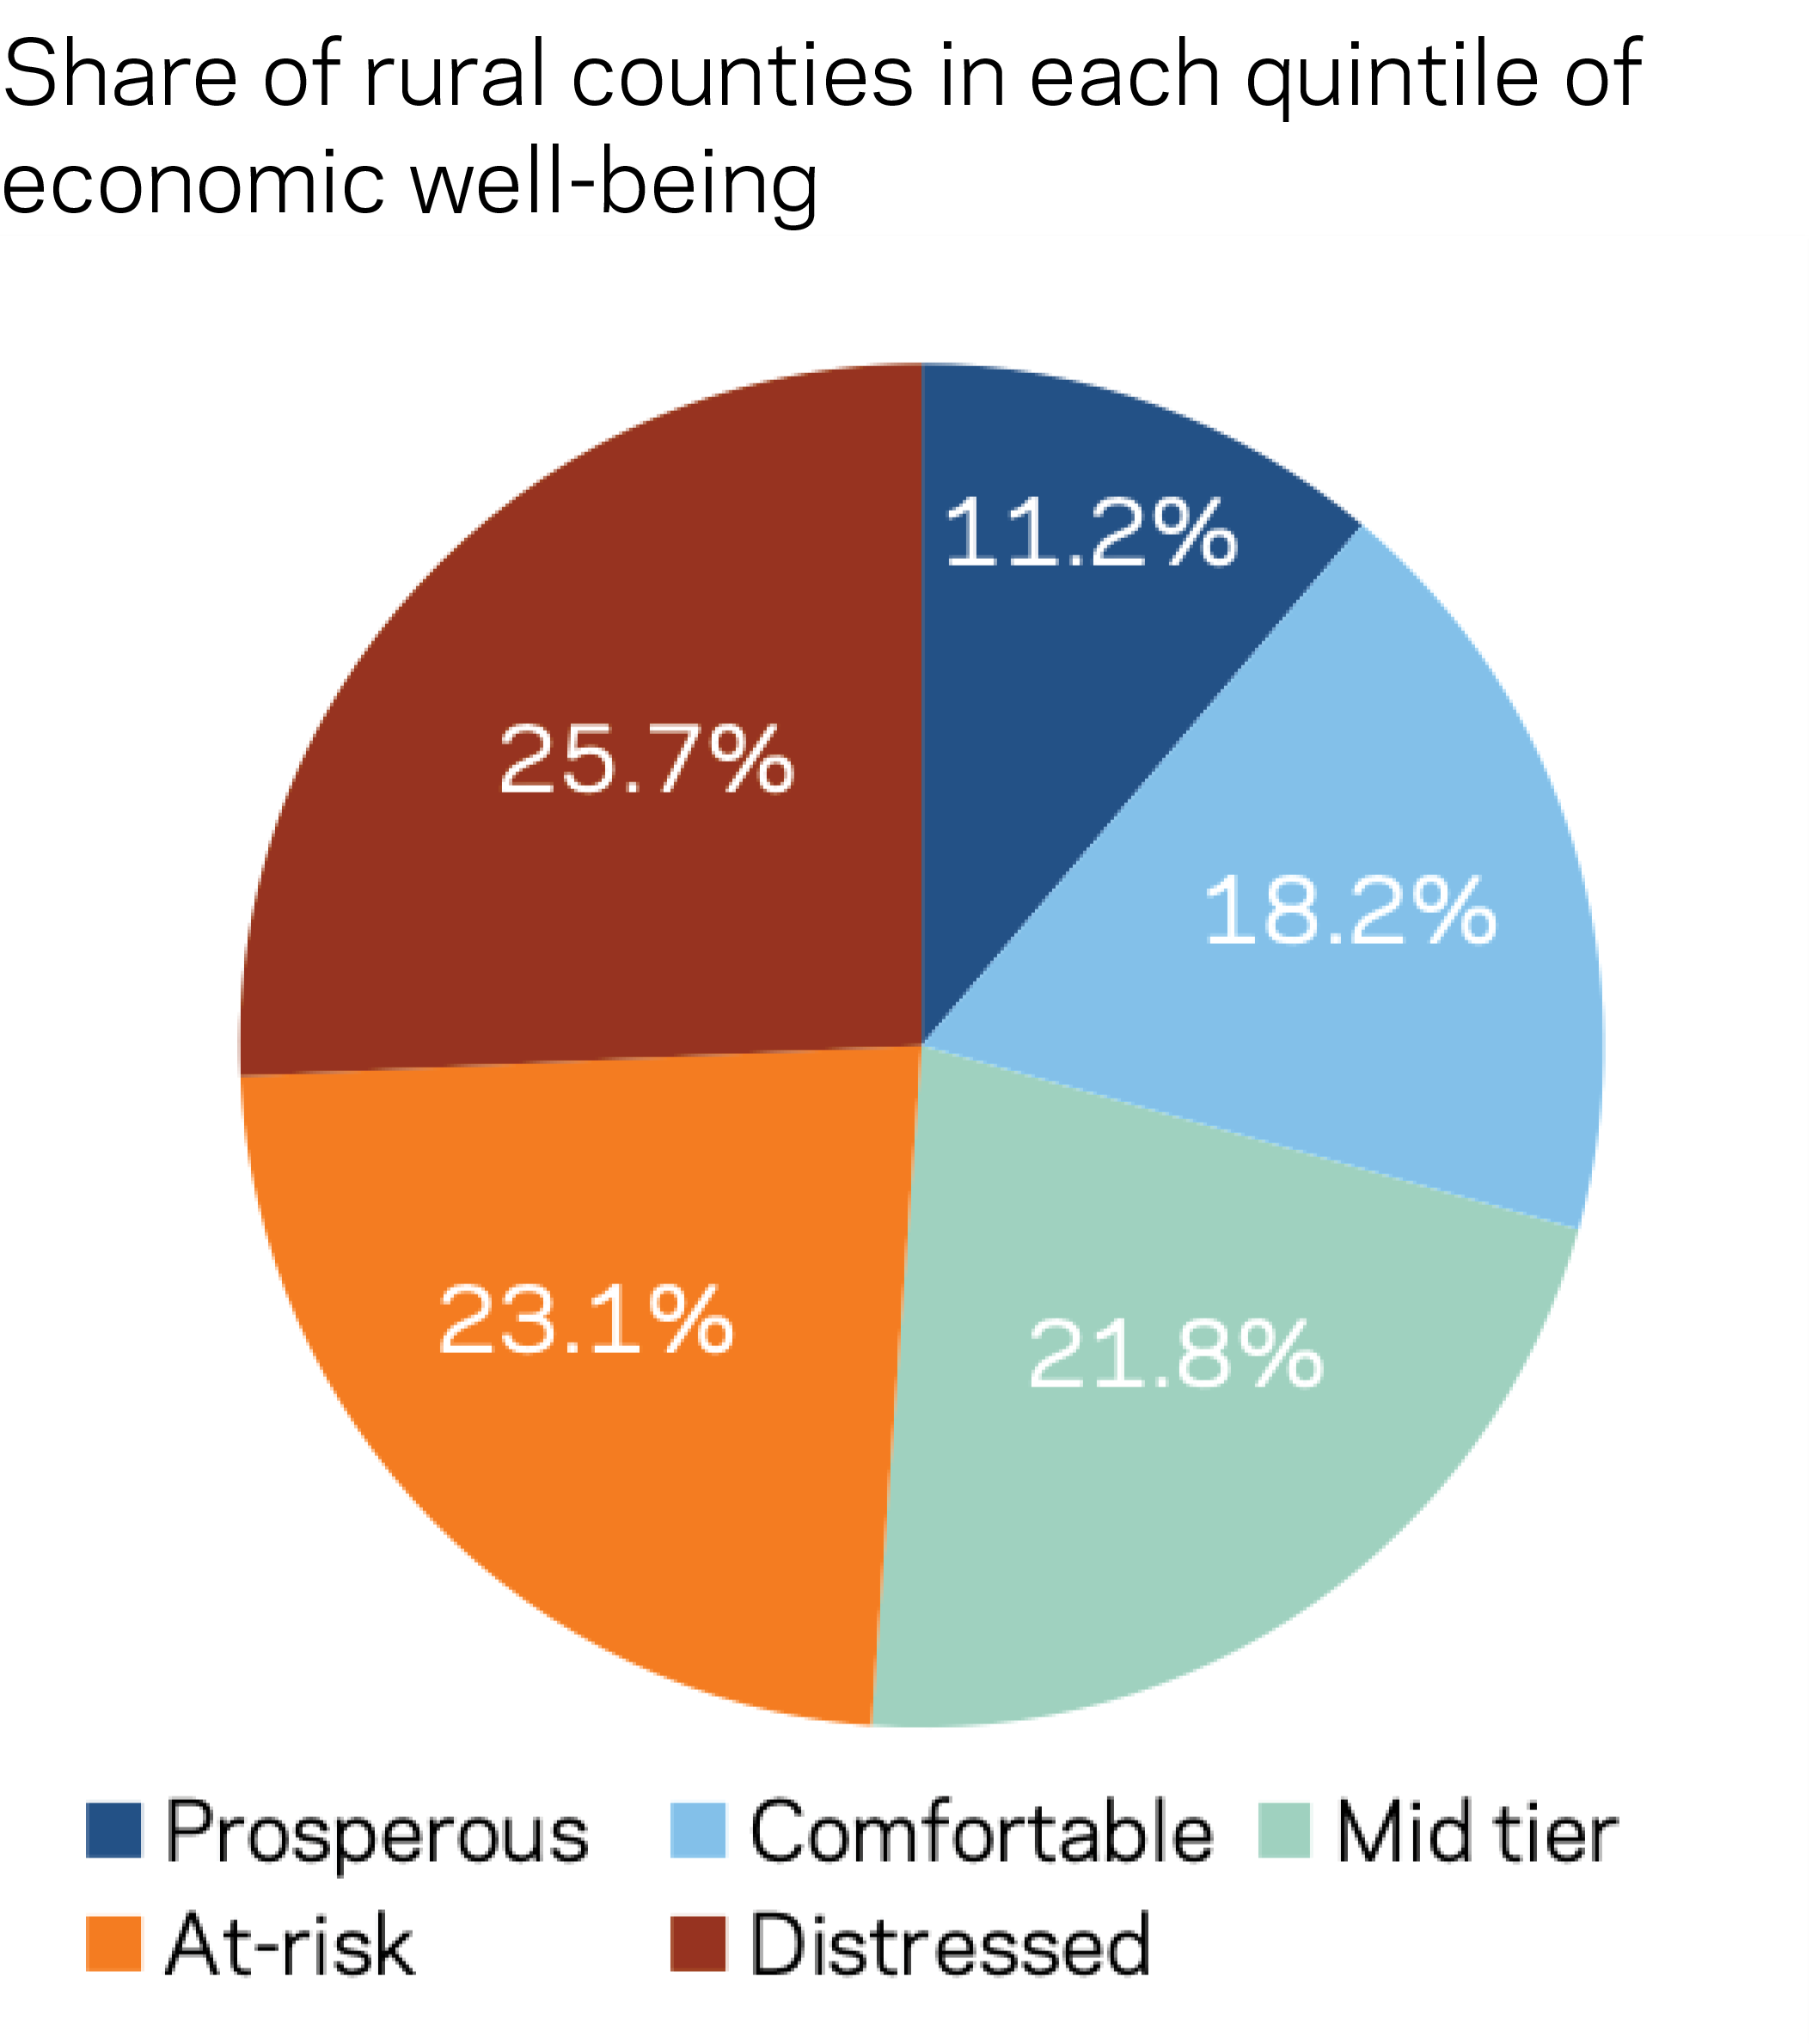
To define rural, EIG combined elements of various measures of rurality to create a designation that classifies 2,290 counties as rural and 843 counties as non-rural based on metropolitan, micropolitan, and true rural designations as well as total population. According to this definition of rural, in 2018, 52.5 million people, or 16 percent of the U.S. population, lived in rural counties. To evaluate economic well-being, this analysis uses EIG’s Distressed Communities Index (DCI) which assesses local economic well-being by scoring counties on seven different socioeconomic indicators: poverty rate, adults without a high school diploma, housing vacancy, adults not working, median income ratio, job growth, and business openings. Communities are then sorted into five even quintiles, or tiers, of economic well being: prosperous, comfortable, mid-tier, at risk, and distressed. Based on movements into and out of these categories from 2000 to 2018¹, we can identify three categories of rural prosperity:
- Persistent prosperity: Rural counties in the top two quintiles of economic well-being nationwide in 2000 and the 2014-2018 time period (485 counties, 21 percent of all rural counties, 72 percent of all rural counties that were prosperous or comfortable in 2018)
- Budding prosperity: Rural counties outside the top two quintiles of economic well-being nationwide in the 2000 time period that rose into the top two quintiles by the 2014-2018 time period (184 counties, 8 percent of all rural counties, 27 percent of all rural counties that were prosperous or comfortable in 2018²)
- Slipping prosperity: Rural counties in the top two quintiles of economic well-being nationwide in the 2000 time period that dropped out of those quintiles by the 2014-2018 time period (183 counties, 8 percent of all rural counties, 27 percent of all rural counties that were prosperous or comfortable in 2000)
Together, these three categories reveal a great deal about the geography of rural prosperity, both its relative “stickiness” as well as clear trends among the cohorts of rising and falling counties. This analysis looks closely at the newcomers, those rural places experiencing budding prosperity since 2000. Before exploring any category in depth, however, it is important to first define what is precisely meant by rural prosperity.
What Does Rural Prosperity Look Like?
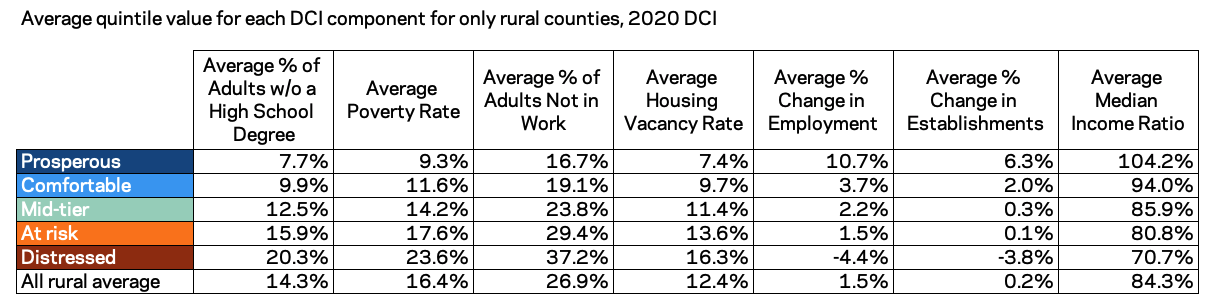
Highly prosperous rural places are significantly better off than their struggling rural peers, as evidenced by the table below. Large gaps exist across metrics from poverty rate to educational attainment and paint a picture of just how distinct rural outcomes can be.
Prosperous and comfortable rural communities enjoy a high quality of life, including in comparison to their non-rural counterparts.
Well-off rural counties have a lower average share of adults without a high school diploma as well as a lower average share of adults not working than well-off non-rural counties. In rural places, the average share of adults lacking a high school degree is fewer than 10 percent for both of the top two quintiles of well-being, meaning a broader share of the population in well-off rural places tends to have a basic education. The share of prime working-age adults not working is also lower in well-off rural places than in well-off non-rural places, meaning a larger share of the population is engaged in work. Prosperous and comfortable rural counties also have lower poverty rates on average. While neighborhood-level variation within urban counties is obscured somewhat by the county lens, the gaps across metrics are still notable.
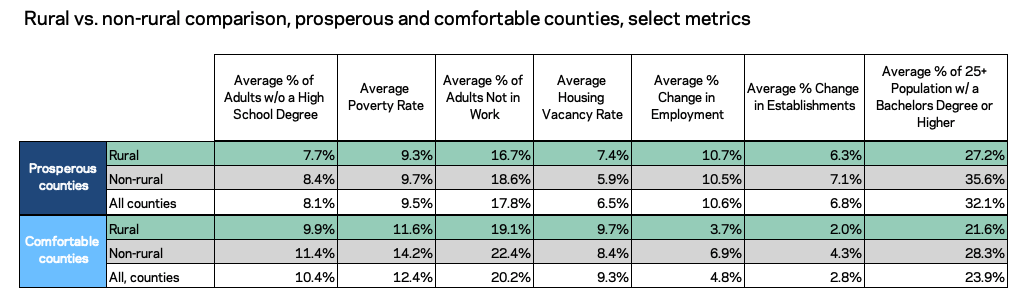
While well-off rural places best their non-rural counterparts on workforce and basic education, they tend to lag behind on higher education, vacancy rates, employment growth, establishment growth, and income. A significantly lower share of the population possesses a bachelor’s degree or higher in well-off rural places, a fact that signals the lagging higher educational attainment in even the best-off rural places, but also alludes to the tendency for high-wage, high-skill jobs to increasingly concentrate in metro areas. Evidence of the skill concentration in cities finds interesting support within the rural continuum itself. The rural areas with the highest average educational attainment are not the exurbs, but rather high-population micropolitan areas where the education and recreation economies overlap. Many of these host research universities, such as Grafton County, New Hampshire—home to Lebanon and Dartmouth—and Gallatin County, Montana—home to Bozeman and Montana State.
The top cohort of rural counties also suffers from slightly higher vacancy rates and lags behind their non-rural peer group when it comes to establishment growth as well as median income, although in many cases lower incomes are tied to differences in cost of living. Despite these caveats, prosperous and comfortable rural places broadly have a high level of economic well-being, not just relative to distressed places but also to their well-off non-rural peers.
How Has Rural Prosperity Changed Since 2000?
Broadly, rural areas tended to move in the same direction on several indicators of economic well-being from 2000 to 2018. Rural counties from distressed to prosperous experienced significant improvement on average in the share of adults without a high school degree, a tendency for poverty and vacancy rates to rise, and employment and establishment growth to decline. The broad tendency for rural areas to have lost population over the last 20 years contributes to rising vacancy rates and declining business growth across much of rural America, as fewer residents means empty housing stock and less demand for goods and services. The share of prime-age adults not working remained largely unchanged, still well below the national average. A culture of work thus remains a defining feature of the rural economy.
In terms of changes in rural prosperity relative to rural distress, the gap has widened between the groups on two key metrics: the share of prime age adults not in work and the average vacancy rate. In prosperous and comfortable rural communities, the average share of prime age adults not working did not change much from 2000 to 2018 but in distressed rural communities, it climbed 3 percentage points. Average vacancy rates rose across all types of rural communities but climbed much more in distressed counties. The gap between well-off rural places and distressed rural places in terms of employment and establishment growth narrowed as growth sputtered across quintiles and the well-off counties took the biggest relative hits to significantly higher figures. Similarly, the gap between the best-off and worst-off on the share of adults without a high school degree narrowed as all rural communities made massive improvements in basic educational attainment, especially the most distressed areas.
The geographic distribution of rural prosperity still has a clear center of gravity in the Midwest although within the region itself, the balance of prosperity has shifted somewhat since 2000. In 2000, 61 percent of all prosperous and comfortable rural counties were located in the Midwest and that share remained nearly identical in 2018. Within the region itself, there was some turnover as over 100 geographically scattered counties fell out of the top tiers of well-being while a new crop of nearly the same size clustered in the Northern Plains rose into them. Beyond the region, there was some upward mobility in the West and certain corners of the South as well as a degree of persistent prosperity in the Northeast. However, despite these trends, the Midwest remained home to over half of the country’s rural residents living in prosperous or comfortable communities in 2018.

Budding Rural Prosperity
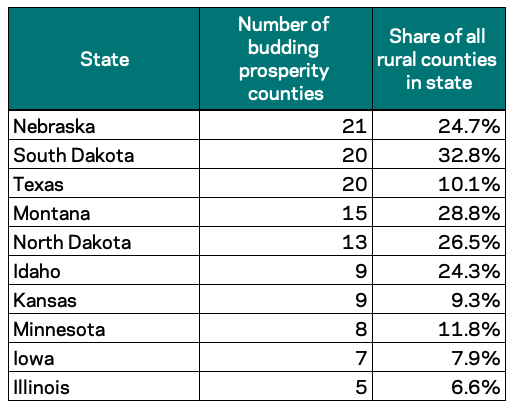
Just over a quarter of the most well-off rural counties in 2018 enjoyed relatively newfound prosperity. While upward mobility was much less common than persistent rural prosperity—over 70 percent of all counties that were in the top two tiers of economic well-being in 2018 had also been in those tiers in 2000—a significant cohort of counties rose into the top tiers of economic well-being over the period. While diverse, the group of counties experiencing budding prosperity is composed mostly of previously middling counties with already solid economic foundations in 2000, exurban counties adjacent to metropolitan or micropolitan areas, and extraction counties, particularly the newly affluent Northern Plains counties.
In general, the Midwest had the highest number of rural counties moving into the top tiers of well-being. Due in part to high levels of pre-existing prosperity in the Northeast, the region had few counties rise, while the South had few winners outside of rising star Texas due to initially low levels of rural well-being across much of the region. The newly prosperous class of Western counties, led by strong cohorts from Montana and Idaho, joined a burgeoning group of affluent rural Western counties. The recent crop of newly affluent Western counties are decidedly less populated than the persistently prosperous rural places, potentially reflecting the geographic expansion of prosperity in the West beyond city centers and resort communities. That being said, with the heavy emphasis on extractive industries that are vulnerable to both boom and bust cycles, as well as pressure to transition away from high greenhouse gas emitting sources of power in many newly prosperous communities, the staying power of much of the past 20 years’ new-found rural prosperity is an open question.
Which types of rural communities became prosperous?
Steady progress towards prosperity was much more common than major economic transformations. In total, two-thirds of the counties that rose into the comfortable or prosperous tier from 2000 to 2018 were previously in the mid-tier, meaning they were roughly middling relative to the rest of the nation at the turn of the 20th century. As one would assume, beginning close to prosperity in terms of absolute levels of well-being seems to have made the leap upwards easier. Interestingly, population growth was not necessarily required for this group to make the final step up to prosperity. Of the 125 counties that rose into prosperity from a previously middling position, just over half are estimated to have a net loss of residents from 2000 to 2019.³ Geographic proximity to existing prosperity did seem to help, as many newly prosperous places filled in the map between previously persistently prosperous places. This pattern is visible across much of the Midwest and West with a particularly clear example of strengthening regional rural prosperity in Nebraska, where rural prosperity is increasingly becoming the norm.
Much of the newfound prosperity across rural America is tied to natural resource extraction. Almost half or 46 percent of all budding prosperity counties were heavily involved in natural resource extraction⁴. Broadly, the group includes places as varied as: Morgan County, Colorado and its mines; extraction-oriented Eddy County in New Mexico; and Bakken formation beneficiaries Williams and McKenzie Counties in North Dakota. An extraction focus was more common among those who leapfrogged the middle tier of well-being (64 percent of the members of that group) than the cohort of formally middling rural places that rose into the top tier of well-being (38 percent of the members of that group). A large swath of the newly prosperous counties that are heavily involved in extraction are found in the Northern Plains (North Dakota, South Dakota, and Nebraska) and Western Montana. Over 60 percent of all newly prosperous rural counties in the four states had more than four times the national concentration of employment in the natural resources and extraction sector. Neighboring counties with lower relative shares of employment in extraction also prospered, likely due to commuting patterns across the upward moving rural regions. Extraction seemed less tied to newfound prosperity in more densely populated rural Northeast, for example many counties along Pennsylvania’s northern border in the Marcellus Shale formation experienced slipping rather than budding prosperity.
Another group of risers were a collection of growing exurban counties around some major metro areas. In total, 43 percent of the budding prosperity counties were adjacent to a metro area, particularly in the South and the Midwest. In the South, the rising exurbs included rural counties on the outskirts of San Antonio and Houston in Texas and on the edges of the Nashville and Memphis metros, while the cohort of rising Midwestern exurbs included places like Caldwell County, Missouri (on the edge of the Kansas City metro area) and Union County, Indiana (on the northern edge of the Cincinnati metro area). A crop of micropolitan college towns on the fringes of metros were also among the exurban winners, including Putnam County, Tennessee, home to Tennessee Tech; Lafayette County, Mississippi, home to Ole Miss; and Kittitas County, Washington, home to Central Washington University. Employment growth boomed in these budding prosperity exurban counties, with the average at 14.3 percent from 2014 to 2018 relative to a 6.4 percent average for all comfortable or prosperous rural places. A similar story appears with establishment growth, where the exurban counties experiencing budding rural prosperity saw a 6.0 percent average increase versus a 3.6 percent average for all well-off rural places.
The economic boundaries of the nation’s metro areas continue to expand with both commuter areas or sheds, and particular kinds of sprawl reaching into rural areas; as a result, the exurbs increasingly represent the blurring of the metro-rural interface in certain parts of the country. While strong connectivity to metro areas has proven to be a driving force for rural prosperity, rapid population growth can change the character of a place such that it no longer feels, or is classified, as rural. In a few years, several members of this exurban cohort may become so developed they no longer are classified as rural by any scheme. This transformation is a consistent pattern over time that has been documented by researchers and has contributed to rural America looking more distressed on average as the highest achieving places get redesignated. This “outgrowing rural” phenomenon affects both exurbs and booming micropolitans, with rapidly growing Waller County outside of Houston providing an exurban example, and Gallatin County, Montana, providing a strong micropolitan example. Exurbs and micropolitan areas need not become truly urban themselves to prosper, as evidenced by a population of consistently low-population rural counties on the fringe of many metros, but if urban sprawl and population booms in certain micropolitan areas persist, they will likely continue to challenge the rurality of many of the most prosperous rural counties.
Very few rural counties that rose into prosperity were majority-minority and the overwhelming majority of rural, majority-minority communities remain in the lowest quintile of economic well-being. Generally, the rising crop of rural counties was on average 87 percent white, while the rural average is 79 percent white. The number of majority-minority rural communities in the top two quintiles of well-being rose from four to nine, four of which were in Texas. Even after this small shuffle, there are 80 times more majority-minority rural communities in the lowest quintile of economic well being (161 counties) than in the highest (2 counties). No counties flagged as Native American Lands by the American Communities Project rose into the top tiers of economic well-being. Thus, while some counties did move up within the lower quintiles, the past two decades did not see transformations that resulted in very many of rural America’s most diverse communities breaking into prosperity.
All but seven percent of the budding prosperity rural counties in 2018 were either adjacent to a metro, heavily involved in extraction, middling in 2000, or some combination of the three. Proximity to a metro and extraction aren’t the only paths to prosperity: almost a quarter of rural counties that rose into the top quintiles of well-being from 2000 to 2018 were neither adjacent to a metro or heavily dependent on extraction. However, the base level of development in these more geographically isolated areas is a central determinant of success, as evidenced by the fact that 70 percent of the counties that rose into the top quintiles without proximity to a metro or a heavy extraction focus were middling in 2000. Without meeting any of those three conditions, leapfrogging into the highest tiers of rural well-being was exceedingly rare.
A Case Study in Budding Prosperity: Texas in Focus
Many of the previously discussed trends in local upward economic mobility—big swings in well-being for certain rural extraction-oriented counties, blossoming well-being in certain exurbs, previously middling places making the final jump into prosperity—exist in Texas and make it a compelling case study in the geography of newfound rural prosperity. With 20 counties rising to prosperity over the period, Texas is the state with the third highest number of newly prosperous counties behind only Nebraksa and South Dakota. It is also far and away the Southern state where the greatest number of counties rose to join the prosperous and comfortable class of counties from 2000 to 2018. (For comparison, the Southern states with the next highest number of newly prosperous or comfortable counties, Missouri and Tennessee, had 5 newly well-off counties.)
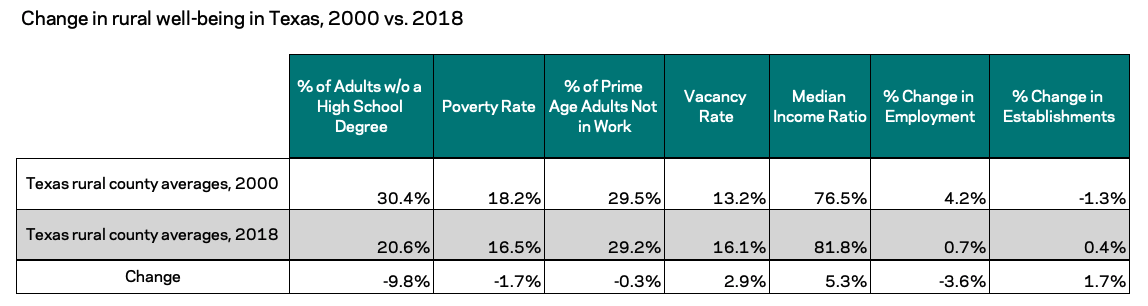
While this movement into the top tiers is impressive, rural well-being is on the march in Texas more broadly as well. From 2000 to 2018, 120 of the 199 rural counties in the state experienced increases in overall economic well-being of which roughly half saw significant improvement. The improvement in overall economic well-being in many places shows up quite strikingly in specific metrics: the average poverty rate for rural counties in Texas dropped from 18.2 percent in 2000 to 16.5 percent in 2018, falling dramatically as the national average poverty rate across rural counties rose. To put this shift in context, the average poverty rate across rural counties was 3 percentage points higher for rural Texas versus the national average for rural counties in 2000 and by 2018 the average poverty rates were nearly identical.
Geographically, a collection of upwardly mobile rural counties stretches through the southern part of the state, starting in the west just beneath Lubbock before bending to the southeast to follow the Pecos River, curling under San Antonio, and running to the Gulf. This band of prosperity stretches across two oil and gas producing areas: the Permian Basin in southwestern Texas and the Eagle Ford Shale to the south of San Antonio. A smattering of upwardly mobile counties can also be found throughout the panhandle, around Wichita Falls, and along the edge of the Austin metro area. By contrast, many of the states’ downwardly mobile rural counties are largely in East Texas, along the Brazos River or loosely clumped around the city of Tyler.
Forty percent of the newly prosperous rural counties in Texas were middling in 2000 while fifty-five percent of all newly prosperous rural counties in Texas were heavily involved in resource extraction, and they account for nearly all of those that leapfrogged the middle tiers of economic well-being over the period. With the rise of more broadly spread rural prosperity in Texas being relatively recent, the pattern of newly prosperous counties filling in the map of previous prosperity is far less present than in the Midwest, but the rising exurbs are clearly visible, as previously discussed. All of these forces acting in concert have served to buoy rural prosperity across Texas.
Policy Implications
There is perhaps as much to learn from rural prosperity as there is from rural distress. When it comes to budding prosperity, the exurbs, extraction counties, and ascendant, formerly middling places are clear winners. What does their somewhat intuitive rise tell us?
First, that there are no silver bullets in development policy. The sheer magnitude of explainability is quite striking—very few counties appear to have undergone transformations that aren’t covered by these three umbrellas. Local efforts in these places may have accelerated the coming of or expanded the reach of local prosperity, but almost all counties can be accounted for with macro trends.
Second, geography is intimately tied to economic success in rural places. Geography alone is not responsible for a rural community’s economic well-being: local, state, and national policy obviously play a large role in shaping the outcomes of communities. Zoning provisions, extraction regulations, and place-based investments in people and infrastructure, for example, shape economic outcomes for people and places across the country. However, this analysis demonstrates that geography’s hold on a community’s fate is not easily escaped. Geography isn’t destiny, policy is vital, but it is the union of the two that shapes outcomes. A recognition of this relationship should guide policymakers as they work to deliver broader prosperity.
Third, and relatedly, while a certain degree of locational luck is to thank for much of the extraction-based prosperity, the large cohort of formerly middling rural counties rising into the top tiers supports something practitioners already know to be true: organic economic transformation beyond exurbs and extraction centers takes time but is achievable. Steady progress, not spontaneous renaissance, is the more common path to rural prosperity.
Finally, the clear pattern of regional rural prosperity in which many counties that rose into the top quintiles of well-being acted as infill between already prosperous rural places provides evidence that it is particularly hard for rural communities to rise alone. This tendency for prosperity to cluster and for rural counties’ fortunes to rise and fall together provides an implicit argument for rural regionalism.
So much attention has been paid to how and why rural places have fallen in economic stature. It is long past time to study and learn from those communities that have risen as well, letting them demonstrate not just what is possible, but how to get there.
1This analysis uses the 2020 Distressed Communities Index which pulls 5-year ACS averages from 2014 to 2018. It compares it to a version of the index constructed for the year 2000 that uses a single year of decennial Census data. All accessory data sets incorporated in this analysis use 2018 values for compatibility.
2Data note: The shares of persistent and budding prosperity counties that were prosperous or comfortable in 2018 does not sum to 100 percent due to three Alaska counties whose value could not be calculated in 2000 and therefore cannot be sorted into either category.
3Based on U.S. Census Bureau County Population Estimates for July 2000 and July 2019.
4“Heavily involved in natural resource extraction” is here defined as those with greater than 4 times the concentration of employment as the national figure in the natural resources and mining sector in 2018 as indicated by a location quotient for the sector greater than 4 in the annual QCEW.