
By Kennedy O’Dell
This piece is the first in EIG’s “Redefining Rural” Series. In this series, EIG explores the economic well-being of rural America by examining gaps between rural and non-rural places and exploring rural prosperity.
Key Findings
- On average, rural places lag behind non-rural places on nearly every measure of prosperity from poverty rates to labor force participation.
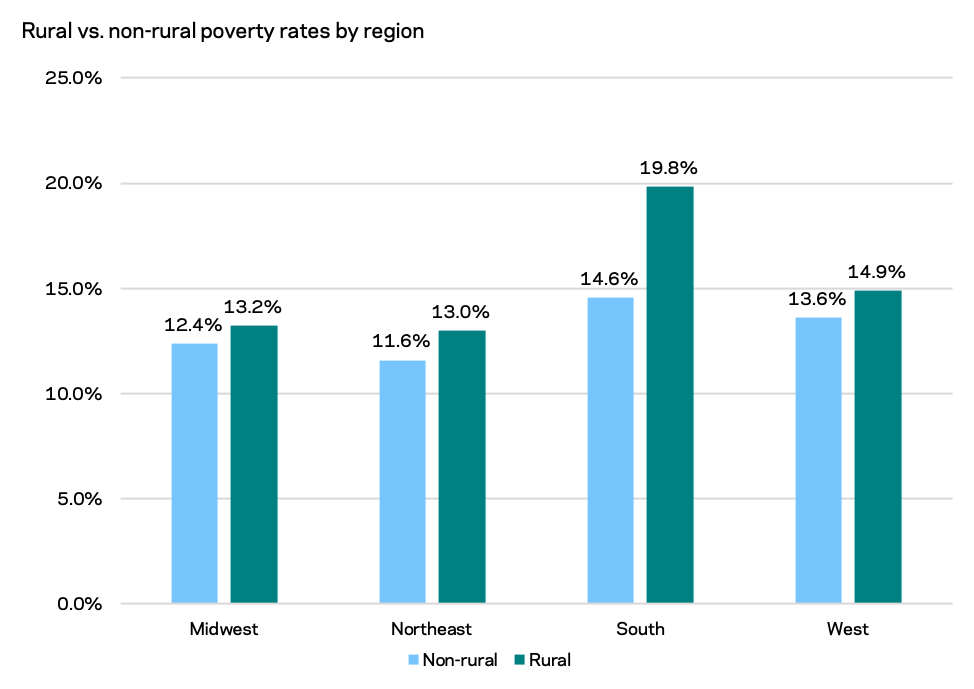
- The average poverty rate in rural areas is nearly three percentage points higher than in non-rural areas. The biggest gap between rural and non-rural welfare is in the South.
- From 2014 to 2018, 43.4 percent of rural counties experienced negative employment growth compared with just 16.6 percent of non-rural counties.
- 91 percent of rural counties lost prime working age population from 2010 to 2019 and 51 percent lost 10 percent or more.
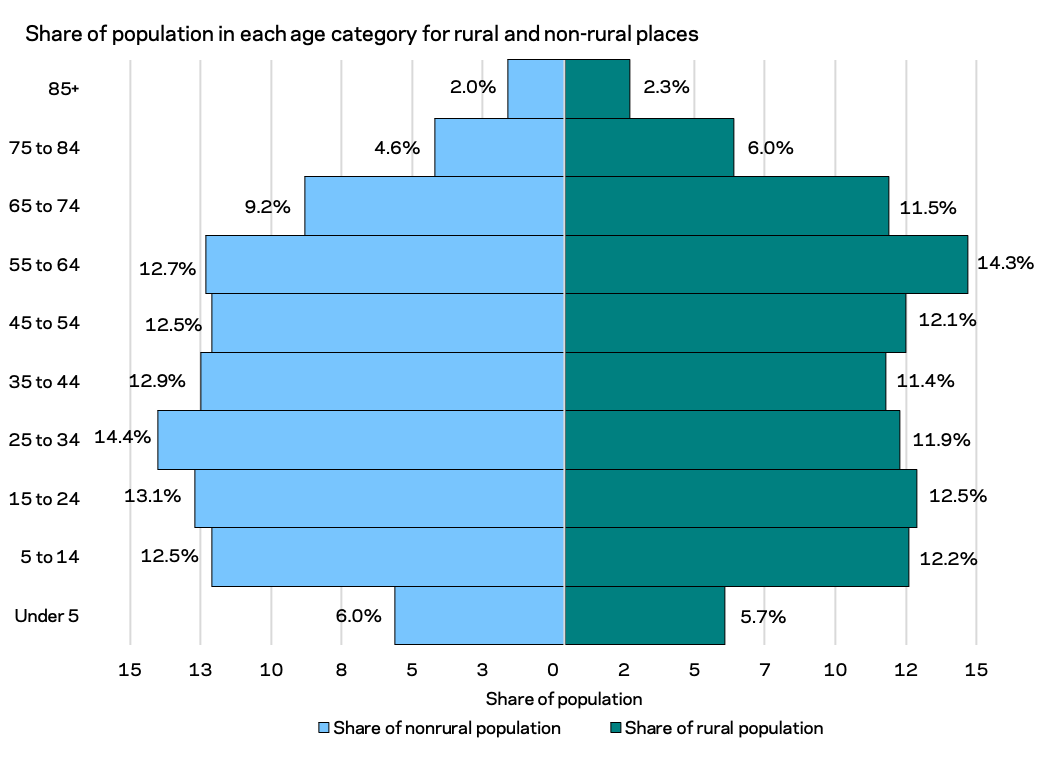
- The biggest age cohort in rural America is 55-64, compared to 25-34 in non-rural areas.
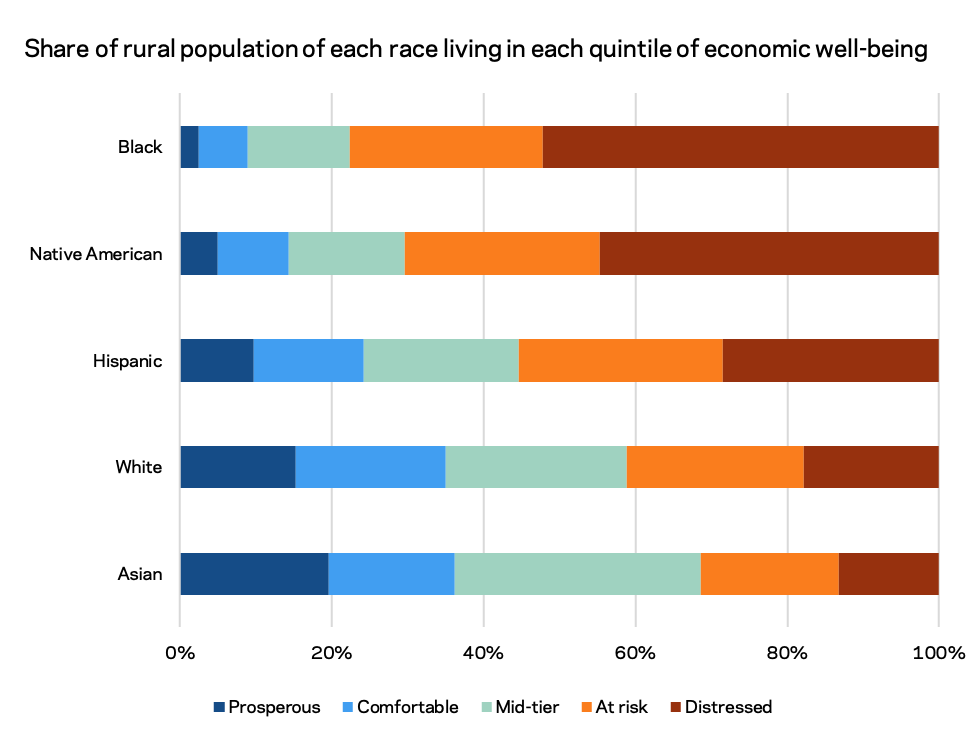
- Over 50 percent of rural Black residents and 45 percent of rural Native American residents live in a distressed county compared to 18 percent of rural whites.
- Recreation focused rural counties are generally the most prosperous. One in four rural counties in the highest quintile of economic well-being are recreation-dependent.
It is widely understood that a gap exists in economic prosperity between many rural places and booming metros. This gap, driven wider in recent years by the concentration of high-wage, high-tech workers in metro areas, is a function of a set of headwinds facing many rural communities, including a dwindling and aging population, lagging educational attainment rates, economic orientations particularly susceptible to economic shock, and, in some places, underdevelopment. The scale and scope of the challenge facing rural America necessitates bold interventions and strong strategy, but, as Tony Pipa and Natalie Geismar of the Brookings Institution demonstrate, federal rural policy is a convoluted hodgepodge of interventions that is “outdated, fragmented, and incoherent.” Quantifying the problem is an essential step in justifying the urgency of innovative interventions. To this end, this analysis proposes a novel working definition of “rural” in order to quantify the gaps between rural and non-rural places. It then considers how rural areas differ from each other, and from non-rural places in terms of economic health, educational attainment, racial makeup, and economic structure.
What parts of the country are rural?
A working definition of “rural” must go beyond the metropolitan versus non-metropolitan distinction and strive for inclusivity.
There is an appetite for a clear and consistent system that categorizes all places within the United States as rural or non-rural, but the truth is that no system can perfectly capture all rural places. This is because our broader conception of rurality itself varies so much. Is it about an experience of relative economic isolation best captured through travel time to large metro centers or airports? Is it about population density or a socio-cultural experience of “rural” life? The approach you take to identifying rural places is determined by the question you ask. Data availability in sparsely populated places also adds more complexity and often forces the scope of inquiry and classification to a higher level less able to capture variation within geographic boundaries. Yet, some kind of coherent system is necessary to compare rural places across the country and diagnose the scope and type of problems rural areas face.
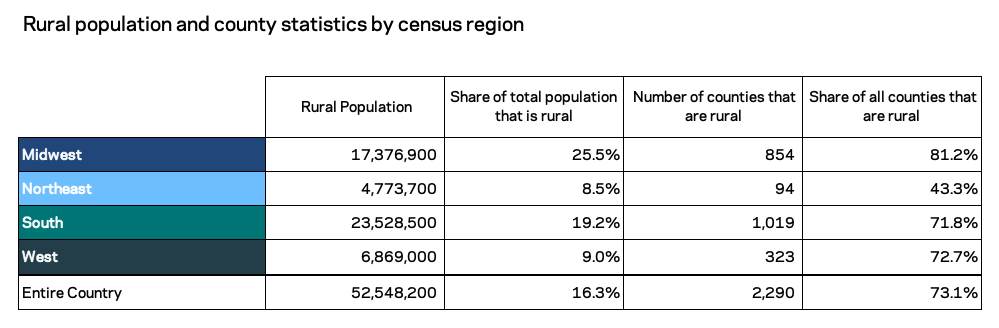
So what actually is rural? To make that determination, EIG combined elements of various measures to create a hybrid designation that considered metropolitan, micropolitan, and true rural designations, as well as total population. The hybrid definition borrows a metro versus non-metro designation from the Office of Management and Budget framework, but considers low-population outlying metro counties and all micropolitan counties rural so as to include areas associated with metropolitan commuting sheds that may be more rural in character. Counties were selected as the geographic unit despite issues with internal variation because they are a standard unit for both data collection and government intervention in a way that sub-county geographies, such as census tracts, are not, particularly in rural areas. Beyond the rural or non-rural distinction, the EIG classification scheme also borrows a measure of urban influence and connectivity in the form of metro adjacency from the U.S. Department of Agriculture’s Rural-Urban Continuum Code system to turn the classification scheme into a continuum of rurality. In total, the hybrid EIG classification scheme tags 2,290 counties as rural and 843 counties as non-rural. In 2018, 52.5 million people, or 16 percent of the U.S. population, lived in rural counties.1 Everything in a shade of green in the map below is rural, with the areas in darker green tending to have a lower population and be more isolated.

A final caveat to any discussion of what “rural” means is an acknowledgement that, regardless of the terms of the definition, the group of qualifying counties will change as population dynamics reshape local economies. Recent analysis by Headwaters Economics noted that 48 percent of the counties that were rural in 1970 are now classified as urban, a product of both changing county qualifications for being considered part of a metro area and population growth. The analysis found that the areas that were redesignated tended to be younger and have higher per capita incomes, meaning that as they left the rural group, the remainder of rural America appeared older and poorer. This growth paradox—that in some cases economically successful rural places cease to be considered rural—further complicates long term analysis of economic prosperity in rural places.
While the designation may still miss some rural areas in counties with large population centers (e.g., the parts of Lancaster County, Nebraska, beyond Lincoln, or the rural parts of the counties included in the Birmingham, Alabama, metro area), the definition generally captures most of the country that looks, feels, and would self-identify as rural. In an effort to catch all of the various forms of rurality across the nation, the EIG designation design errs on the side of inclusivity – usually, if a county could be considered rural or is by another system, it is by this scheme. Even with this generous definition, stark gaps in community well-being are clear between rural and non-rural places.
How do rural areas differ from non-rural areas and how do rural areas differ from each other?
Poverty and Prosperity
Rural places writ large lag behind on nearly every measure of prosperity from poverty rates to labor force participation.
The average poverty rate in rural areas is nearly three points higher than in non-rural areas, (13.5 percent in non-rural; 16.4 percent in rural). The poverty rate is consistently higher in rural areas throughout the country, but the biggest gap between rural and non-rural welfare is in the South. The smallest gap between rural and non-rural poverty rates is found in the Midwest, where other EIG analysis shows that rural well-being runs especially high.
Economic growth is elusive in many rural places. Half of all rural counties experienced a net decline in business establishments from 2014 to 2018 compared to just one in five non-rural counties. The numbers look nearly as grim for employment. From 2014 to 2018, 43.4 percent of rural counties experienced negative employment growth compared with just 16.5 percent of non-rural counties.
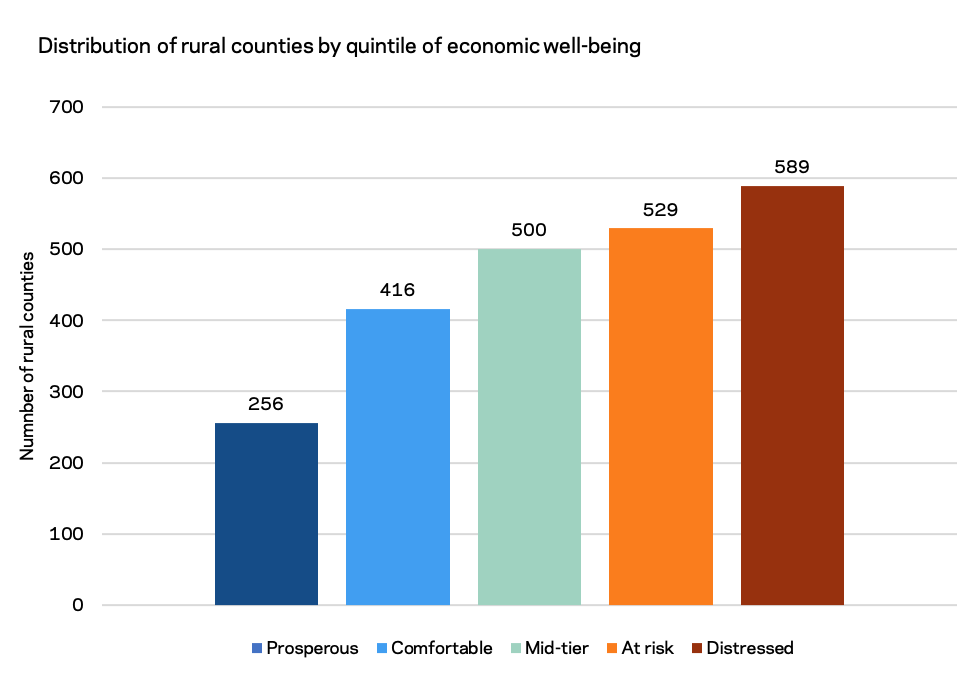
Twice as many rural counties are economically distressed as are prosperous.
EIG’s Distressed Communities Index (DCI) compares economic well-being across the country and paints a sobering picture for much of rural America. The DCI assesses local economic well-being by scoring places on seven different metrics of economic performance covering poverty, education, housing vacancy, work, incomes, job growth, and business openings. Each score is then ranked, and counties are placed into one of five even quintiles of economic well-being that range from prosperous to comfortable, mid-tier, at risk, or distressed. The plurality of rural counties fall into the distressed category, indicating that they fall into the lowest quintile of economic well-being nationally.
At 589, the number of rural counties in the distressed quintile of economic well-being is more than double that in the prosperous quintile. Indeed, as economic well-being improves, the number of rural counties in each quintile declines. Less than one-third of the rural population lives in a county in the top two tiers of economic well-being, while 46 percent of rural Americans find themselves in distressed and at-risk communities.
Rural areas also lag their non-rural counterparts in terms of the share of adults in the workforce and median household income. In the average rural county, 26.9 percent of prime age working adults are not in work compared to 22.1 percent in non-rural counties. While some variation in median household income (MHI) may reflect differences in cost of living, the average MHI is also $13,600 less in rural areas than in non-rural areas ($61,600 in non-rural; $47,900 in rural).
Population Dynamics: Population Decline, Educational Attainment, and Age
In general, rural areas are older, tend to have fewer people with a college degree, and tend to experience population loss more than their non-rural counterparts.
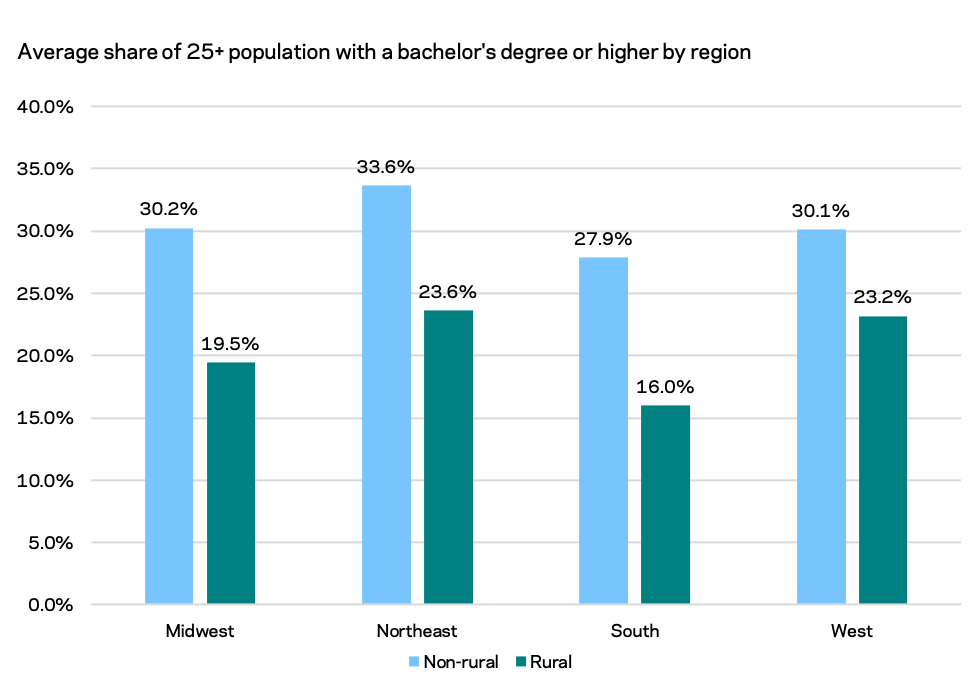
Rural areas have a significantly lower average share of their population with a bachelor’s degree or higher, only 18.6 of residents in rural areas compared to 29.6 percent of residents in non-rural places. While the base share of rural Americans with a bachelor’s degree has increased markedly in recent decades, growth in non-rural areas has outpaced that in rural communities leading the educational attainment gap to grow wider even as ever higher absolute numbers of rural residents hold degrees. The West (23.2 percent) and the Northeast (23.6 percent) have the highest average share of rural residents with a bachelor’s degree or higher. In the Midwest, 19.5 percent of rural residents have a bachelor’s degree or higher compared to an average of just 16.0 percent of rural residents in the South. The average share of adults without a high school degree is higher in rural areas (14.3 percent) than in non-rural areas (11.1 percent) as well, although the gap is notably much smaller than the higher education deficit.
Nearly two-thirds of rural counties experienced population loss from 2010 to 2019 while 91 percent lost prime working age population.
Population decline undercuts prosperity in many rural areas. Nearly two-thirds (64.6 percent) of rural counties experienced population loss from 2010 to 2019 compared to just 23.8 percent of non-rural counties. Rural counties are doing even worse when it comes to prime working age population, those between the ages of 25 to 54. In total, 91 percent of rural counties lost prime working age population from 2010 to 2019 and over half (51 percent) lost 10 percent or more. While some counties beat the curve, the norm in rural areas is a stagnating or declining population.
The biggest age cohort in rural America is 55-64, compared to 25-34 in non-rural areas.
Much of rural America also has an older population. The average share of a rural county population that is over 65 is nearly four percentage points higher than the non-rural average (20.8 and 16.9 percent, respectively) while the average share of the population that is of prime working age, between 25 and 54, is also more than three percentage points lower (34.7 percent; 38.1 percent). Strikingly, 84.5 percent of rural counties have more older people between the ages of 55 and 64 than younger people between the ages of 25 and 34. The aging of the US population affects all counties—just over half of non-rural counties also have more individuals in the 55 to 64 age bracket than the 25 to 34 group—but rural places skew older than their non-rural peers. Part of this age gap is driven not just by young people moving out but older people moving in as some rural communities and rural recreation communities in particular attract retirees. Thus while rural areas tend to be older, the precise dynamics driving that change and the implications for local economic well-being vary somewhat.
Race and Rurality
Race, rurality, and economic prosperity are intertwined throughout the country but particularly in the South and the tribal West. In the United States, 21.0 percent of white Americans live in rural places compared to 7.4 percent of Latinos, 11.0 percent of Black Americans, 46.3 percent of Native Americans, and 2.9 percent of Asians and Pacific Islanders. The level and type of diversity in rural communities varies across the country, but in many places geographic inequality and racial inequality compound. The fallout of systemic disadvantage based on race is visible in lower economic mobility in areas of the country with high shares of Black residents2, higher unemployment rates for Native Americans3, and systemic underemployment of Latinos4 to name but a few examples. These outcomes are not accidents but the long-term legacies of explicit segregation, de facto discriminatory policies, and a failure to meaningfully intervene to correct for the impact of such policies. Structural racism, intended here to mean racial disadvantage perpetuated by past and present institutions, thus overlays the rural experience. At the same time many majority-minority rural communities are facing the long-term impacts of structural racism, such as underdevelopment, they are simultaneously facing the broader rural headwinds of brain drain and paltry to non-existent growth in employment.
Over 50 percent of rural Black residents live in a distressed county compared with just 18 percent of rural whites.
The gaps in rural well-being by race are stark. Over 50 percent of rural Black residents and 45 percent of Native American rural residents live in a distressed county compared with just 18 percent of rural whites. Systemic rural distress in the South is a strong contributing factor to the high number of rural Black residents living in a distressed county.
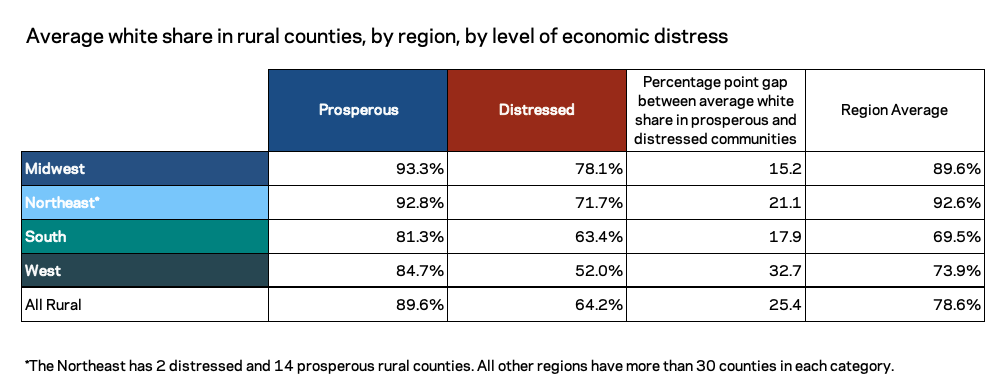
The diversity of rural communities varies widely by region and state, but across all regions, prosperous counties have, on average, a substantially higher share of white residents. The gap between distressed, diverse communities and prosperous, less diverse places is particularly acute in the West, where the average prosperous rural county is nearly 85 percent white while the average distressed county is only 52 percent white.
Concentrations of minority groups can be found all across rural America. In the South, 16.7 of Black Americans live in rural places compared with less than 5 percent in the Midwest, West, and Northeast. In Mississippi, 63.2 percent of Black Mississippians live in a rural county. In the Midwest large shares of states’ Latino population live in rural places, with that share topping 30 percent in Iowa, Kansas, Nebraska, and North and South Dakota. Texas is home to 1.2 million rural Latinos. In total, 46.3 percent of all Native Americans reside in rural areas, with the largest concentrations in Oklahoma and Arizona.
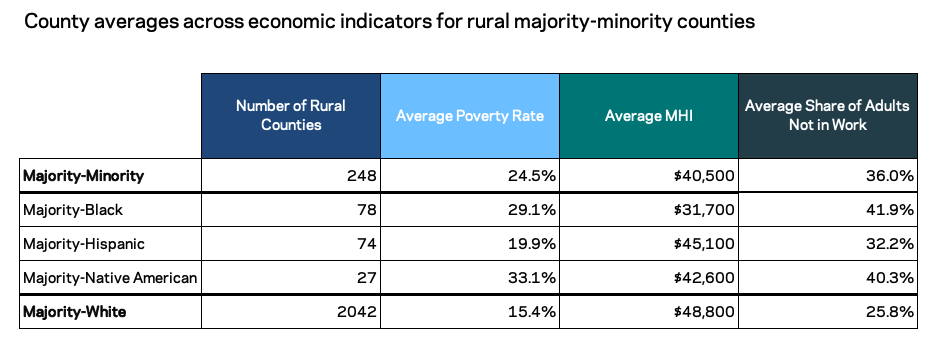
The average poverty rate in rural counties where the majority of residents are non-white is nine points higher than in majority-white rural counties.
One in 10 rural counties (248 counties or 10.8 percent) are majority-minority, the vast majority of which are in the southeast or southwest. The average poverty rate in these majority-minority rural places is 24.5 percent, nine points higher than majority-white rural places. The average median household income in majority-minority rural counties is $40,500, over $8,000 lower than the $48,800 average in majority-white rural counties. The average share of adults not in work is also 10 percent higher in majority-minority rural communities compared to majority-white rural communities.
In addition to elevated poverty rates and higher shares of adults out of work, majority-minority rural areas tend to have far fewer adults with a high school or college diploma than majority-white rural areas. These indicators of heightened economic distress fit into a larger picture of systemic disadvantage: of the 25 counties with the lowest life expectancies in 2014, all were rural and 13 were rural, majority-minority counties. Indeed, majority-minority rural areas have an average life expectancy 1.9 years lower than majority-white rural areas. Structural racism and legacies of inequality can thus act as an additional headwind for many rural places.
Economic orientation
Despite popular conceptions of rural America, only 19.1 percent of rural counties are still considered farm-dependent by the USDA.
Rural America is home to a wide range of industries and types of economies. Despite popular conceptions of rural America, only 19.1 percent of rural counties, home to 6.4 percent of the rural population, are still considered farm-dependent by the USDA, and even in these economies other industries play a critical role in shaping economic outcomes. Recent analysis from the Center for American Progress found that services constitute a significant segment of the rural economy but that the share of employment in services in non-metro counties versus metro counties lags significantly, a stark gap that imposes serious growth limitations in an increasingly service oriented economy. Beyond the service gap commonality, rural economies can take many forms.
A useful way to explore the economic structure of many rural counties is the USDA’s County Typology code system, which classifies all U.S. counties into one of six categories based on their economic orientation: farm-dependent, mining-dependent, manufacturing-dependent, Federal/State government-dependent, recreation-dependent, and non-specialized.5 Recreation dependent rural counties such as Summit County, Utah and Nantucket County, Massachusetts tend to be the best off as a group, with 27.5 percent falling into the top quintile of well-being and only 5.0 percent falling into the bottom. More than a quarter of all prosperous rural counties, 28.1 percent, are recreation counties. Manufacturing-dependent counties tend to be spread more evenly across quintiles of well-being, although they are slightly overrepresented in the top quintile of well-being, with one in five prosperous rural counties considered manufacturing-dependent. Farm-dependent rural counties cluster around the middle tiers of well-being.
By contrast, mining-dependent counties, federal and state government-dependent counties, and non-specialized counties are all overrepresented in the bottom tier of well-being. A large portion of mining-dependent counties (41.5 percent) fall into the bottom quintile of well-being and only 4.0 percent make it into the top. Quite symbolically, in other words, many rural counties with the most natural wealth are among the most economically struggling places in the nation. In many rural communities, extractive industries appear to live up to their name and do little to channel earnings from the ground back into local economic diversification and development. Federal and state government-dependent counties, meanwhile, tend to be among the most isolated, and 40.8 percent fall into the worst off quintile of counties. In these counties, which include places like border outposts, prison towns, and communities near national parks and forests, the public sector is the main economic driver. Over half of the counties in the category are among the most rural places in the country and lack a central town or community, while about half have populations under 20,000.
[icrsl img=”https://eig.org/wp-content/uploads/2021/03/Rural_Carousel1.png, https://eig.org/wp-content/uploads/2021/03/Rural_Carousel2.png, https://eig.org/wp-content/uploads/2021/03/Rural_Carousel3.png”][/icrsl]
The COVID crisis has led to compounding distress in many rural places, with recent USDA analysis finding that mining-dependent communities had higher rates of unemployment in the midst of the crisis while farm-dependent areas fared somewhat better as farm employment showed less of a negative response to the pandemic shock. The USDA analysis also revealed that a subset of counties with high shares of employment in the meatpacking industry have suffered acutely from the virus itself, with infection rates peaking at average levels more than ten times higher than the average for other non-metro counties.
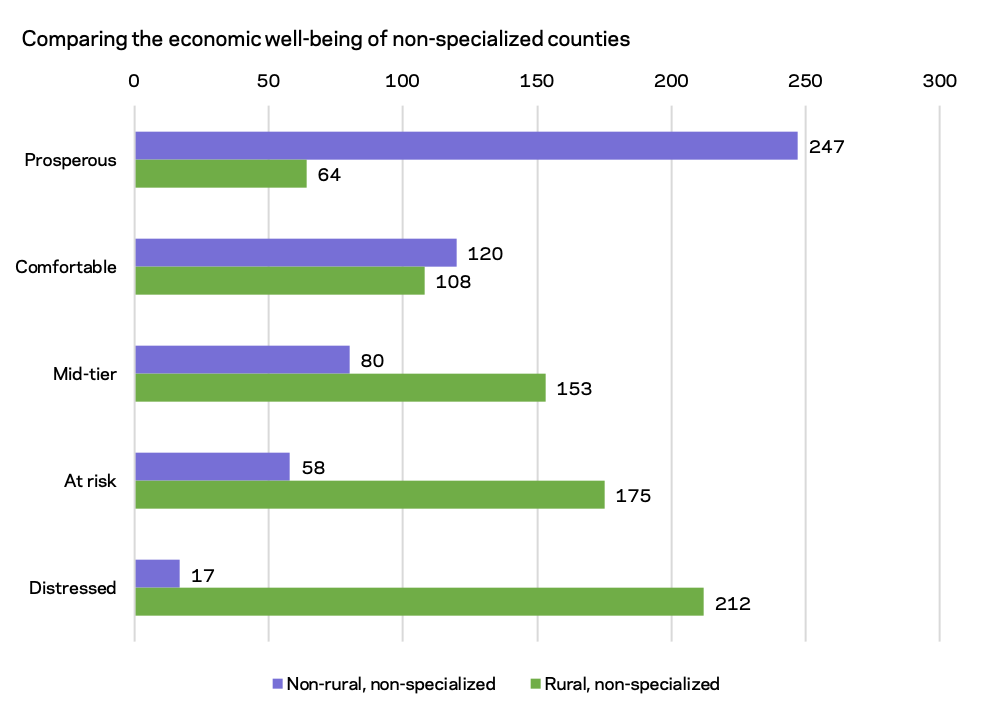
The lack of any clear economic specialization tends to signal diversification in metro areas but underdevelopment in rural ones.
The differences between counties considered non-specialized in rural areas versus those earning the same distinction in non-rural areas is especially interesting. In urban settings, lacking a specialization is traditionally thought of as a sign of economic diversification and prosperity. Indeed, well over half of the non-rural counties in the country are non-specialized on USDA’s measure (522 of 843) and nearly half of those fall into the highest quintile of well-being. In non-rural places, counties are more likely to be non-specialized as economic well-being improves. In rural settings, the reverse is true: the number of non-specialized counties in each quintile gets higher as economic well-being deteriorates. The non-specialized designation is thus likely capturing two distinct phenomena: underdevelopment in rural places and diversification in non-rural places.
Over 70 percent of the most prosperous rural counties are not recreation-dependent, implying that rural prosperity can take many forms.
Recreation counties are some of the most prosperous rural places, but other types of rural economies have found success as well. 184 rural counties that are not recreation dependent fall into the top quintile of economic well-being, meaning that non-recreation dependent counties account for 72 percent of the most prosperous rural places. An additional 347 counties spread across all six categories fall into the second most prosperous quintile. Thus, while a recreation-focused economy seems the most reliable route to success, the data points to what many practitioners already know: there is more than one road to rural prosperity.
Conclusion
Grasping both the general headwinds rural America faces as well as its heterogeneity is an essential first step for policymakers looking to craft policy that will lead the whole of the country into a more vibrant and inclusive economic future. Even as parts of rural America languish, others flourish. Population dynamics, historic and present economic structure, systemic disadvantage, and broad shifts driven by a 21st economy come together to shape rural outcomes. Rather than accept decline or stasis as a natural fate of rural America in the modern economy, federal rural policy must respond to these facts and challenges with bold strategy, creativity, and a new commitment to deliver opportunity for all rural Americans.
Download Rural Continuum Data Set
1 Population estimates based on American Community Survey county population for 2014-2018.
2 Ajilore, Olugbenga, “3 Ways to Improve the Outcomes for African Americans in the Rural South,” Center for American Progress. 2019.
3 Allard, Mary Dorinda and Vernon Brundage Jr., “American Indians and Alaska Natives in the U.S. labor force,” Monthly Labor Review, U.S. Bureau of Labor Statistics, November 2019.
4 Zamarripa, Ryan, “Closing Latino Labor Market Gap Requires Targeted Policies to End Discrimination,” Center for American Progress. 2019.
5 The classifications are made based on employment and income shares for the relevant industry in a given county, with a county classified as the type with the highest share of earnings if it qualified for more than one designation and labeled “non-specialized” if it qualified for none of the other designations. For more, see the USDA typology codes webpage.