By Daniel Newman and Jimmy O’Donnell
The 2020 election made clear that the American electorate is starkly divided between economically vibrant and stagnant places. In this analysis, we examine the political map using three of the most tangible indicators of economic well-being in the counties supporting each candidate: growth in population, growth in employment, and growth in the number of new businesses. On each measure, we find a profound gap between the cohort of counties that voted for President-elect Biden and those carried by President Trump. From 2010 to 2019, the number of people in counties won by Biden grew by an average of 3.1 percent over the period, while the counties won by President Trump averaged an increase of just 0.6 percent. Biden counties also accounted for a remarkable 82.5 percent of new businesses added to the economy and 72.8 percent of employment growth since 2010, underscoring the economic dominance that has accompanied their expanding populations.
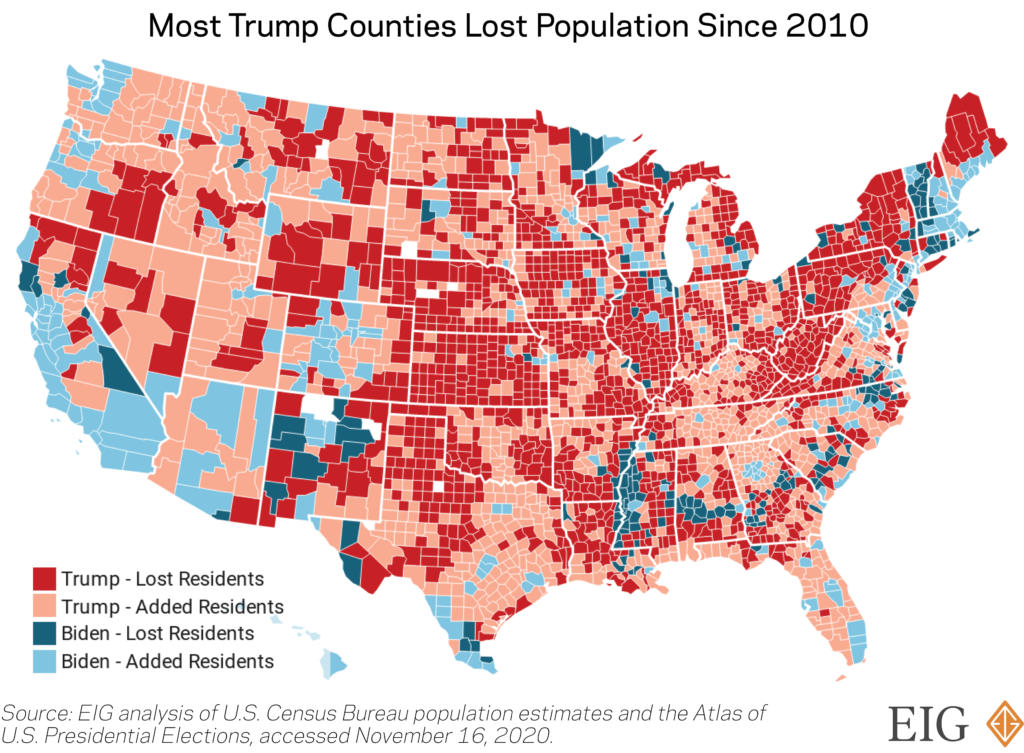
The sluggish growth of red America is due in part to the fact that population has actually declined across a large share of Trump counties since 2010. Even as the typical county’s population increased by a modest 1.0 percent nationwide between the start of the decade and 2019, 57 percent of Trump’s counties lost residents. To be sure, Biden counties are not immune to population loss, but a far smaller share of them—37 percent—shrunk over that time, based on analysis of U.S. Census Bureau figures. The political implications of population growth are evident: In the more than 1,400 counties that gained population, voters split 62 percent to 38 percent in favor of Biden. In the remaining 1,700 counties, Trump won the vote count 58 percent to 42 percent.
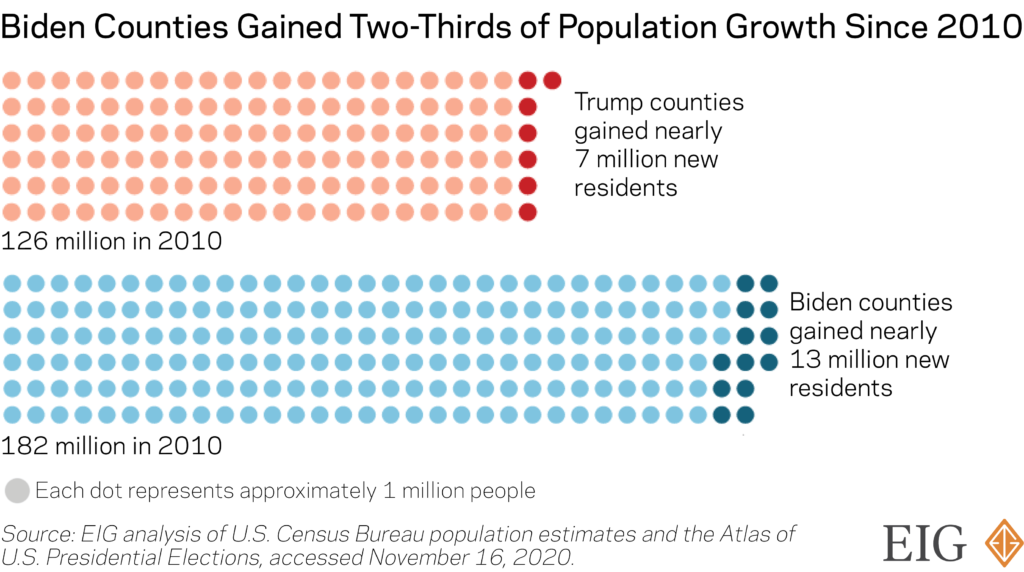
The country overall has added more than 19 million new residents since the start of the decade. Despite only winning one-fifth as many counties as Trump, Biden’s constellation of locales gained about two-thirds of all population growth—over 12.6 million residents. Biden managed to take many of the population centers that generated the greatest number of new residents, such as Maricopa County, AZ (Phoenix), Harris County, TX (Houston), and King County, WA (Seattle).
Population growth is closely intertwined with economic growth and has important implications for economic dynamism—the process of creative destruction that reallocates the economy’s resources across firms, industries, and geography to foster productivity advances, innovation, and ultimately economic opportunity. Research has shown that population growth is a key contributor to new firm formation, which drives a dynamic economy. This correlation between population growth and economic dynamism may also explain the concentration of economic strength in counties that voted for Biden. Recently released data from Brookings noted that Biden counties accounted for 70 percent of GDP in 2018, and those counties are similarly dominant across a range of indicators, including firm creation and employment growth.
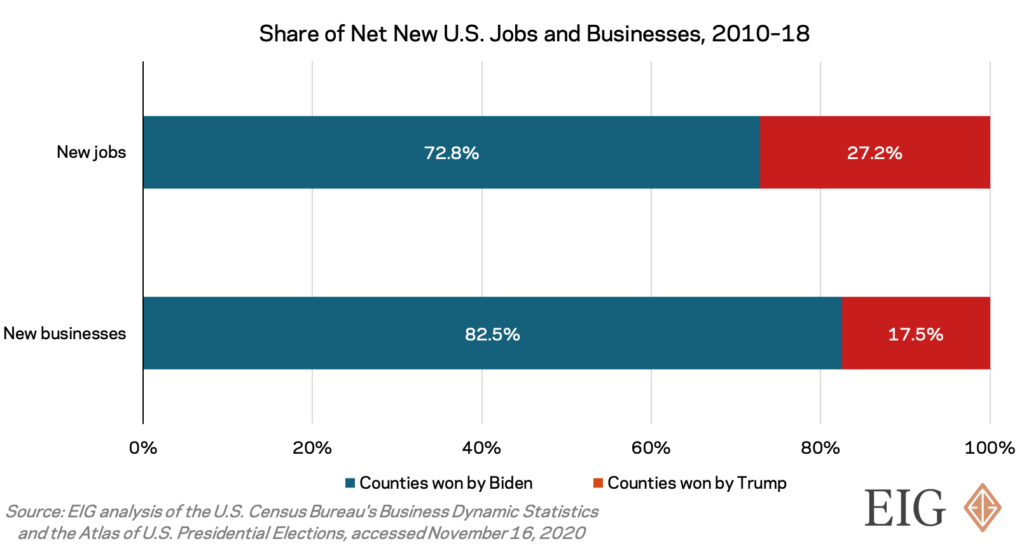
Between 2010 and 2018, the U.S. economy was in the midst of what became its longest period of sustained peacetime growth in history, adding roughly 305,000 net new businesses and 18.2 million net new jobs. Counties won by Biden accounted for an overwhelming 82.5 percent of new firms and 72.8 percent of employment growth, according to data from the U.S. Census Bureau. Importantly, these two phenomena are self-reinforcing: blue America’s new businesses advantage is itself an employment advantage. Research has shown that young start-ups (as opposed to older, established businesses) are the main drivers of job creation in the United States.
These disparities are not merely the result of a few large Biden counties (e.g., Los Angeles County) tipping the scales; rather, they reflect a broader trend across most Biden counties and most Trump counties. For example, 52.6 percent of counties won by Biden experienced net firm growth between 2010 and 2018; yet, only 35.0 percent of Trump counties did. The story reads largely the same when looking at employment figures: 81.9 percent of Biden counties had an increase in employment, while only 67.6 percent of Trump counties saw their employment rise.
Despite the clear differences in economic vitality we find between Trump and Biden counties in general, red and blue America are each a heterogeneous mix of places that run the gamut of economic well-being. Legacy cities, such as Detroit and Baltimore, struggling with industrial transition and years of population loss remain solidly in the Democratic orbit. Meanwhile, Trump won several economically dynamic counties, including Collin County, TX, outside Dallas; Lee County, FL, encompassing Fort Myers; and Utah County, UT, in the suburbs of Salt Lake City.
Nevertheless, the economic chasm that generally divides red and blue strongholds is, in part, a byproduct of the fact that U.S. growth and dynamism have become increasingly concentrated in a relatively small share of places. Aggregate national economic figures tend to obscure a deeply uneven story of regional divergence, one with profound social and political implications—and one of intense bipartisan concern. Indeed, this divergence is one of the great challenges of our time, and one of the most difficult that President-elect Biden will inherit when he takes office in January 2021. Tackling it will require a policy agenda designed to provide the tools and resources necessary to help struggling communities adapt to economic change and thrive in a future full of uncertainty. One such idea is for a place-based “Heartland Visa” for demographically and economically stagnant areas of the country—a proposal Biden endorsed during his campaign. In the wake of a devastating economic crisis that ended a decade-long economic expansion characterized by its “left-behind” places, it will take a host of such policies working in concert to help ensure the next map of recovery looks more inclusive than the last.