


by Adam Ozimek
Key findings
- New county level population growth data reveal that 2021 marked a clear break from past trends, not a continuation of them.
- The patterns of growth are consistent with remote work being an important driver of population loss in dense urban counties. Further, the shrinking gap between urban and suburban home prices suggests a significant portion of this urban exodus is permanent, not driven by temporary pandemic-related factors.
- Factors associated with population loss in more urban counties are high home prices, density, lots of jobs that can be done from home, and a labor market agglomeration.
- Places that saw accelerated population growth included smaller, less urban counties with high concentrations of vacation homes and communities with long commute times, which suggests desirable locations pre-pandemic.
Since the pandemic began, there has been a debate about whether the rapid rise of remote work would affect where people live. Some argued that remote work effects would be mostly temporary and local. Others argued that remote work would have significant effects on where people live and the economic geography of the U.S. and elsewhere. With the release of 2021 U.S. Census Bureau Population Estimates, we are able to see more conclusive evidence about what has happened so far. The results do not paint a picture of a continuation of recent pre-pandemic trends, but rather a significant change in where people are moving and living. While much research remains to be done, the evidence is consistent with remote work beginning to change economic geography.
Expensive places are feeling the biggest impact of post-covid population shifts
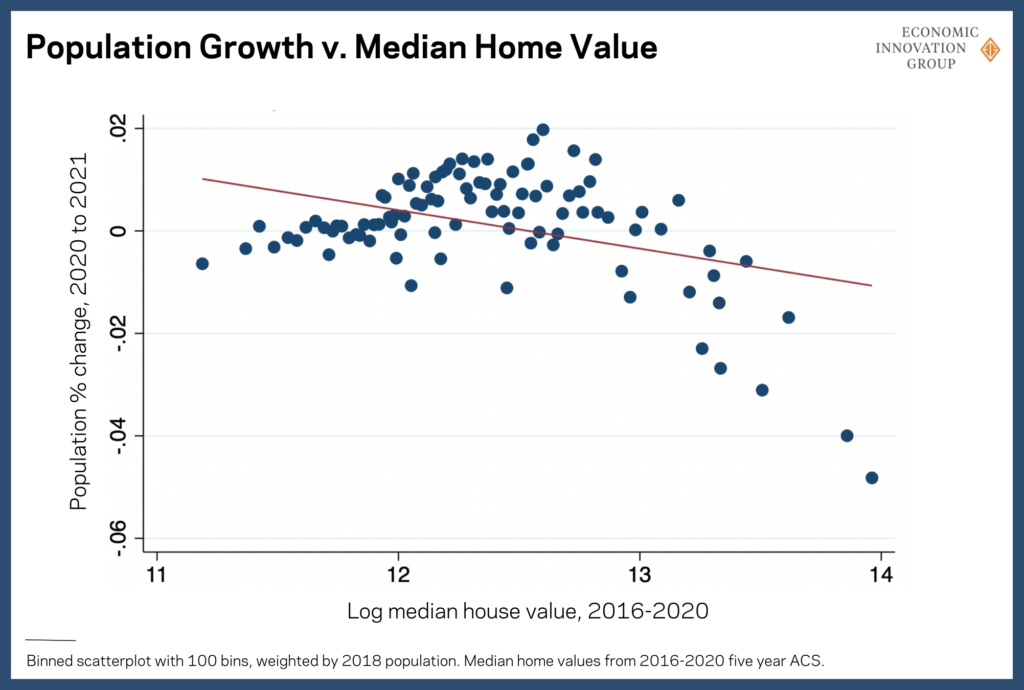
One of the primary theories of remote work’s impact on geography is that it allows workers to move to lower cost-of-living parts of the U.S., effectively increasing real wages. A population-weighted binned scatter plot illustrates that indeed the most expensive housing markets have seen the greatest population loss. It is also not limited to the most expensive handful of counties—there is a clear and increasing relationship between housing prices and population loss within the most expensive tenth of the country, which includes 33 mostly large urban counties.
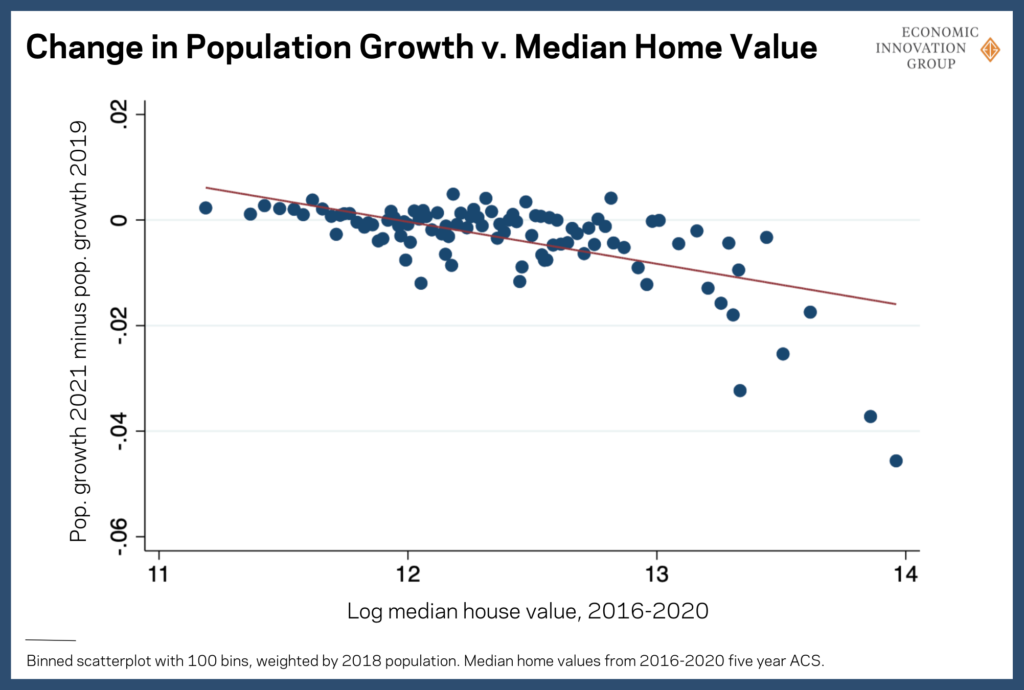
One potential counter-argument is that these remote work moves were just a continuation of pre-COVID trends where population declines were already happening; however, in the same weighted binned scatterplot using the difference between 2021 and 2019 population growth, the relationship is actually even clearer.1 Not only are the most expensive places seeing greater population loss, but the relationship between high cost of living and population growth is clear throughout at least the top half of the price distribution.
In short, post-pandemic trends appear to be driving population growth to less expensive housing markets. If remote workers are able to retain some of their higher incomes that they were previously earning in more expensive labor markets, this is good news for real incomes.
Data shows remote work—not temporary pandemic policies—is a major factor behind people leaving large cities
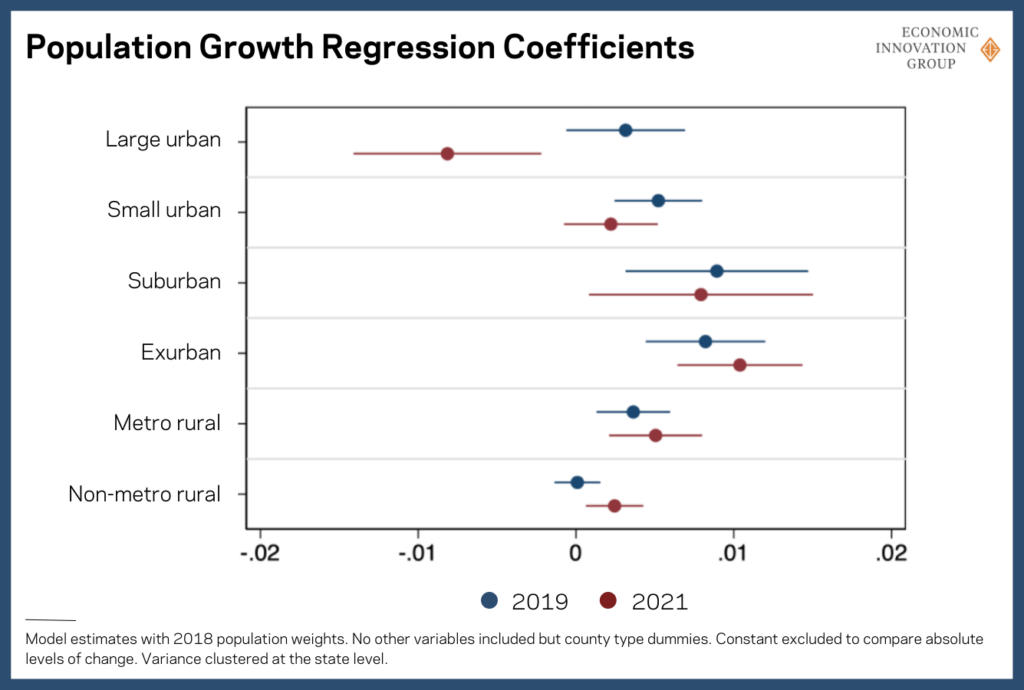
EIG breaks counties out into six different typologies: large urban, small urban, suburban, exurban, metro rural, and non-metro rural. One thing is clear—large urban areas have seen the biggest negative effects on population trends from the pandemic. To illustrate this, we regress population growth on county-type dummy variables alone for 2021 and 2019 to population-weighted changes in growth rates by type with confidence intervals. It is clear that large urban counties have seen the biggest change in population growth rates compared to pre-pandemic trends. The confidence interval for 2021 excludes the entire confidence interval for 2019. Small urban areas declined, suburbs were relatively unchanged, and exurban, metro rural, and non-metro rural increased growth rates.
Not only are different county types experiencing different trajectories post-pandemic, but the factors driving their growth trends are varied. In our analysis, we allow every variable tested to have a different coefficient depending on this county typology, and observe significantly different patterns in not only which places have done better or worse, but also what factors have mattered.
The impact of density illustrates how the factors that matter vary by type of place. For large urban, small urban, and exurban counties, more density was associated with population decline and this relationship was statistically significant. In contrast, density did not matter for other types of counties. Remote work led people to seek out less dense places, but among rural and suburban areas they moved to, relative density played no role. In other words, they moved from high density urban areas to areas that are relatively less dense, but not necessarily the least dense places overall.
The connection between density and large urban population loss is consistent with remote work playing a role, but it is also consistent with the pandemic reducing the value of urban amenities like clubs, bars, and restaurants, mass transit, either due to government-imposed lockdowns or collective fear of the virus. One could argue that this shock, rather than the rise of remote work, drove exits from dense urban areas, implying most would return when the pandemic subsides and the value of urban recreational amenities rebounds. However, there are a few reasons why patterns of population loss are more consistent with remote work effects than simply pandemic-related decline in urban amenities.
First, recent research highlights the shrinking gap between home prices near urban centers and those in their corresponding suburbs. House prices are forward-looking measures, which suggests real estate markets expect a longer-term rise in demand for suburban and exurban housing relative to housing in dense urban downtowns.
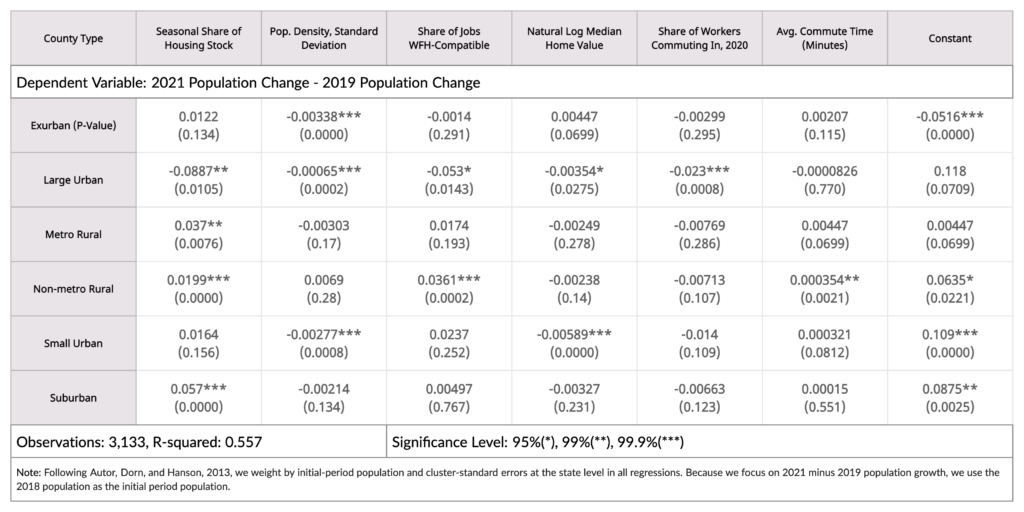
Second, the other factors that regression analysis shows are correlated with weaker population growth, suggesting that it is not density alone that predicts population loss. Consistent with prior research and the binned scatter plots above, expensive housing plays a key role. For large and small urban areas, more expensive housing was related to lower population growth. In contrast, house prices had no effect on other county types.
In addition, the evidence shows that labor markets are an important driver of population trends, which is consistent with remote work being a change driver rather than pandemic-driven amenity loss as a driver. In theory, places where a significant part of the value of living there is access to a large, thick labor market should lose out from remote work. To capture this, we look at the share of out-of-county workers in each labor market. This represents the fraction of those working in each county that reside somewhere else, commuting in for work, as measured by the 2016-2020 American Community Survey. Reliance on more inbound commuters than within-county residents has negatively affected population growth since the pandemic in large urban counties but not elsewhere. This is consistent with remote work reducing the value of big city labor market agglomeration. In other areas, relative access to jobs is not consequential for population growth, as access to jobs was not a major determinant of the value of living in these areas in the first place.
Another clear sign of the impact of remote work on population trends is the relationship between potentially remote jobs pre-pandemic and population decline.2 Having a higher share of jobs that could be done remotely drove population decline for large urban counties, but only for large urban counties. This is consistent with the labor market access and housing cost results: having expensive housing, previously valuable access to labor markets, and a large supply of jobs that can be done remotely predicts population loss in large urban areas – exactly what would be expected if remote work was driving population loss.
These factors are also related to each other and interact. Specifically, previous research suggests that having lots of jobs that can be done remotely will reduce demand for living in a place, but only when that place also has a high cost of living.3 An additional model is consistent with this theory, showing an interaction of log house price and work-from-home share of jobs is significant for large urban areas. High housing costs push individuals to leave large urban areas, and work-from-home jobs give them the ability to do so. Again, these results are highly consistent with remote work being an important driver of geographic moves.
Interpreting interaction coefficients can be complicated, so an example scenario is useful to understand the magnitudes of remote work effects. Take a county with a median home value of $600,000. This is close to the 90th percentile for all counties, or the 75th percentile of large urban counties.4 Moving from the median to the 90th percentile for work-from-home potential jobs, in a county with these high prices this high, would reduce population growth by 0.7 percentage point, a significant reduction in growth when the average population growth for large urban counties in 2021 was -0.4 percent.
Finally, our analysis also found no relationship between Covid deaths and subsequent population loss, further suggesting that the observed phenomenon is not entirely driven by temporary Covid factors. However, this does not rule out some effect due to differences in lockdown or other Covid related policies.
In short, when we look at what is driving population loss, we observe a strong relationship between not just density, but also housing costs, labor market agglomeration, and the share of jobs that can be done remotely. We also observe that work from home is most negative when housing costs are high. While density could be consistent with the loss of urban amenity value during the pandemic as a driver, the other factors are more consistent with remote work.
Some communities stand to gain disproportionately from remote work
Different sets of factors appear to explain growth in areas that saw faster population growth. One theory is that vacation towns have seen significant growth in demand, as remote work allows year-round living in places with desirable amenities but fewer skilled job opportunities. To capture this, we measured the share of housing units that are seasonal, either for recreational purposes or to house seasonal workers, using 2016-2020 American Community Survey (ACS) data. Examples of this type of housing include beach houses, winter or ski cabins, or temporary housing for seasonal workers. A greater share of this type of housing predicts population growth in non-metro rural, metro rural, and suburban only. For large urban counties, more vacation homes predict population loss, and for other counties, their effect was insignificant.
Long commutes also predict population growth in non-metro rural areas. Before the pandemic, rural areas with long commute times suggested a county is desirable enough that people were willing to bear the cost of long commutes to access larger labor markets. Growth in these places likely reflects that with hybrid remote work, even rural counties outside of a metro area become more desirable as long commutes become less frequent. Thus rural areas with a good mix of amenities and low cost of living, even if far from a metro’s downtown, stand to benefit from the spread of remote and hybrid work arrangements.
Conclusion
Is this time really different, or are the current trends just spurious regressions? As a falsification test, the regression model was run using 2019 population growth minus 2017 population growth and all the same explanatory variables. Almost none of the previously significant relationships remained significant. And among the few that did, most switched signs. For example, density was still significant for large urban areas, but it predicted more population growth, not less, and vacation homes in non-metro rural areas were significant but negative. Yes, this does represent a break from past population growth trends.
On the whole it is clear that people are moving from more expensive places to less expensive places, which was true before the shock of COVID, but accelerated post-pandemic and became a clearer broad trend.
Digging in deeper, we can see that what drove population growth in 2021 varied significantly by type of place. Large urban areas and to a lesser extent small urban areas faced pressure from remote work and other pandemic trends. Counties facing the biggest pressures were those with both high levels of jobs that could be done remotely and high costs of living. This is what research from earlier in the pandemic predicted would happen as a result of remote work. Places that lots of workers used to commute into, a key indicator of people willing to endure costs to access a big, dense labor market, also suffered.
On the other side of the ledger, lower-cost places in general saw relatively more positive population trends. Factors associated with stronger performance were, for non-metro rural areas, the presence of long-distance commuters pre-pandemic, in addition to the presence of vacation houses. This suggests benefits to being in the long shadow of a big city and having desirable local amenities.
While this exploratory work helps set the stage for a discussion on the future of remote work, there is much more research to be done. The spatial modeling of the effects of remote work on economic geography are just beginning to develop and population growth data will continue to be an important input. In future analysis, EIG intends to explore the broader implications of remote work on economic geography, including the effects on real incomes and lower-wage workers.
—
Appendix: County definition methodology
Large urban counties intersect with an urban area with a population of 250,000 or higher. If multiple counties intersect the same urban area, the county with the highest population density was selected. Small urban counties intersect an urban area with a population of 100,000-250,000. If multiple counties intersect the same urban area, the county with the highest population share in a midsize city based on NCES definitions, is classified as small urban and the other counties as suburban. Suburban counties have an urban area with a population of 50,000 to 100,000. At least 25 percent of the population must be in a large or medium-sized suburb, based on National Center for Education Statistics (NCES) definitions, otherwise it is classified as exurban. If no population at all is in a large or medium-sized suburb, then it’s classified as rural. Exurban areas have a population smaller than 50,000, at least 25 percent of their population in a large or medium-sized suburb and must be in a metro with a population of 500,000 or higher. All remaining metropolitan counties are classified as metro rural and all non-metropolitan counties are classified as non-metro rural.
Notes:
1 We compare to 2019 population growth and not 2020 because the 2020 growth is potentially already affected by pandemic effects.
2 Data from Jed Kolko, following the coding of Dingel and Neiman.
3 See for example, Ozimek, 2020 “Remote workers on the move” and Ozimek, 2021 “The new geography of remote work” on cost of living as an important driver of work from home geographic effects, in particular interacted with work from home. Bruenker, Khan, and Lin, in “A new spatial hedonic equilibrium in the emerging work-from-home-economy?” argue for focusing on the interaction of high productivity growth and work-from-home potential. For within city analysis, see Delventhal, Kwonb, and Parkhomenko”: How do cities change when we work from home?”
4 All stats in this paragraph are on a population-weighted basis.