Introduction
Earlier this week, the Government Accountability Office (GAO) issued its second report on Opportunity Zones (OZs), thereby concluding the study of the tax incentive requested by Congress in 2019.
GAO’s first report on OZs was publicly released in November 2020 and focused on the need for Congress to grant the U.S. Department of the Treasury additional authority to collect data on the tax incentive and report on its performance. The new report examines a wider array of topics related to the policy’s implementation. In the process, GAO affirms much of what was already known (though perhaps not widely recognized) about the incentive, sheds new light on the scale of OZ-related activity nationwide, and underscores that Congress still has work to do to ensure the incentive is subject to proper oversight and evaluation.
The GAO report includes the following five noteworthy findings:
- The OZ incentive supported at least $29 billion in new equity investment throughout the country through 2019.
- The 2018 designation process clearly succeeded in targeting high-need communities nationwide.
- States overwhelmingly have a positive or “wait and see” view of the policy, with positive responses outnumbering outright negative by a 20 to 1 margin.
- Firms surveyed indicate that, for the most part, the OZ incentive is driving investment that would not have otherwise occurred within targeted communities.
- The IRS needs to step up its efforts to evaluate and address potential compliance challenges.
Below we examine each of these five findings in detail.
Unpacking GAO’s Findings
1. The OZ incentive has supported at least $29 billion in new equity investment throughout the country through 2019.
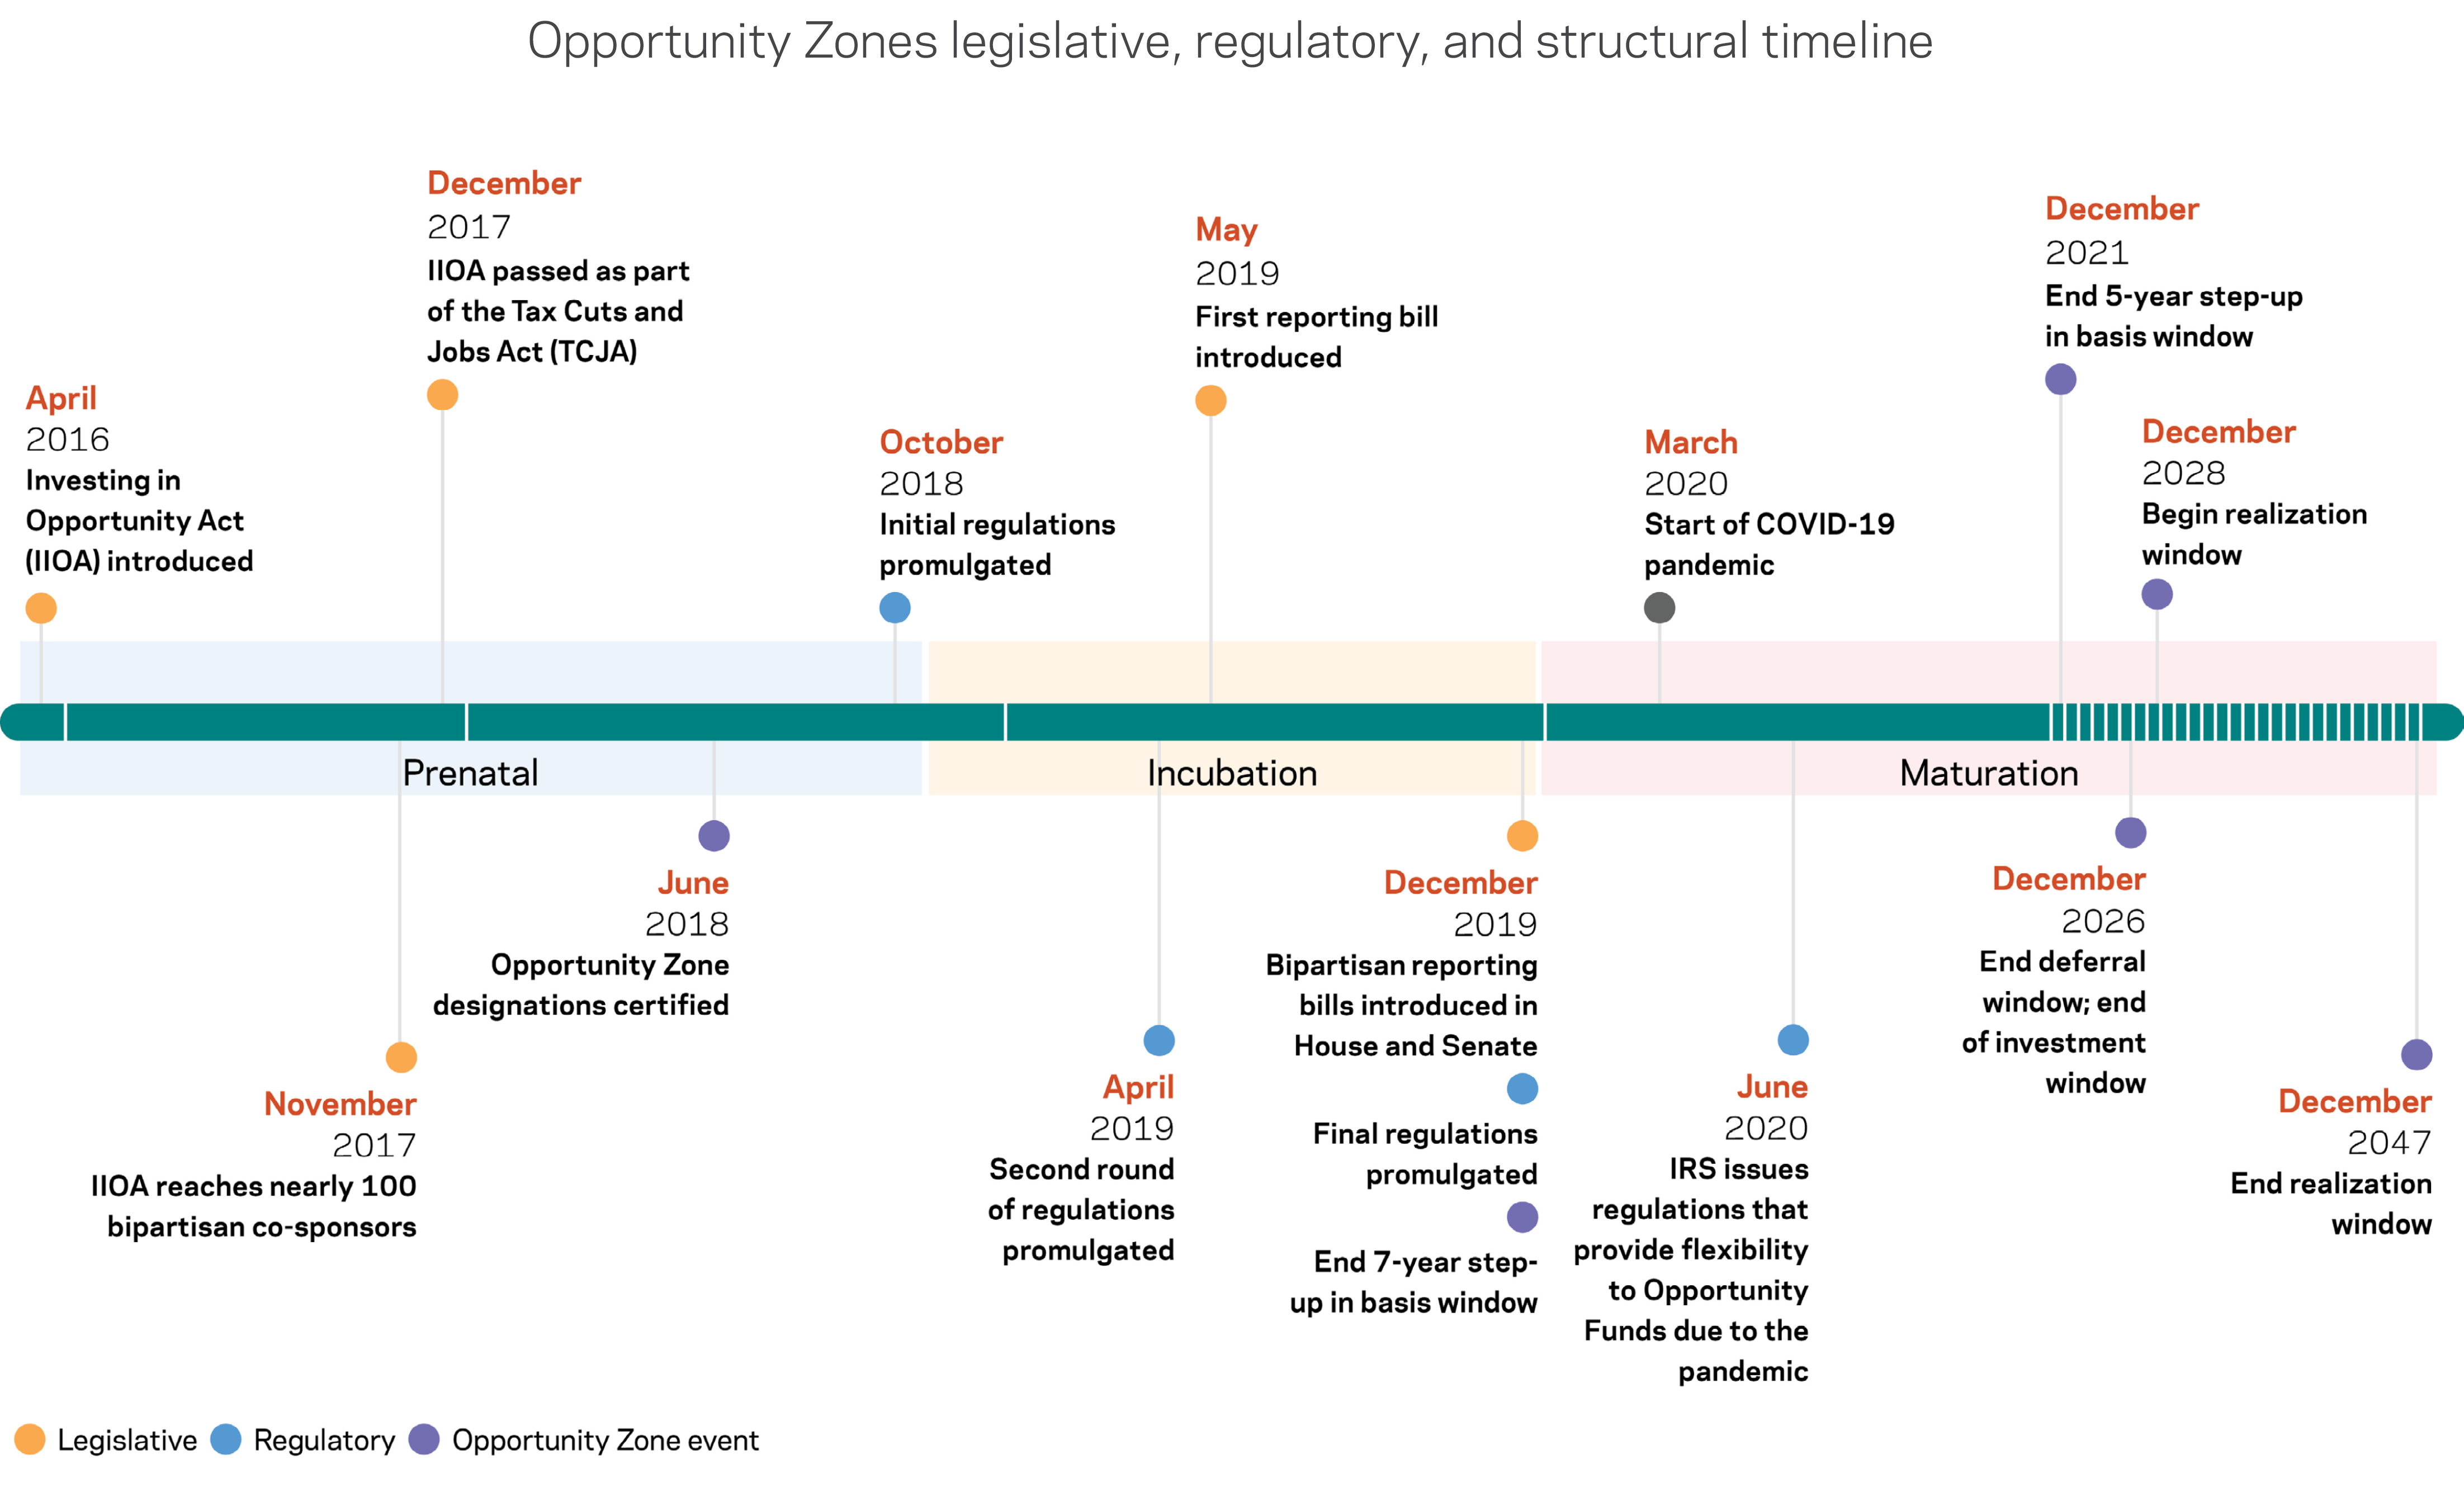
The GAO report finds that the OZ incentives directly moved more than $29 billion of equity capital into Opportunity Funds to invest in qualifying communities through 2019. This number is noteworthy for several reasons. First, it is significantly higher than previous estimates, including the $18.9 billion reported over the same period in a widely-cited April 2021 working paper. GAO concedes that the true number is even higher, given that they were unable to obtain all relevant tax filings. (And note that the leverage ratio of the $29 billion is again far higher, since OZ equity represents only a portion of the financing going into a real estate development or new business enterprise). Furthermore, the timing of the study window is significant: the OZ policy was in its infancy in 2019. Final regulations were not promulgated until December of that year, keeping many investors on the sidelines. Private estimates suggest the size of the market has grown by a factor of three or more since then. Investment into non-real estate operating businesses was extremely difficult during the GAO study window, without the certainty provided by a fully fledged regulatory regime.
In terms of participation, the GAO report was able to identify 6,845 registration forms for Opportunity Funds (IRS Form 8996) filed in 2019. This is nearly 2.5-times the best available prior estimate, suggesting much wider participation than previously reported. In addition, they tally nearly 18,000 individual OZ investors (defined as taxpayers who file Form 8997 to report their investment into an Opportunity Fund).
Finally, the figures make clear that OZs now occupy a prominent position in the federal policy toolkit dedicated to attracting investment capital into historically disinvested and economically disadvantaged communities. In 2019, $3.6 billion worth of tax credits were allocated through the New Markets Tax Credit program, one of the federal government’s signature community development initiatives. Those tax credits went to projects and businesses in approximately 400 census tracts. The earlier working paper found that the $18.9 billion pot of OZ capital it analyzed had reached more than three times as many census tracts. Thus, while it is hard to directly compare the programs given their different structures (the cost of the OZ incentives to the taxpayer will be only a fraction of the $29 billion, determined by foregone taxes on that sum and future earnings, for example), it is clear that OZs compare favorably in scale and geographic distribution when measured against peer policies.
2. The 2018 designation process clearly succeeded in targeting high-need communities nationwide.
The GAO report confirms that the census tracts chosen for OZ designation are generally well-targeted, have lower incomes than other eligible but not selected tracts, and represent places with higher shares of minority residents. On a wide range of measures of socioeconomic well-being, OZs are disadvantaged relative to the country and oftentimes even other high-poverty communities. Using the latest available data, the GAO study reports the following:
- The median household income (MHI) in the average OZ is $38,600, compared to $66,500 nationally.
- The average poverty rate in OZs is 25 percent, nearly double the national average of 13 percent.
- The share of OZ residents whose highest level of educational attainment is high school or lower stands at 53 percent, compared to 39 percent nationally.
Not only that, but prior EIG analysis affirms that OZs cover some of the most deeply distressed corners of the country:
- Even though OZs only cover one-quarter of the country’s low-income census tracts, they cover 48 percent of all U.S. census tracts that have been persistently poor (with a poverty rate of at least 30 percent) since at least 1980.
- OZs also cover 54 percent of the country’s pockets of concentrated persistent poverty, meaning census tracts in which at least 40 percent of the population has lived in poverty since at least 1980.
What is more, the GAO report finds that across every state, the average OZ has a significantly lower median household income than the average low-income census tract that was eligible but governors bypassed for selection. While the GAO report did not examine the characteristics of census tracts receiving investment, the earlier working paper did. The authors found that OZ tracts receiving investment in 2019 were in the top quartile nationally in terms of poverty and the bottom quartile in income.
3. States overwhelmingly have a positive or “wait and see” view of the policy, with positive responses outnumbering outright negative by a 20 to 1 margin.
Ultimately, 20 states reported to GAO that OZs have had a positive impact on their communities. Twenty states were still unsure about the local impact, which is to be expected at this early stage of the policy—especially given the lack of comprehensive data collection and reporting on the incentive. Just one claimed the policy was a net negative for the state (and provided no further information as to why). States that were positively disposed mentioned that OZs have either catalyzed new investments or accelerated planned ones; four explicitly took on the counterfactual and mentioned that the incentive yielded investments that would not have otherwise taken root. Other states mentioned that OZs provided a positive jolt to their community development ecosystems.
States are mostly satisfied with their OZ selections, but a large share would make changes to at least a small portion of their designations. When asked whether they would make any changes to their OZs if given the option, 46 percent said yes (26 states out of a total of 56 [including territories]), while 20 were unsure. More than two-thirds of states that expressed a desire to alter their designations affirmed that such changes would affect under one-quarter of their zones. Thus, in hindsight, many states would make modest changes to the OZ map if they could. Congress should keep this in mind if it decides to sunset the handful of outlier high-income zones that made it through the selection process, and consider allowing states to replace them with higher-need communities.
GAO notes that many states have proceeded to offer their own additional incentives to encourage OZ investment or conducted a range of activities to try to support and attract investment into their OZs. Many states that have been the most proactive in aligning state policies with OZs report knowing more about investment activity than their peers, with Colorado, Maryland, and New Jersey among those reporting the highest volume of known investment activity (see Appendix IV). The clear leader on that front is Ohio, whose complementary OZ income tax credit program and associated transparency requirements give it unrivaled insight into its OZ projects. (EIG conducted a detailed analysis of activity in Ohio earlier this year).
4. Firms surveyed indicate that, for the most part, the OZ incentive is driving investment that would not have otherwise occurred within targeted communities.
The GAO report tries to get at the question of whether investments taking advantage of the OZ tax benefits would have gone forward anyway. Through interviews, 10 out of 18 Opportunity Funds reported to GAO that “they would not have invested in their projects without the incentive.” Another two said the statement applied to at least some of their investments. In these cases, the OZ incentive was the pivotal factor in allowing investments to move forward. On the flip side, four out of 18 funds interviewed reported that their OZ investments would have gone forward regardless, and that in such cases the OZ incentives made “a good deal, better.” Some of those same respondents did say that the incentive affected how long they would hold their investment or how quickly it advanced, however.
What do those responses suggest about the efficacy of the policy? All policy made through tax expenditures operates by rewarding desired behavior, some of which would have happened regardless. A policy’s merits lie in the delta — in how much more of the desired behavior it elicited. Some Americans would naturally save for retirement, for example, yet the federal government subsidizes retirement saving with $276 billion in tax expenditures annually because saving for retirement is a “good” thing that policymakers want to encourage. Similarly, some American companies would invest in R&D without the R&D tax credit, and some Americans would purchase electric vehicles without subsidies. Likewise, the Opportunity Zones incentive reflects a clear and bipartisan desire for the tax code to reward investing in distressed communities as a “good” thing.
So how many Americans would invest in historically disinvested, high-risk, and low-return neighborhoods absent a financial incentive to do so? Some, to be sure. But there is also evidence that OZs have unlocked a great deal more investment capital than might have otherwise been expected. A 2020 report from the Council of Economic Advisers estimates that 70 percent of investment into OZs in 2019 was induced by the incentive. It also finds that the incentive yielded 29 percent more equity investment into targeted communities than in comparable non-selected tracts.
In general, OZs have positively impacted investor behavior in a few ways:
- The policy has brought new investors into the fold. With them comes capital that used to be invested in equities or other assets and is now being repurposed for investing into housing, businesses, or other assets in low-income communities — as in Brookville, Indiana, where a local couple sold a company they built and reinvested the proceeds into a range of investments in their small rural community.
- The OZ incentives have dramatically accelerated other projects, bringing needed housing to market faster, for example. It has also closed financing gaps on projects that had been trying to get off the ground for years, like the Yard 56 mixed-use project in Baltimore’s Bayview neighborhood.
- Elsewhere, the incentives have allowed developers to offer greater shares of planned units at more affordable rates, such as with The Tappan project in Cleveland, OH.
- In some cases, it probably redirected investment from one community to another, bringing that capital, foot traffic, and economic activity to an Opportunity Zone instead of the exurban fringe or a different neighborhood; in others, it may have offered a subsidy for one project that allowed another to move forward more quickly.
Thus, while some of the OZ tax benefits have followed the course of all tax expenditures and gone to projects that would have occurred even without the incentive, much appears to have gone to new investments or accelerated the timeline and feasibility of other projects in the development pipeline, providing a valuable boost in the oftentimes sluggish economic development process. The “but for” question is one that must continue to be closely evaluated as the policy matures and more data on the performance of the incentive become available over time.
5. The IRS needs to step up its efforts to evaluate and address potential compliance challenges.
The GAO report concludes with two recommendations to Congress and Treasury to assess the risk of data limitations as well as compliance risks from high-net worth individuals and large corporations, and take necessary steps to address those concerns. Data collection and transparency is critical to the implementation of the policy. The report reveals that states are often in the dark about the scale and nature of investments taking place in their jurisdictions; for example, many states cited a lack of data as to why they were unsure of the impacts of the COVID-19 pandemic on OZ investment activity. This underscores the need for reporting and the availability of data (aggregated in a way that protects personal and competitive information) to policymakers and the public to understand and assess the policy’s performance over time. Furthermore, the report sheds new light on the scale of Opportunity Zones: nearly 18,000 investors and more than 6,000 Opportunity Funds deploying roughly $29 billion to designated communities. OZs are clearly of a size that demands data and transparency. Congress should heed GAO’s recommendations to provide the IRS with ample resources to thoroughly monitor the compliance of investors and funds, and establish robust reporting requirements for the policy.
Other Key Findings
The report offers additional findings on an array of pertinent topics related to how the policy is evolving in a post-COVID landscape.
- Investor Challenges: The survey of QOFs elicited insights into the challenges investors and fund managers have faced in their use of the incentive. Common challenges included a lack of initial IRS guidance, getting investors comfortable with the model, COVID-19 disruptions, and overall compliance, particularly with the strict timing requirements for investing and deploying capital and substantially improving qualifying property.
- State Challenges: The states and territories surveyed pointed out a few challenges with the policy’s implementation as well, namely facilitating or attracting investment into rural areas and non-real estate businesses. While there is anecdotal evidence that the market is diversifying as stakeholders become familiar with the incentive, the policy’s ultimate impact can only be strengthened if the range of use cases and communities reached expands further. State officials also reported the incentive’s complexity made it difficult to educate market stakeholders and community leaders on how to use the incentive to advance community objectives, and suggested additional training or support for training for investors, accountants, and community leaders.
- Impact of COVID-19 on the Market: Some states reported delayed or diminished investment activity as a result of the COVID-19 pandemic, though the majority of state survey respondents indicated they didn’t have enough information to determine the overall impact of the pandemic on the OZ market. Many of the funds surveyed relayed that the pandemic resulted in project delays, in part because of increased cost of supplies and materials, and labor shutdowns.
Next Steps for Policymakers
The GAO report affirms much of what has been clear about Opportunity Zones for some time, such as the diversity of investment activity and the generally well-targeted community designation process. It also sheds new light on a number of important topics, such as how the nascent OZ marketplace has been impacted by the pandemic, the manner in which some of the incentive’s strict requirements may be hindering the very activity policymakers intended to foster, and the actions and outlook of state governments regarding the policy.
Perhaps most eye-catching is GAO’s estimate of at least $29 billion in new OZ equity investment through 2019 alone — a significant jump over most previous estimates. While quantity alone doesn’t tell the full story, it provides important evidence that the unconventional OZ incentive model generated a meaningful response among investors in spite of the prevailing regulatory complexity and uncertainty that characterized the period evaluated by GAO.
To get beyond raw quantitative or anecdote-driven analysis, however, Congress must direct the Treasury Department to collect and analyze the kinds of data necessary for a deeper qualitative evaluation of the performance of the incentive over time. EIG, along with dozens of other stakeholders, has called for establishing such a comprehensive OZ reporting framework, and Senator Tim Scott (R-SC) has introduced bipartisan legislation, the IMPACT Act, that would make it a reality.
And that’s not all. While the early performance of the OZ incentive is promising, it has also revealed several clear areas in need of attention from lawmakers and regulators alike. For example, while the designation process generally targeted high-need places, it also allowed a small share of relatively well-off areas to make the final cut. Congress should sunset those zones and allow states to replace them with more deserving ones. Policymakers should also pursue common-sense steps like making the OZ regulations more accommodating to affordable housing investment, enabling greater investment in non-real estate operating businesses, and making it easier for small, community-focused funds to raise OZ capital. And, as the country works to rebuild in the wake of the pandemic crisis, Congress would be wise to pass a one-time extension of the timeline for making new OZ investments in order to induce stronger participation from would-be investors. Taken together, these reforms would significantly improve the policy and lead to better outcomes for high-need communities.
Click here to see EIG’s full list of recommendations for strengthening the Opportunity Zones policy.