By Daniel Newman and Kenan Fikri
This first-of-its-kind analysis of administrative data from the state of Ohio examines Opportunity Zone (OZ) projects also participating in the Ohio Opportunity Zones Tax Credit Program. Ohio’s high-road approach to embracing OZs brought transparency to the local market and garnered significant amounts of investment into the core of its legacy cities.
- At minimum, 22.5 percent of Ohio’s OZs have received investments taking advantage of both the federal and state incentives.
- Together, the two incentives have moved at least $453.4 million in OZ equity capital over the course of the state’s 2020 and 2021 budget years thus far.
- The average OZ receiving investment had a 35 percent poverty rate and a more diverse population than the state as a whole.
- Ninety-two percent of funding but only 62 percent of projects were concentrated in the three largest counties in the state.
- In total, over 350 entities invested in at least 215 distinct developments or businesses across 72 census tracts and 18 counties, with the median investor contributing $201,460.
Overview of the state credit
Ohio embraced OZs early on to become one of the first states in the country to pair a complementary tax credit with the federal incentive to encourage Ohio-based investors to invest locally. In order to benefit, an Ohio taxpayer must invest in an Ohio-based Opportunity Fund which in turn must direct that money to a qualifying project or business in any of the state’s 320 OZs. In exchange, the state provides qualifying investors with a nonrefundable tax credit equal to 10 percent of the total funds that were invested up to $1 million.
For its 2020 and 2021 budget years, the Buckeye State offered a combined total of $50 million in credits available to investors. Notably, investors must apply and qualify for the state tax credit, so the figures in this analysis represent only a portion of total investments into Ohio’s OZs; the unknown number of OZ investments from out of state investors or those who simply chose not to apply for the credit are not captured in this analysis.
Between the tax credit program’s start and when we obtained the data from the Ohio Development Services Agency in early 2021, investors claimed the state credit on OZ investments totaling $453.4 million. Thanks to the reporting requirements associated with the state credits, it is possible to take an in-depth look at the characteristics of the hundreds of individual OZ investments that participated in the credit program. Since reporting requirements are still missing for OZ investments nationally, Ohio’s data provides an unprecedentedly fine-grained view of exactly where activities are being financed with OZ capital in a crucial proving ground for the new federal policy.
The landscape of OZ investment in Ohio
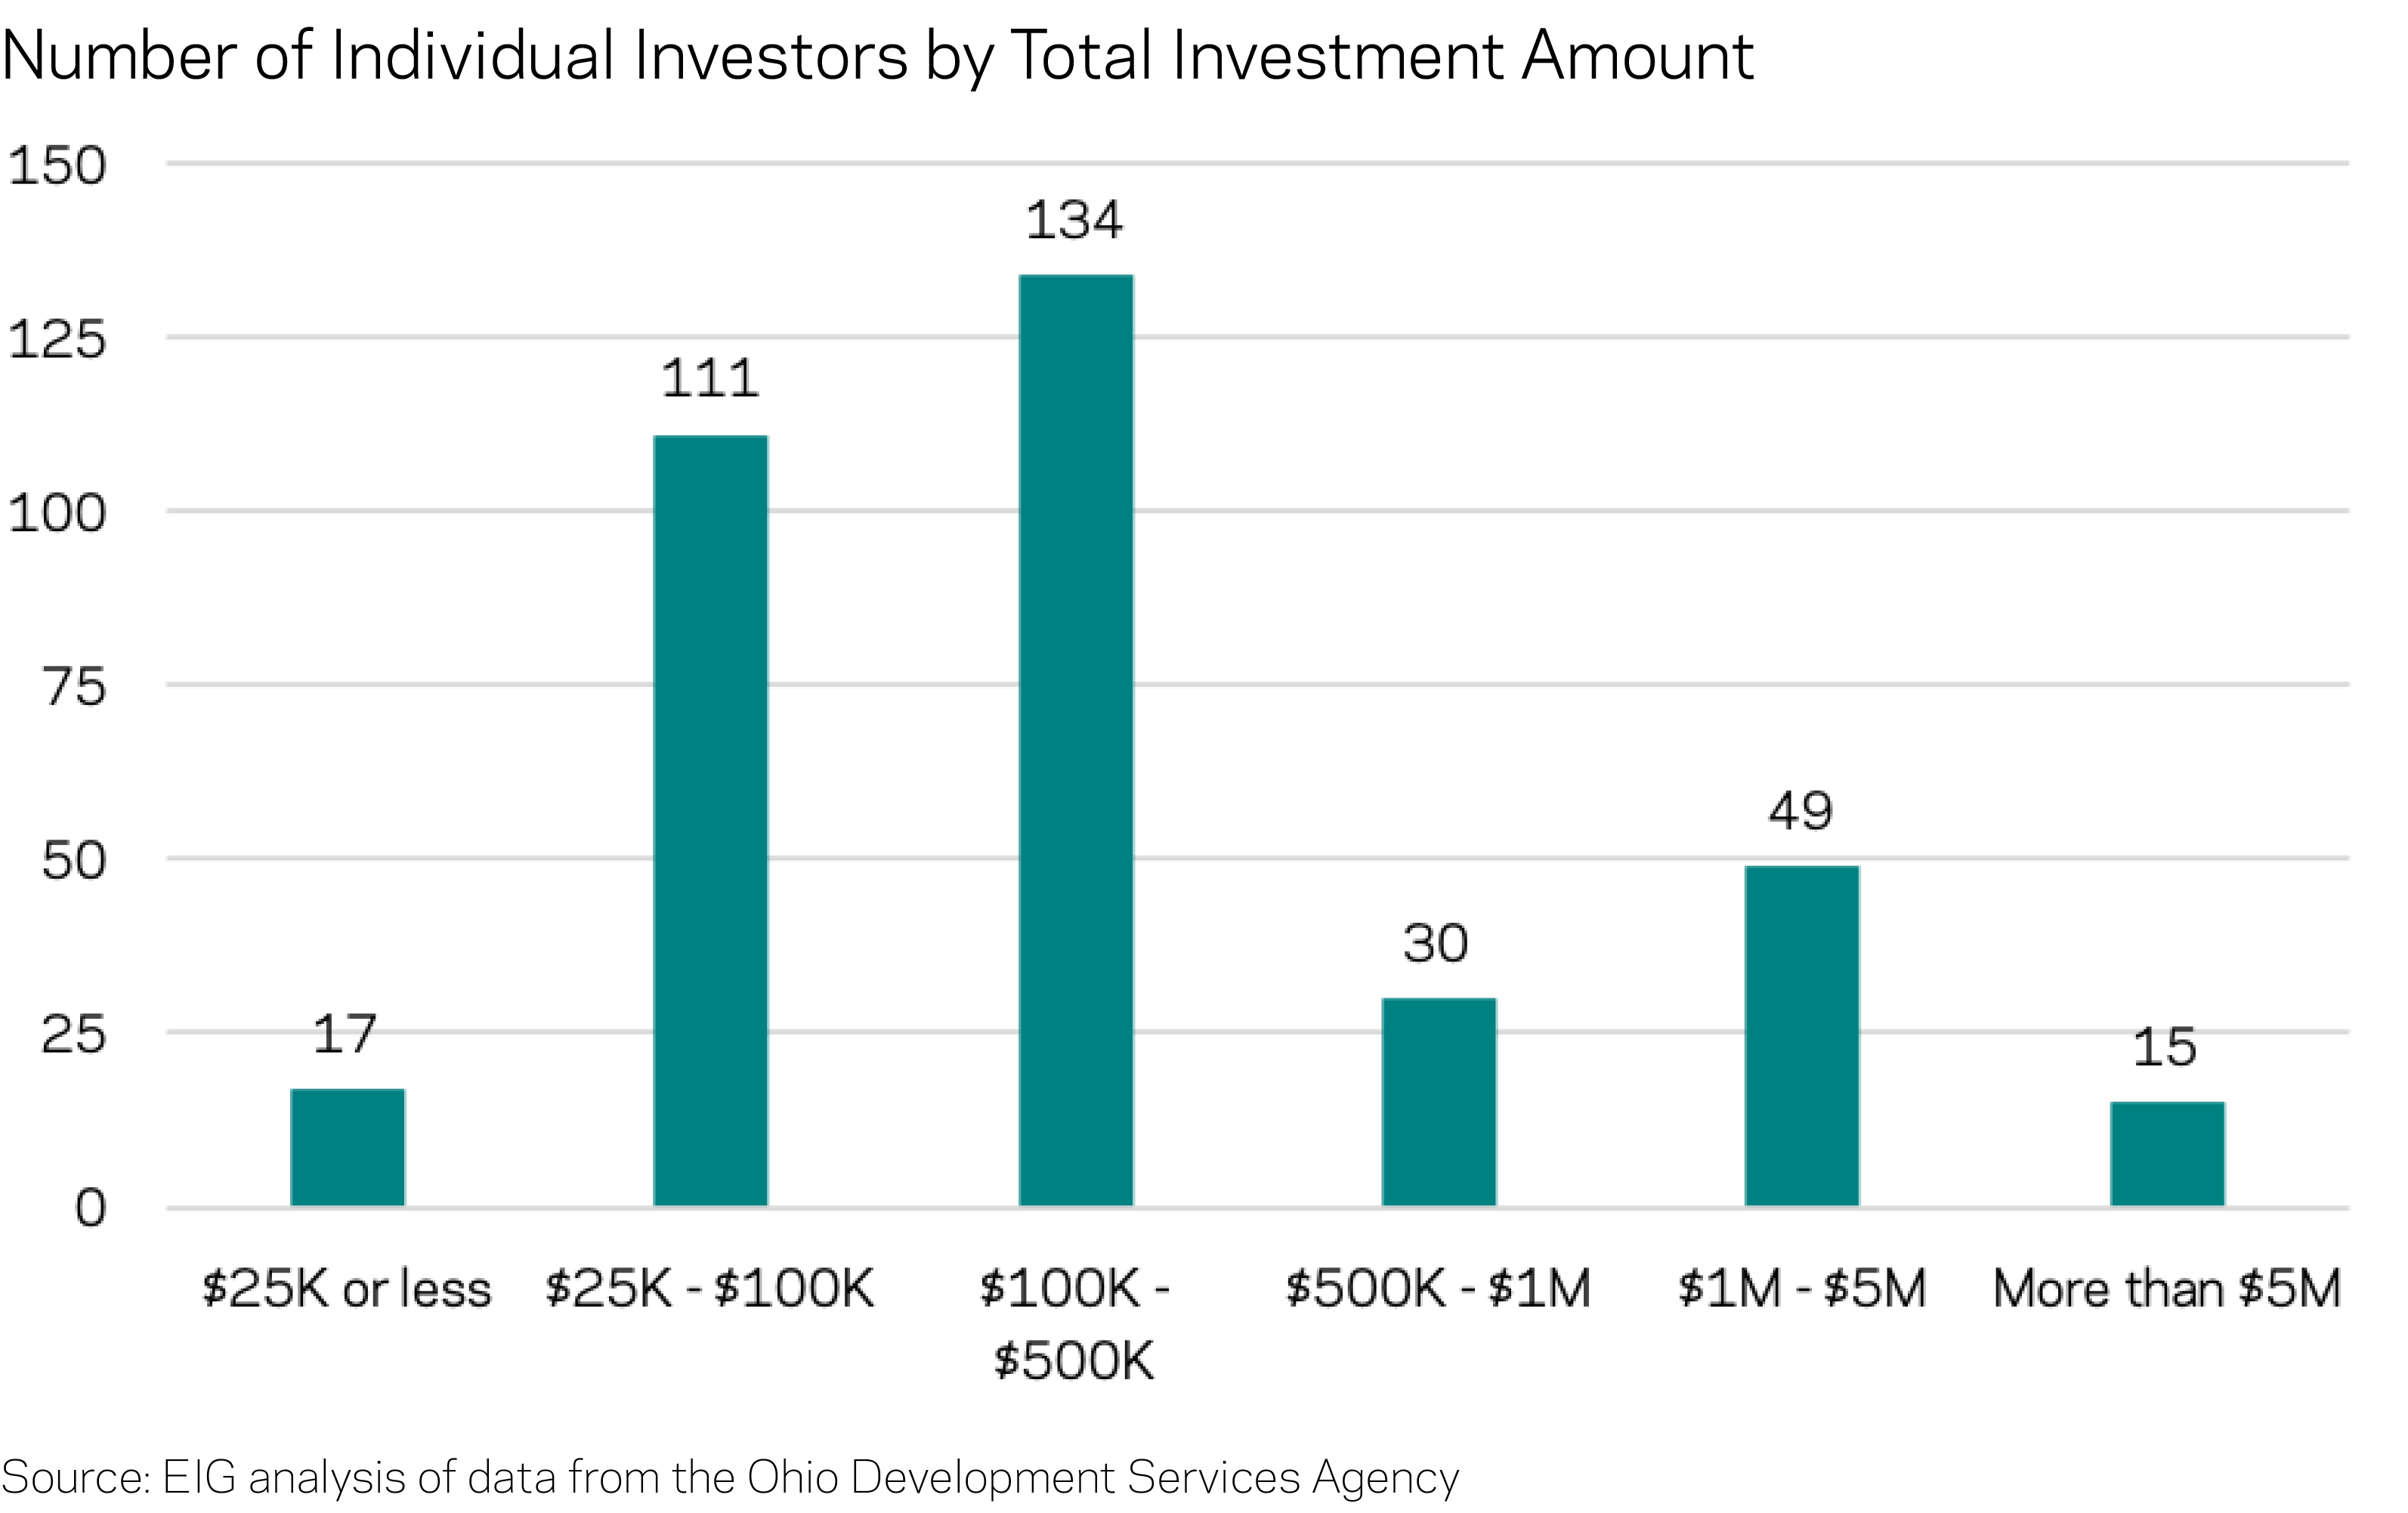
Thus far, at least 72 OZs have received investments utilizing both incentives, 22.5 percent of the state’s designated census tracts. The state tax credit has been applied toward at least 215 different project sites (based on unique project addresses in the dataset), and many investors have infused relatively modest sums into the state’s Opportunity Funds. All together, 356 distinct parties claimed the state tax credit to date with the median investor contributing $201,460. In a sign that market participation did not require very high levels of capital commitment, there were a greater number of investors contributing $25,000 or less than there were investing $5 million and above.
Since some OZ investors either did not qualify for or chose not to utilize the state incentive, these figures provide a lower-bound estimate for OZ activity in the state. While the nature of some projects is evident based on the associated address, the available data leaves it generally unclear whether investments were made into real estate projects or operating businesses. Most reported investments nationwide have gone toward real estate in OZs’ first few years, and the Ohio data seems to follow that pattern.
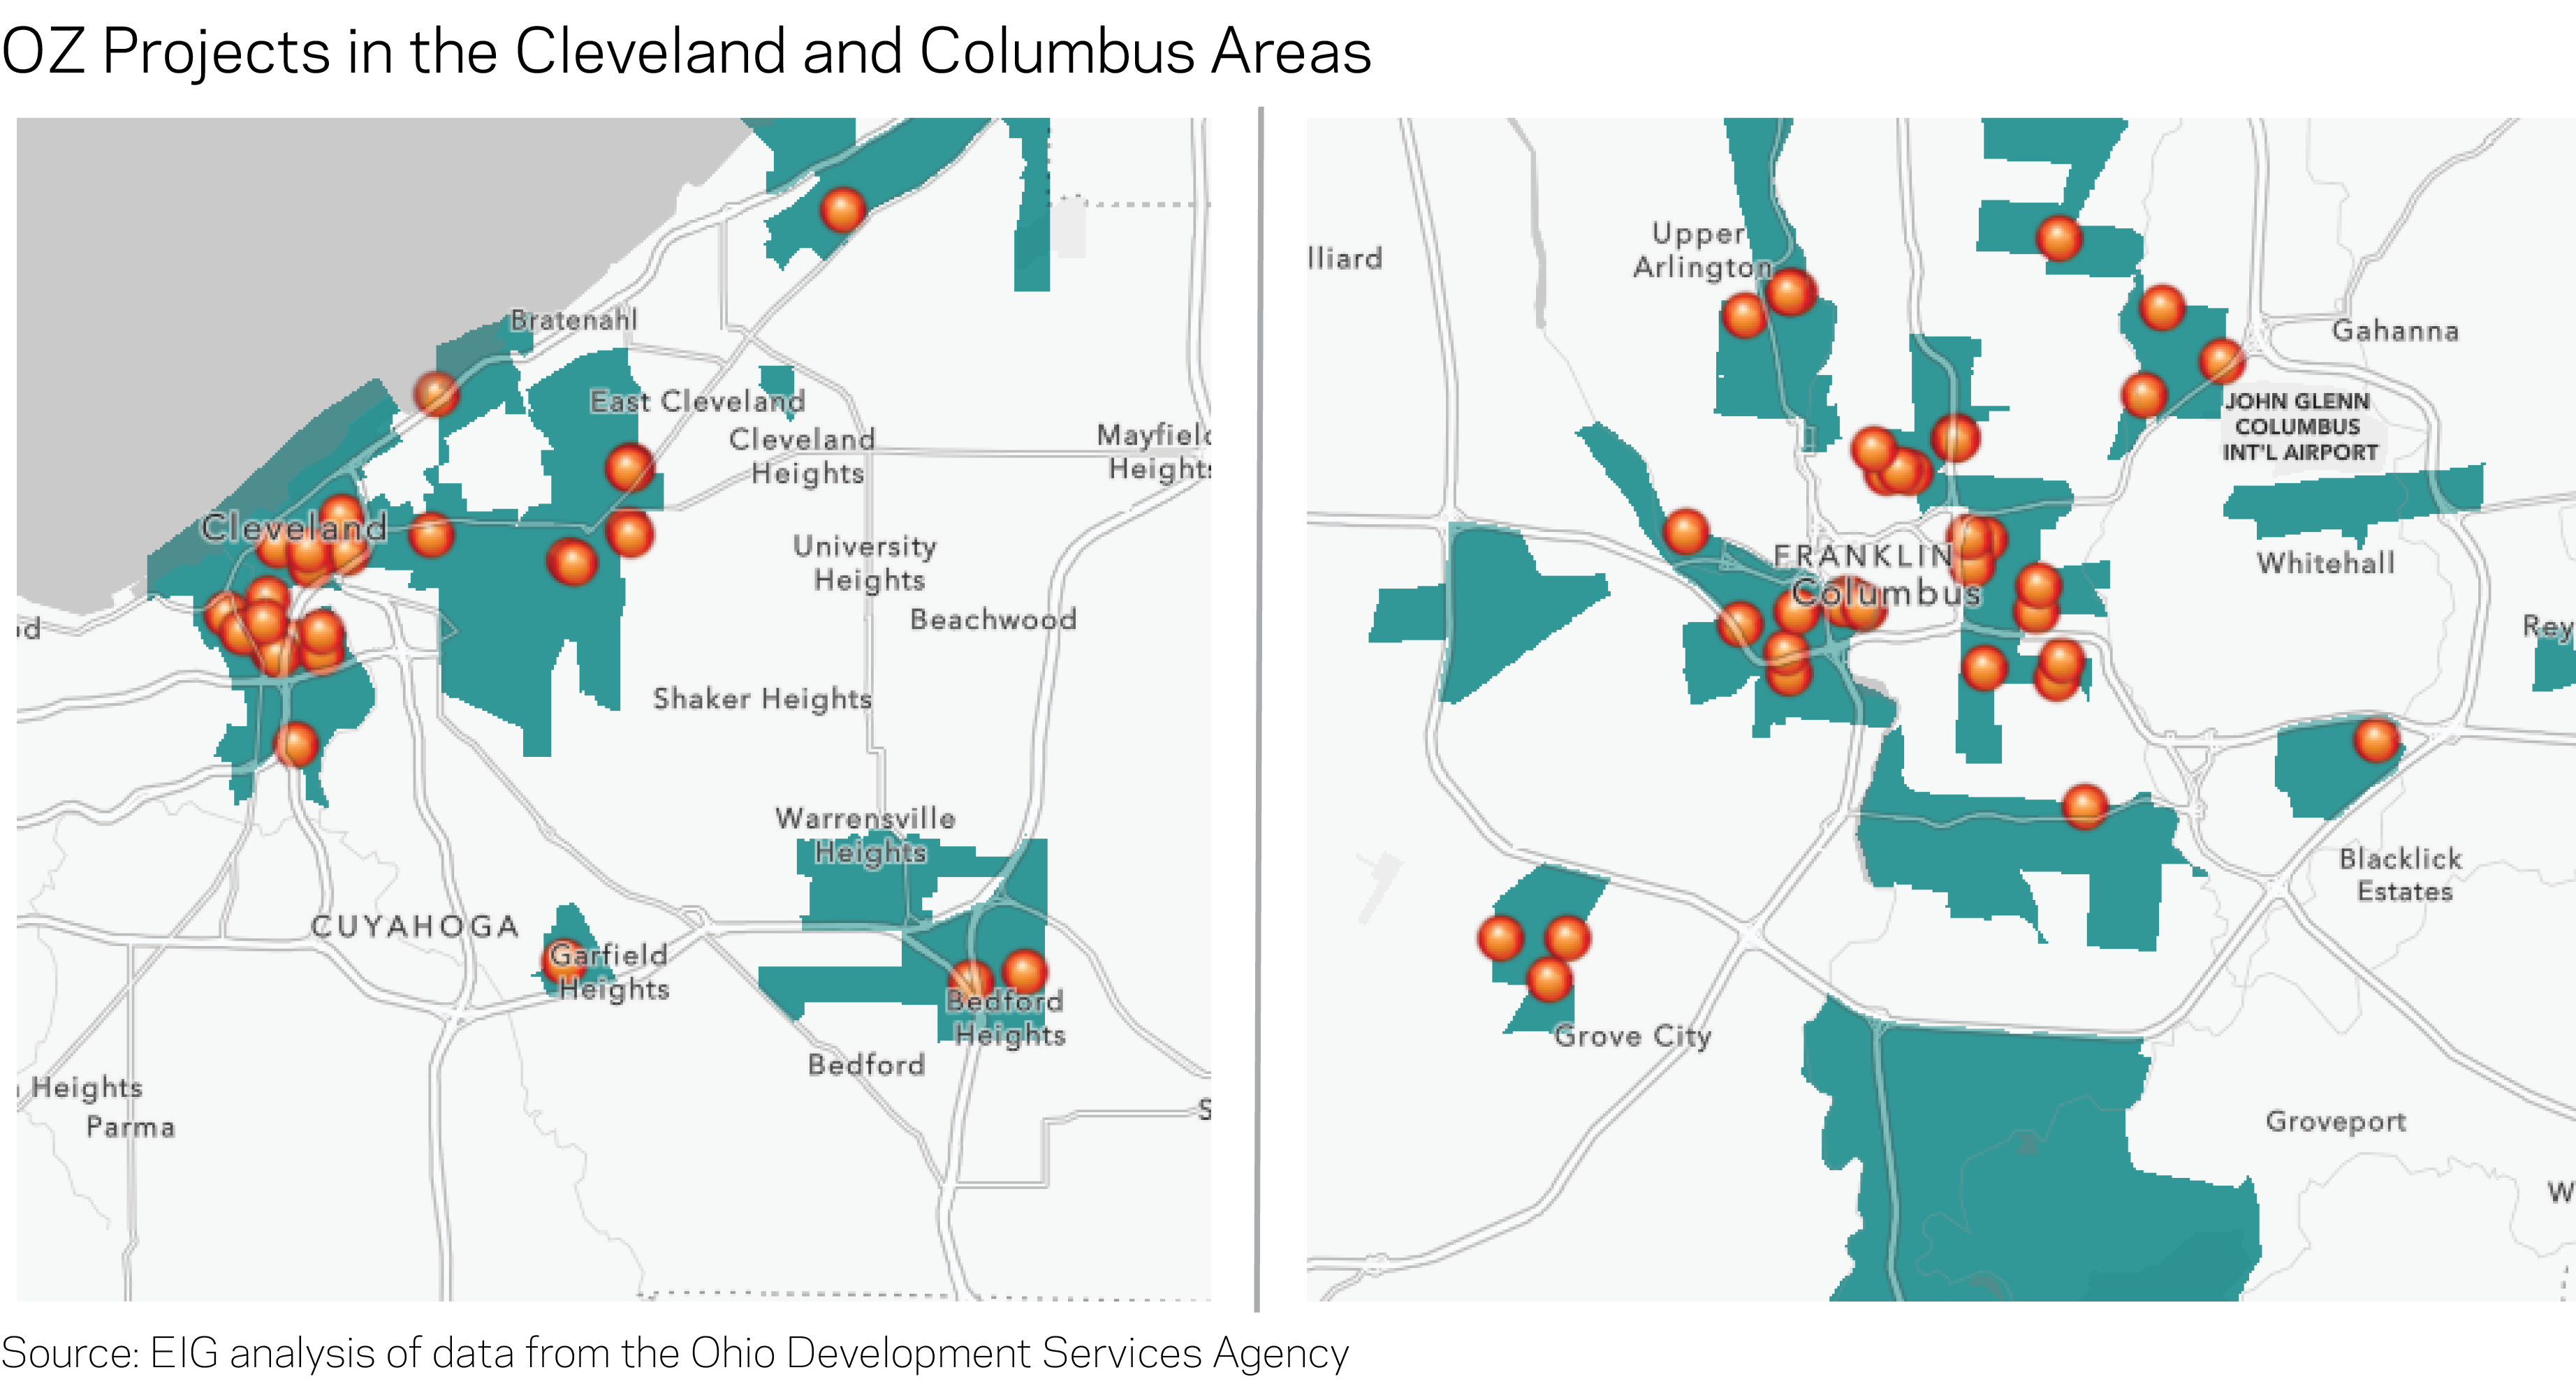
The majority of Ohio’s OZ projects, and the biggest recipients of investment dollars in particular, are located in its most populated metropolitan areas—namely in Cuyahoga (Cleveland), Franklin (Columbus), and Hamilton (Cincinnati) counties. These major population centers received just over 92 percent of dollars, but they represented only 62 percent of all project sites.
Recent research by Patrick Kennedy and Harrison Wheeler, two Ph.D. students at the University of California-Berkeley, found in their report “Neighborhood-Level Investment from the U.S. Opportunity Zones Program: Early Evidence” that OZs located close to city centers received an outsized share of initial OZ investments in 2019. The intra-metropolitan geography of investments in Ohio largely shows a similar tendency. OZ investments in all three major cities were concentrated close to downtown, albeit with significant pockets of investment still taking root in outlying areas. As we recently noted, proximity to downtown does not itself offer much context for the nature of the neighborhoods or projects receiving investment. The tracts ringing the core of these Ohio cities, for example, often contain many of the empty or underutilized urban parcels that are unfortunate hallmarks of American legacy cities, and many governors, aligned with mayors, deliberately used OZ designation to reinforce emerging investment trends and cement turnarounds and densification in such priority neighborhoods.
Two projects in Columbus are illustrative. The Phoenix Community is a mixed-use development with re-entry housing and support services for formerly incarcerated individuals that was able to secure financing, in part, due to Ohio’s state tax credit and would not have gone forward without an OZ equity investment. The development will also provide office space for the non-profit organization dedicated to finding housing solutions for returning citizens that is part of the project partnership. The use of the state tax credit helped boost investor return on the project and allowed the previously stalled project on vacant land to advance without financing from the Low Income Housing Tax Credit program.
On the other side of the city, a string of investments along West Broad Street anchored by the Gravity project serve as prime examples of infill development close to downtown that is bringing residential and mixed-use functions back to previously industrial or depopulated urban areas (the census tract still has a population of only 500). Located across the Scioto River from downtown via the Discovery Bridge, the project is one of the largest recipients of investor funding in the dataset. Gravity’s Franklinton neighborhood is a classic example of an OZ with strong fundamentals that has lingered underdeveloped for decades, close to downtown yet cut off by natural or man-made barriers. While not as mission-driven as the Phoenix investment, the OZ incentive has helped speed along projects such as Gravity in Ohio and nationally, bringing residences, office space, and other community assets back to disinvested urban neighborhoods.
Diversity of investment
Even as most OZ dollars have flowed into Ohio’s major cities, the geographic diversity of investment across the state’s counties is evident nonetheless: 18 of the 73 counties containing OZs received at least one investment in the dataset. And outside the state’s three major population centers, there are numerous examples of both relatively modest and multimillion dollar projects targeting small or medium-sized counties. Lucas County, home to Toledo, is home to several projects receiving investments ranging from just under $91,000 to over $8.8 million. A range of investments is also taking place in Akron and Dayton.
A notable cluster of OZ activity can be found in Clark County’s small city of Springfield, home to nearly 60,000 residents and at least 45 distinct investment sites. These projects are largely in neighborhoods of modest single-family homes and embody an important goal of the OZ incentive to funnel investment to areas where the housing stock is often neglected and left to depreciate in value. Springfield and surrounding Clark County have endured long-term population decline, and the average housing vacancy rate for Springfield’s OZs is 24 percent, significantly higher than the statewide OZ average of 17 percent.
Beyond these, EIG’s OZ Activity Map is a collection of some of the most noteworthy investments occurring across the country, and those in Ohio cover several affordable housing projects, commercial or mixed-use real estate, and operating businesses. One highlighted project that also received a capital investment through the state tax credit was GeneratorWorks in Akron, an operating business located in a restored historic structure just east of downtown that develops health-care support applications.
Characteristics of zones receiving investment
OZs in Ohio—both those that have seen investment and those that have not—score worse than statewide levels on many measures of economic well-being. The 35 percent average poverty rate in zones seeing investment is fully 21 points higher than statewide, and on average, the median family earns over $14,000 less than those across the state. Communities with confirmed OZ activity were also far more diverse than the state overall, reflecting the demographic composition of the state’s major population centers.
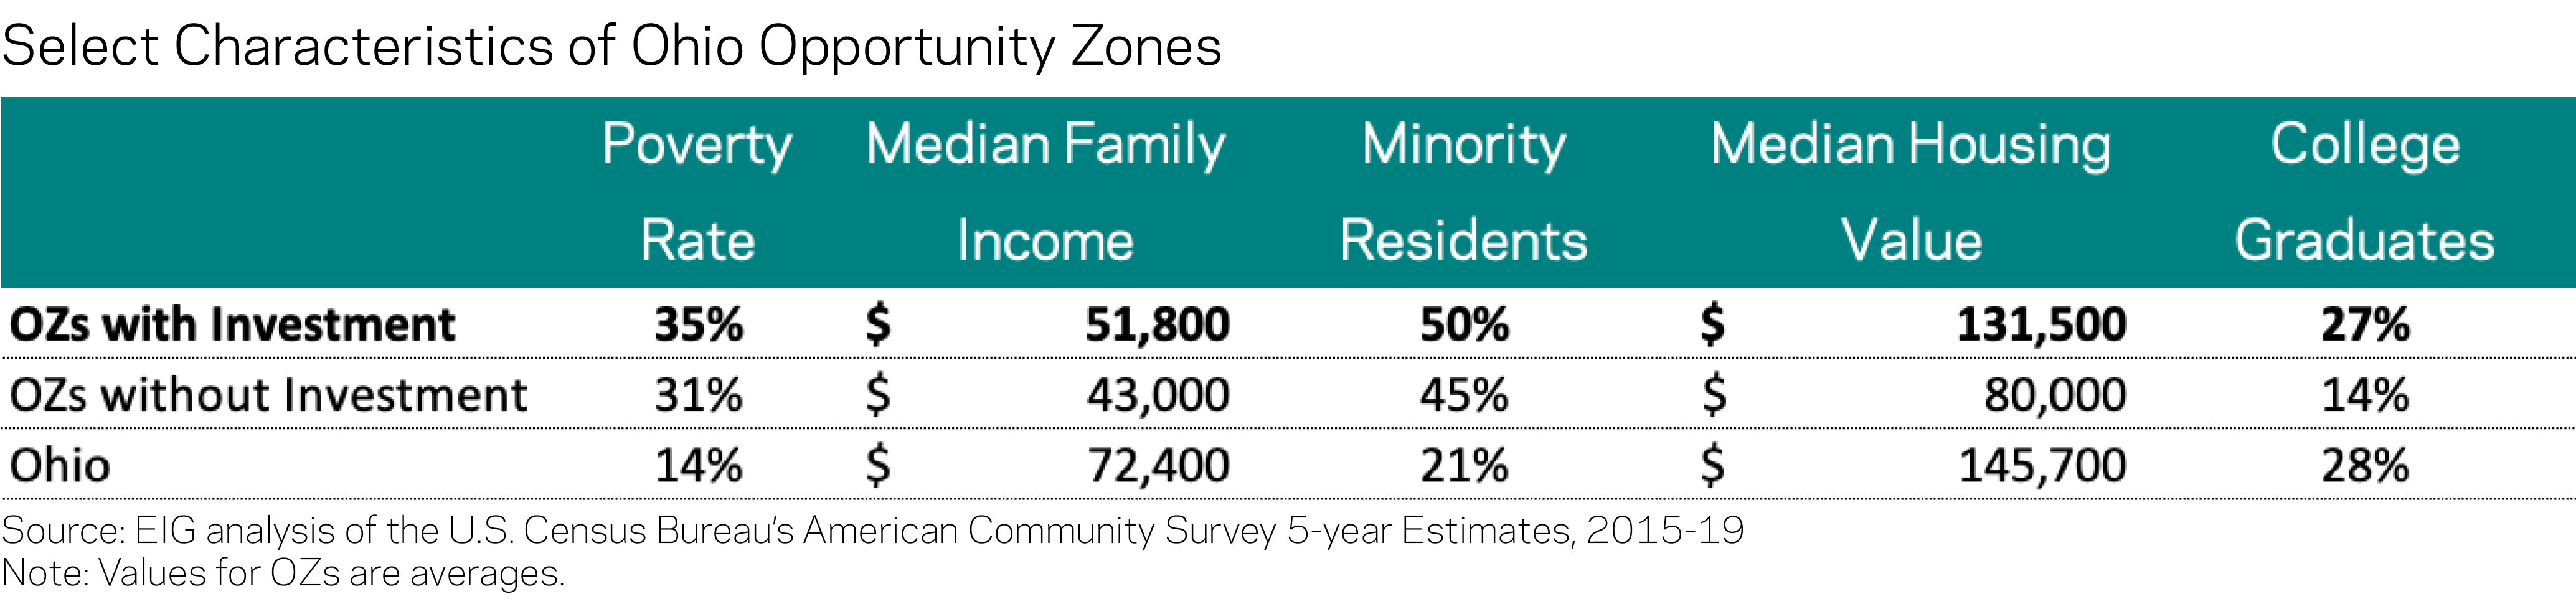
In other words, compared to other census tracts in the state, OZs receiving investment are clearly high-need. On some measures, these tracts perform better than Ohio OZs that have not received any investment using the state credit, but on others, they are relatively indistinguishable. On average, half of the residents in OZs that received investment were racial minorities, five percentage points higher than those that lacked investment, reflecting the concentration of minority residents in major cities across the state. Those OZs also ranked higher on average across several other metrics, exhibiting higher average median family incomes ($51,800 vs. $43,000), higher average median housing values ($131,500 vs. $80,000), and greater shares of college-educated residents (27 percent vs. 14 percent). However, they also had a slightly higher poverty rate (35 percent) compared to those that had no investment (31 percent). With these patterns, investments across Ohio’s OZs generally track the early national patterns established in Kennedy and Wheeler’s paper.
An in-depth look at Over-the-Rhine
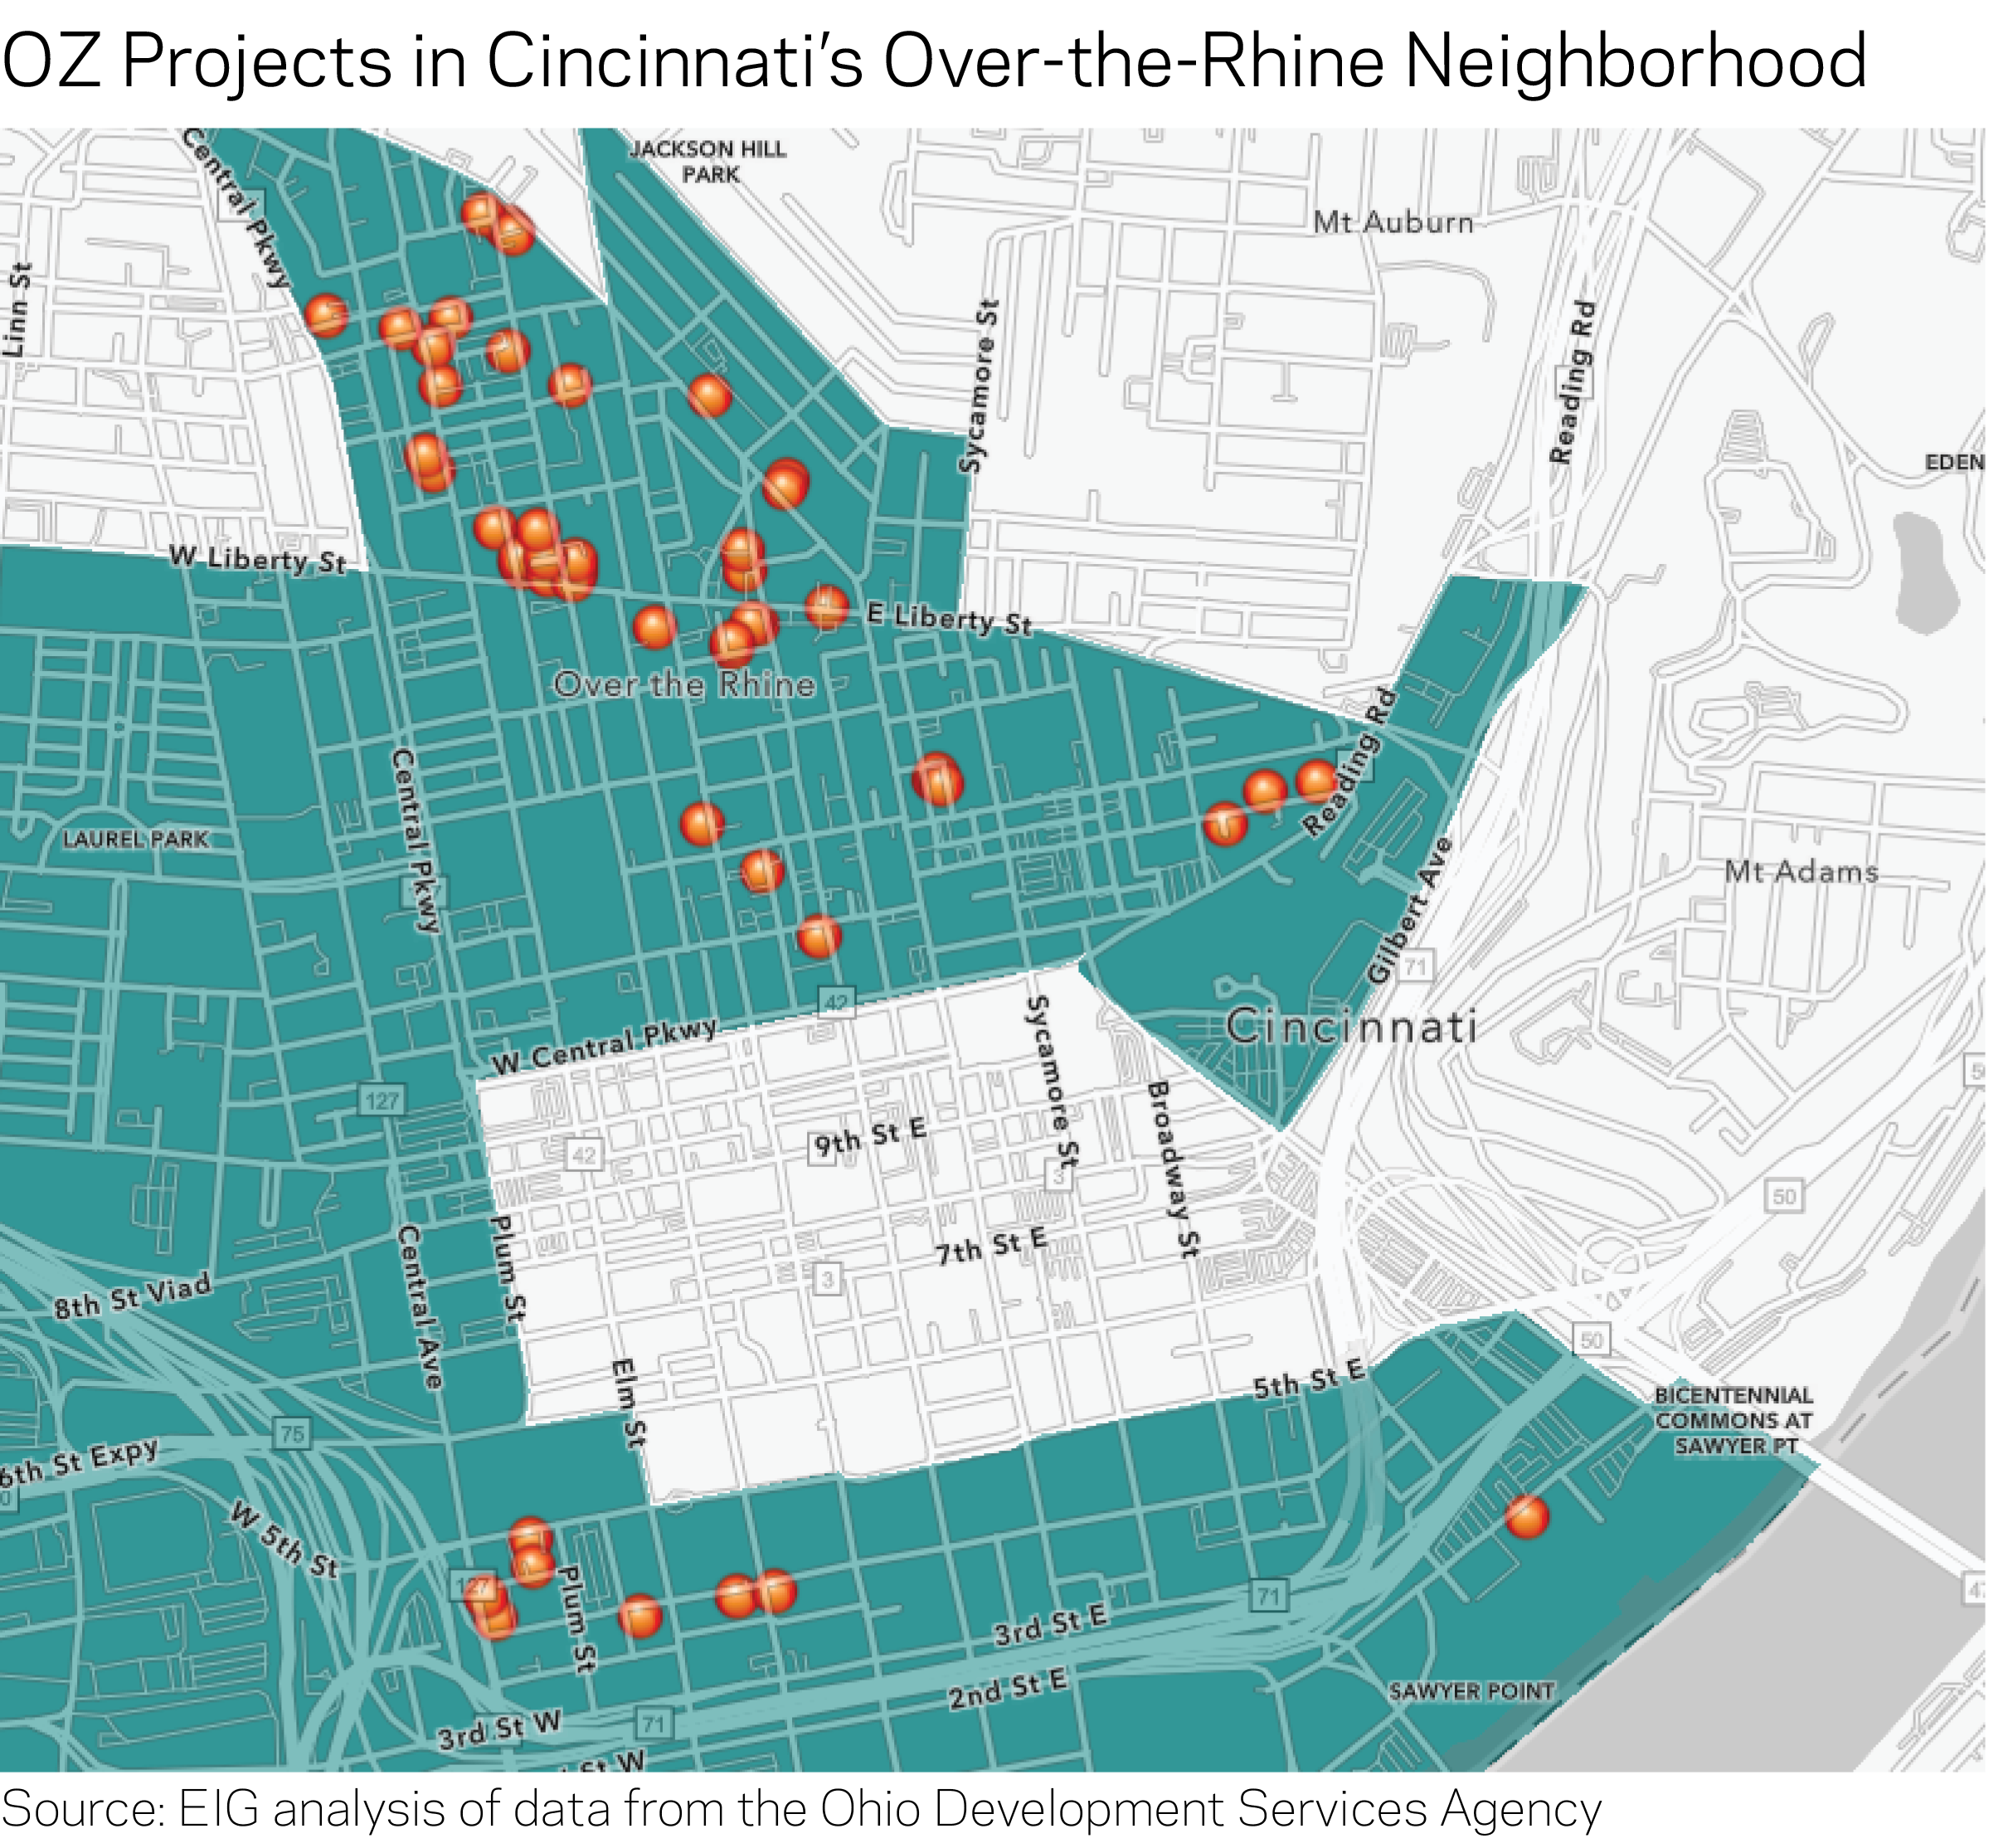
The historic Over-the-Rhine neighborhood of Cincinnati is one of the state’s most active OZ investment areas, covering five designated census tracts in what was recently among the most struggling urban neighborhoods in the country. The state tax credit data reveals that at least $10.1 million worth of investment utilizing both the federal and state OZ incentives has gone toward projects in the neighborhood. The district has been a top development priority for nearly two decades, and local officials have sponsored a range of investments—from a streetcar network to commitments for affordable housing—in efforts to help revitalize the area.
The Willkommen is one such project receiving OZ capital in conjunction with the state tax credit (highlighted on EIG’s OZ activity map) that builds on this highly collaborative and networked local development model. The project is a partnership between the Cincinnati Center City Development Corporation (3CDC), the city of Cincinnati, Local Initiatives Support Coalition, National Equity Fund, and the Model Development Corporation, among other partners, pulling together a mix of public and private funding streams. The residential development is a $51 million infill project that will include 163 residential units, 42 percent of which will be affordable, across four brand new buildings and 16 revitalized historic structures.
In several ways, Over-the-Rhine shares many of the traditional hallmarks of the legacy city neighborhoods that have been most likely to rebound over the past decade—close proximity to downtown, rich historical character—but even then, the neighborhood’s resurgence was far from guaranteed and took immense long-term commitment from public, private, and civic sector stakeholders. As recently as 2007 the neighborhood was only home to about one-ninth of its peak population, and even with some population growth since then, the neighborhood still had nearly 5,500 fewer people in 2018 than it did in 1980.
Today, the neighborhood is more often pointed to as a case study in the successes and limits of targeting inclusive economic and community development efforts: Three of the community’s OZs were recently tagged by the Urban Institute as exhibiting characteristics of rapid socioeconomic change as population growth returns to the area, such as an increasing share of non-minority residents, a rising median family income (MFI), and a growing share of residents with a college degree. The OZ tracts with the third- and fourth-highest median family income statewide are located here ($105,000 and $118,100, respectively). Even so, the area scores poorly on several other metrics of economic well-being, suggesting that the area’s nascent rebound remains incomplete. Vacancy rates in the neighborhood average nearly 36 percent, more than double the average for OZs statewide, and the poverty rate is nearly five points higher than OZs across the state.
Conclusion
Ohio’s tax credit provides a unique window into OZ investment activity in the state. The continued lack of federal reporting around OZs otherwise leaves the public, as well as state and local leaders, in the dark about what activities, projects, and businesses are receiving OZ equity in their communities, and where.
In many ways, Ohio’s data reflect the diversity that OZs were designed to foster:
- Diverse participation from an otherwise disparate investor base;
- Diverse geographic coverage with investments in cities large and small, as well as rural areas;
- Diverse investment sizes, ranging from small infusions into single-family home refurbishments to major, transformational mixed-use developments in major urban centers; and
- Diverse investment activities, from residences to operating businesses, historical preservation, and recreational assets.
The data also show a distributed investment marketplace taking shape composed of many different actors engaged in many different—and in many ways complementary—activities, with over 215 different investment sites taking advantage of both state and federal tax benefits alone. The data show that investors do tend to move together and often concentrate in particular neighborhoods, but we see that the state’s mid-sized cities such as Akron, Dayton, Toledo, and Youngstown, have all seen multiple OZ investments, as well.
And yet this enticing look at all of the activity that has sprung up around this young policy leaves us wanting more. We do not know how many OZ investments have taken root in the state that have not claimed the local tax credit. It is difficult to determine whether the investments captured in the dataset were into businesses or structures. We don’t know how representative Ohio is of the rest of the country—its tax credit may have significantly amplified investment activity relative to peers (in fact it ranks fourth in Novogradac’s survey for OZ equity raised, between Arizona and Texas). And we will be eager to see how the investment map evolves from here.
The results also emphasize why we need timely data collection and sharing at the national level, too. OZs are clearly being utilized to support a wide array of investments in neighborhoods across the country, with some receiving dozens of them. That information should be known—to residents, to planners, and to the broader market.
Finally, Ohio may also offer lessons to other states. By doubling-down on OZs, Ohio has supported significant amounts of investment into the core of its legacy cities and beyond. Its high-road approach has also yielded more transparency. At a time when some states are stepping back from OZs with far less understanding of what the policy is actually doing, Ohio offers an alternative approach.