By Kenan Fikri
Last week, Opportunity Zones (OZ) watchers received the clearest look yet at the map and magnitude of investment that utilized the new incentive in 2019 thanks to a novel working paper by two economists at the University of California-Berkeley. The early returns from that year show that the incentives supported tens of billions of dollars in investment capital and achieved an extensive geographic reach before final regulations were in place.
A long-awaited look
In “Neighborhood-Level Investment from the U.S. Opportunity Zones Program: Early Evidence,” Patrick Kennedy and Harrison Wheeler present findings from the digital tax filings of Opportunity Funds, the class of investment vehicles through which all investments into OZs must flow in order to receive the tax benefit. The study marks the first public look into official data on which Opportunity Zones have actually received investment, and how much. The researchers were able to obtain this sought-after information through one’s affiliation with the Joint Committee on Taxation in Congress (the IRS has not yet made any OZ information public). Their sample is limited to the approximately 75 percent of filings that were made digitally; the other one-quarter of the market from paper filings is not captured in their dataset.
The authors found a significant amount of investment activity through the young policy in its first year:
- Nearly 2,800 Opportunity Funds were created, which together made $18.9 billion worth of investments.
- Those funds made approximately 2,500 investments into OZs across the country.
- At least 1,362 designated census tracts received at least some OZ investment, accounting for 16 percent of all OZ tracts.
- Their figures imply that most if not all major commuting zones and it seems every state saw OZ investment activity in the first year.
- OZs closer to downtowns and experiencing faster population growth and with higher educational attainment were more likely to see investment.
Crucial context
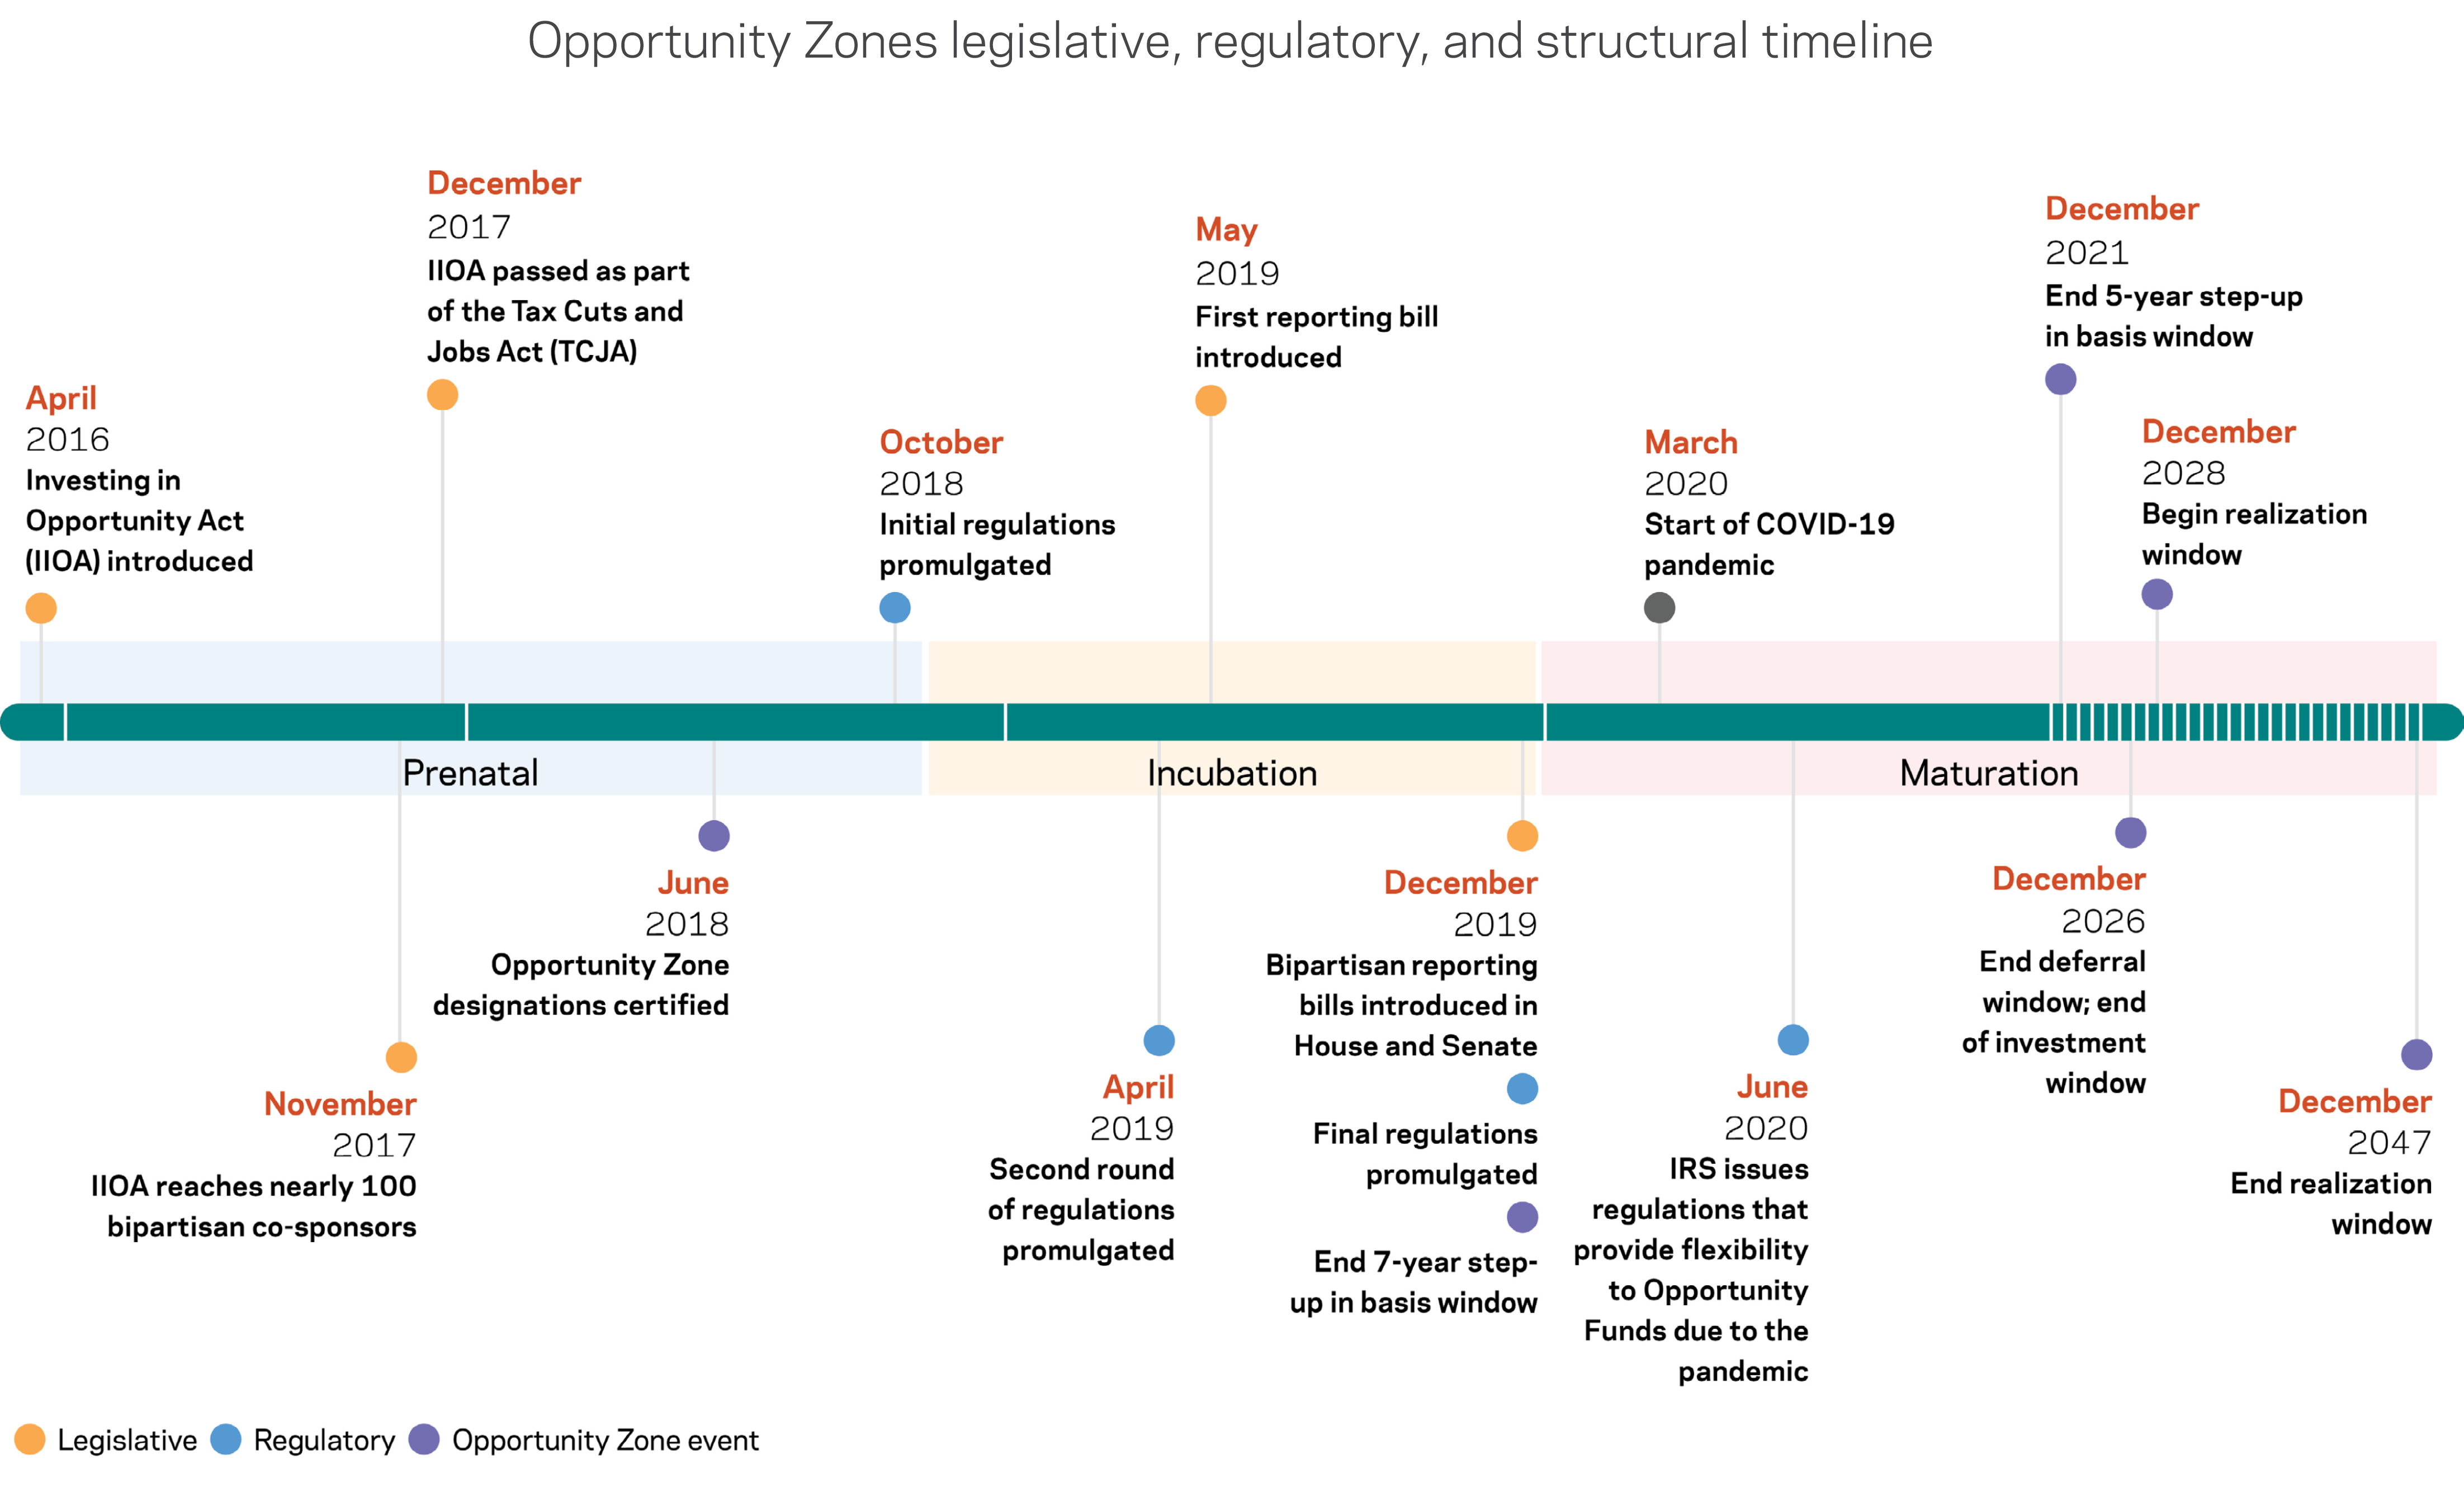
It’s important to bear in mind that almost all of the activity captured in this study occurred prior to the issuance of final regulations by the IRS, which came in December 2019. As a result, many of the basic rules of the road and technical details required to utilize the new incentive were not yet in place, which limited the scale and scope of uptake from investors. As discussed in our February 2021 “Opportunity Zones State of the Marketplace” paper, 2019 was akin to an “incubation” period for the new and still-unfamiliar policy. The lack of regulatory certainty was particularly challenging for investors in operating businesses (as opposed to real estate projects, where most early investment was concentrated). Without final regulations in hand, early movers in the market naturally gravitated towards relatively low-risk and simple investments–namely those into real estate projects with relatively straightforward financing streams in place.
Considering that the incentive was not fully implemented until the end of the period studied, the level of uptake that nonetheless took place could be considered a promising start. Many skeptics, however, concluded that the large share of zones that did not see investment in the policy’s incubation phase and relatively less severely distressed locations that did receive OZ investments were signs of a rocky beginning. Regardless of one’s priors, the paper’s findings establish a clear if incomplete baseline from which to measure the policy’s future growth and geographic spread.
Just getting started
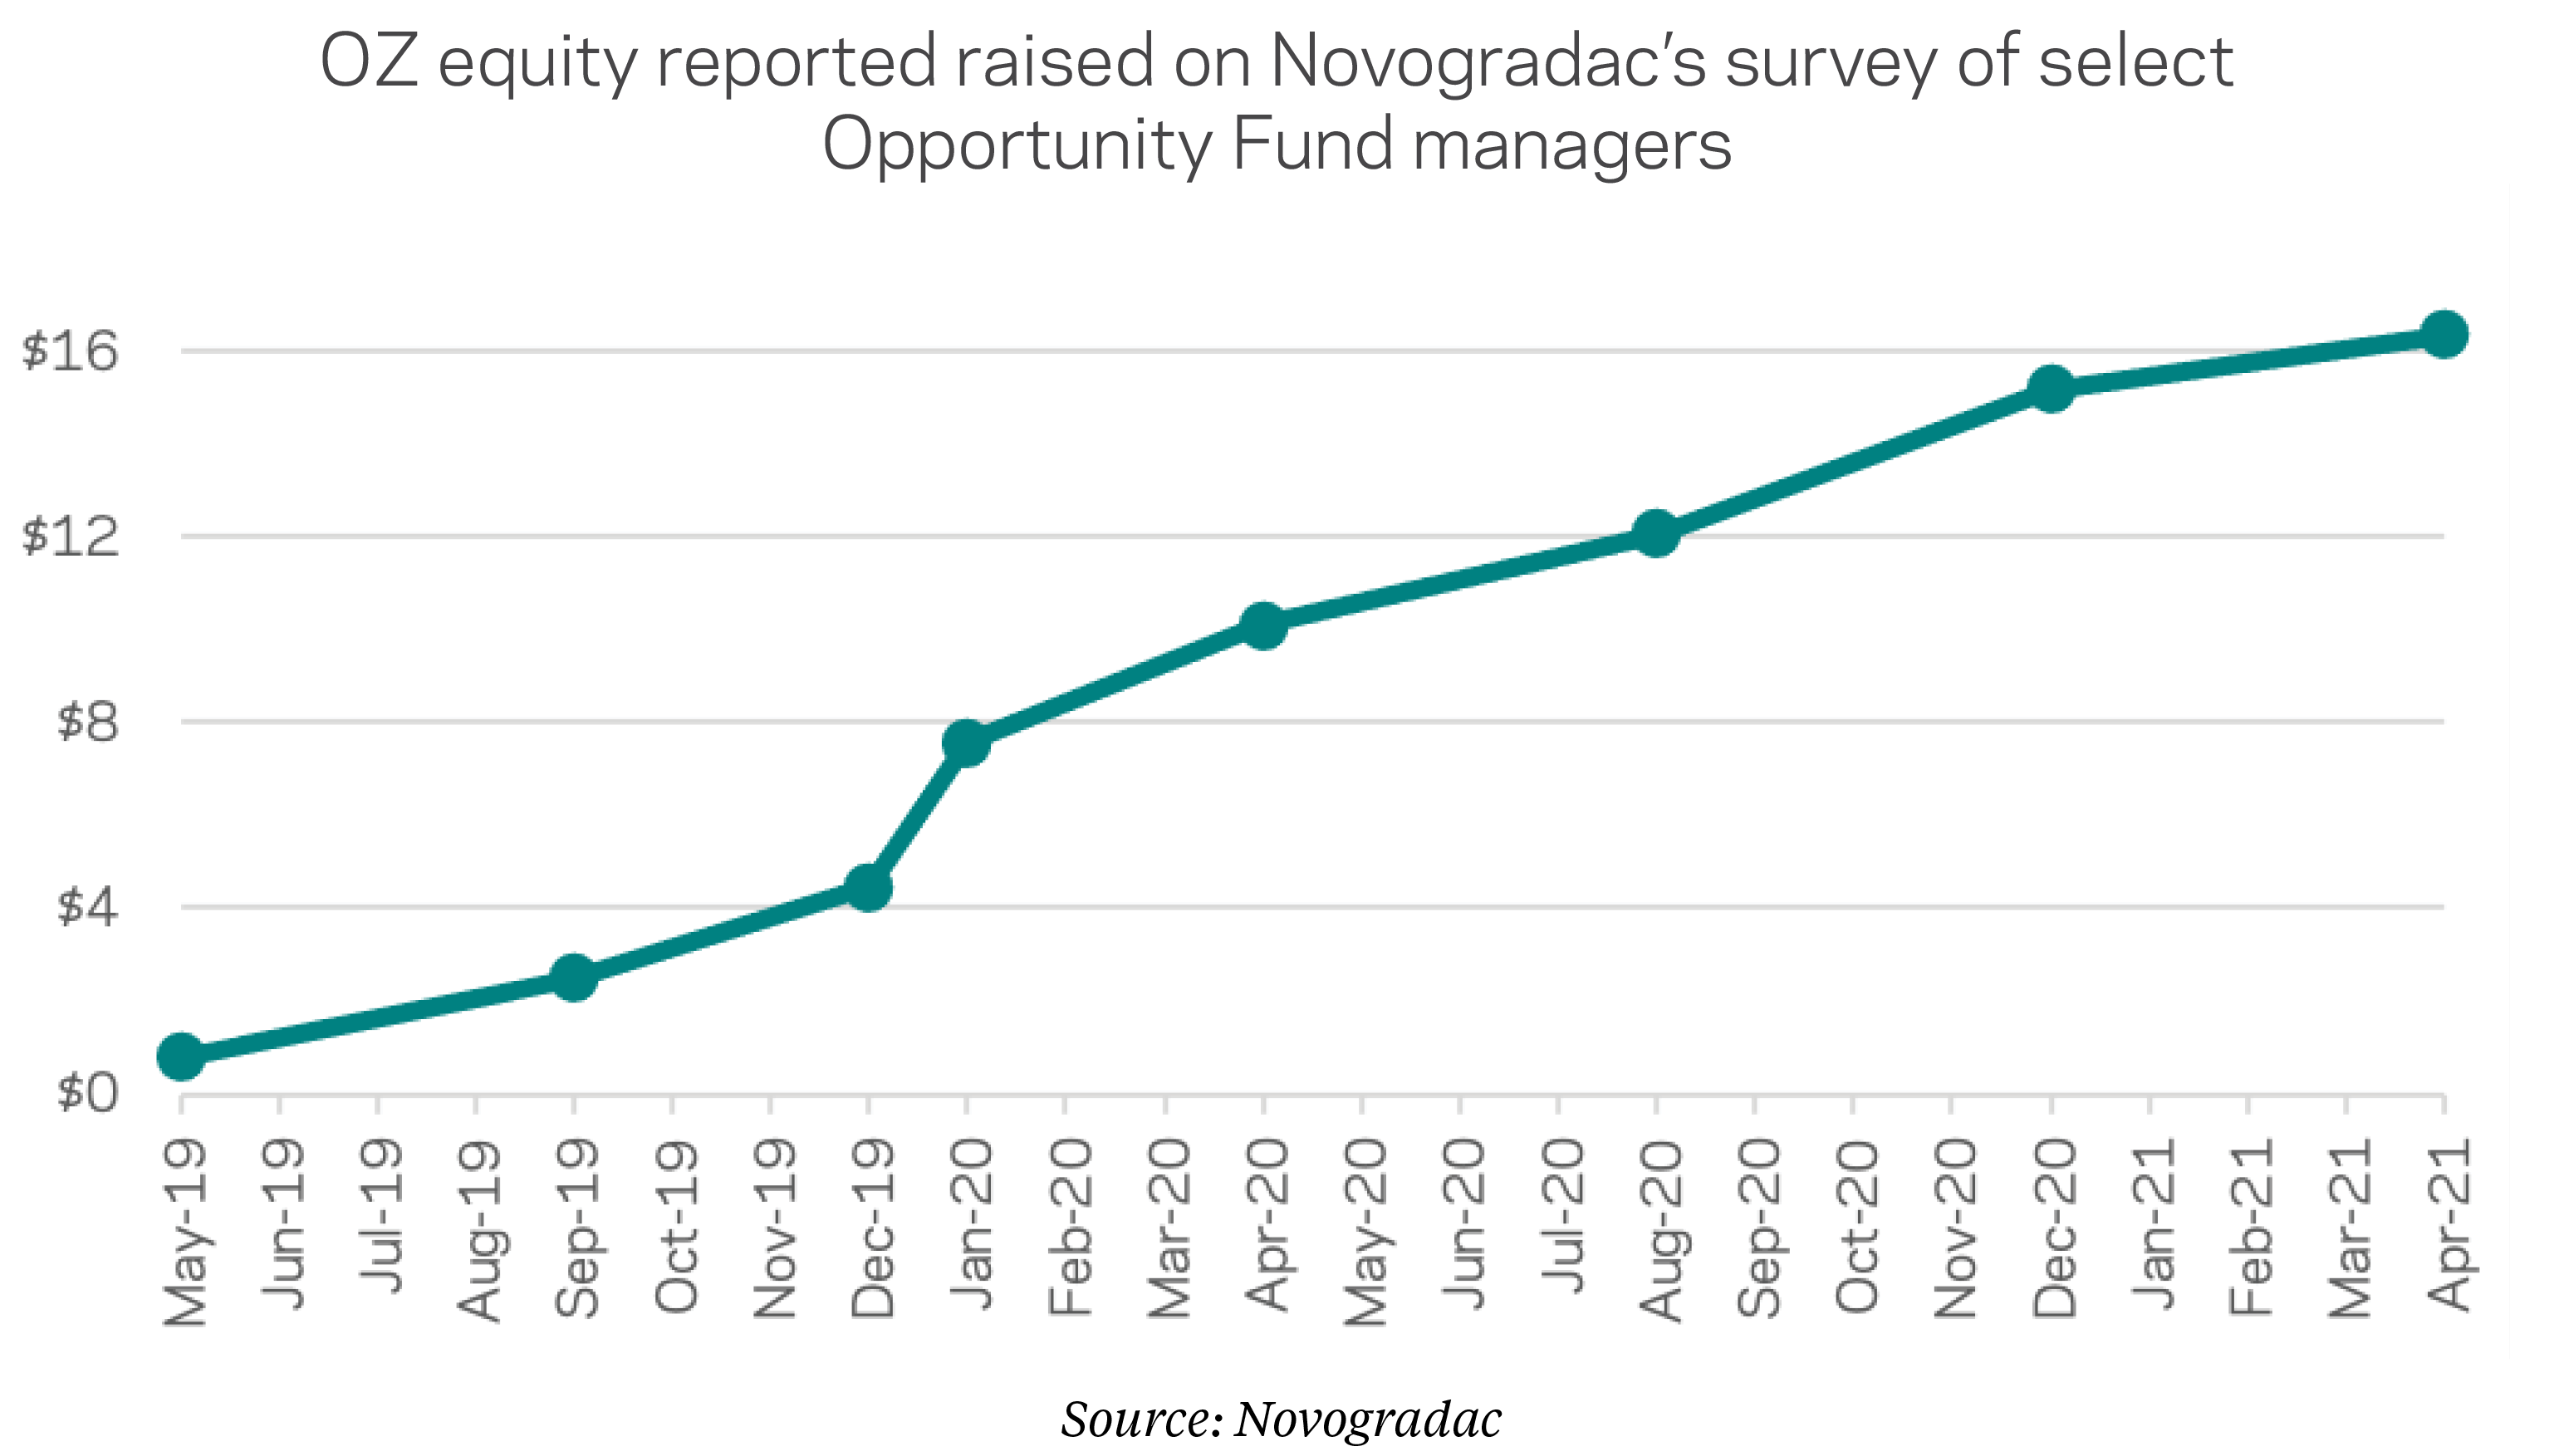
Accordingly, the best available private data from the professional services firm, Novogradac & Company, show OZ investment activity taking off rapidly in 2020. Kennedy and Wheeler found that Opportunity Funds invested roughly four times as many dollars as fund managers reported raising in Novogradac’s survey in 2019. If one takes the 2020 trendline from Novogradac’s data and applies it to Kennedy and Wheeler’s figures, then OZs could have plausibly marshalled at least $66.5 billion in equity by the end of 2020—which, again, does not count investments reflected in paper filings with the IRS.
Since one can safely assume that certain OZs will continue to attract more investment than others, the geographic reach of the policy has probably not expanded by the same factor as fundraising. Nevertheless, even if the map expanded half as quickly as the accounts did, by the end of 2020 comfortably more than one-third of the country’s Opportunity Zones would have received an OZ investment—with six years remaining until the window for new investments closes at the end of 2026. A forthcoming EIG release analyzing data from Ohio’s complementary OZ tax credit program finds that one-quarter of Ohio’s OZs have received investments using both the federal incentives and the tax credits available to in-state investors meeting certain criteria. Many OZ investments in the state either do not qualify for, or choose not to utilize, the state offerings, which means Ohio’s one-quarter figure provides another lower-bound estimate for OZs’ minimum extent.
All these figures compare favorably to the New Markets Tax Credit (NMTC) program, one of the federal government’s most significant community development initiatives. NMTC allocated $3.6 billion in 2019, which reached projects and businesses in approximately 400 census tracts. In the same year it appears that OZs reached three-times as many tracts off of a federal subsidy that may end up in the same range (the comparable cost to taxpayers from OZs will only be a fraction of the $18.9 billion raised by Opportunity Funds; OZs’ costs are determined by forgone taxes on that sum and its future earnings).
Geography and gentrification
Kennedy and Wheeler’s findings about the geography of OZ investments within cities and across eligible tracts warrants further discussion. The authors find that investment gravitated toward tracts with relatively higher educational attainment, income, population density, and pre-existing upward income and population growth trends. At the same time, they found that OZ tracts receiving investment were generally indistinguishable from their peers with respect to poverty rates and close with respect to racial demographics (slightly less white, more black, and less Hispanic than OZs that did not receive investments, with larger foreign-born population), and that they scored worse across measures of well-being than national averages.
Especially given the absence of final rules and market norms we noted earlier, it is not surprising that OZ investors would gravitate toward eligible tracts showing signs of improvement. Furthermore, many governors, aligned with mayors, deliberately chose to use OZ designation to reinforce other investments and cement turnarounds in their priority neighborhoods.
The authors also find that proximity to downtowns was a strong predictor of investment activity. What this means in practice in many metropolitan areas is that OZ investments are driving in-fill development near central cities. Based on our continuous monitoring of news clips, it seems that the clear majority of OZ projects have repurposed abandoned structures or taken root on vacant parcels, parking lots, or old brownfield sites, given the original use and substantial improvement requirements for OZ investing. In many cases, the census tracts in close proximity to downtowns that received disproportionate investor interest in 2019 have been undergoing rapid growth and change because they are being converted from disused urban and often industrial spaces into mixed-use residential districts that are beginning to reverse decades of depopulation and disinvestment.
Nevertheless, put the pieces together and the study’s results generally show that in the first year, investors picked the “low-hanging fruit” within the eligible class of census tracts. While understandable in the incubation phase, if this pattern held over the lifetime of the policy, it would signal that OZs had undershot their potential to activate more private investment in the country’s most struggling neighborhoods. The goal—and the challenge for policymakers—is to ensure that the map of OZ investing diversifies significantly from here.
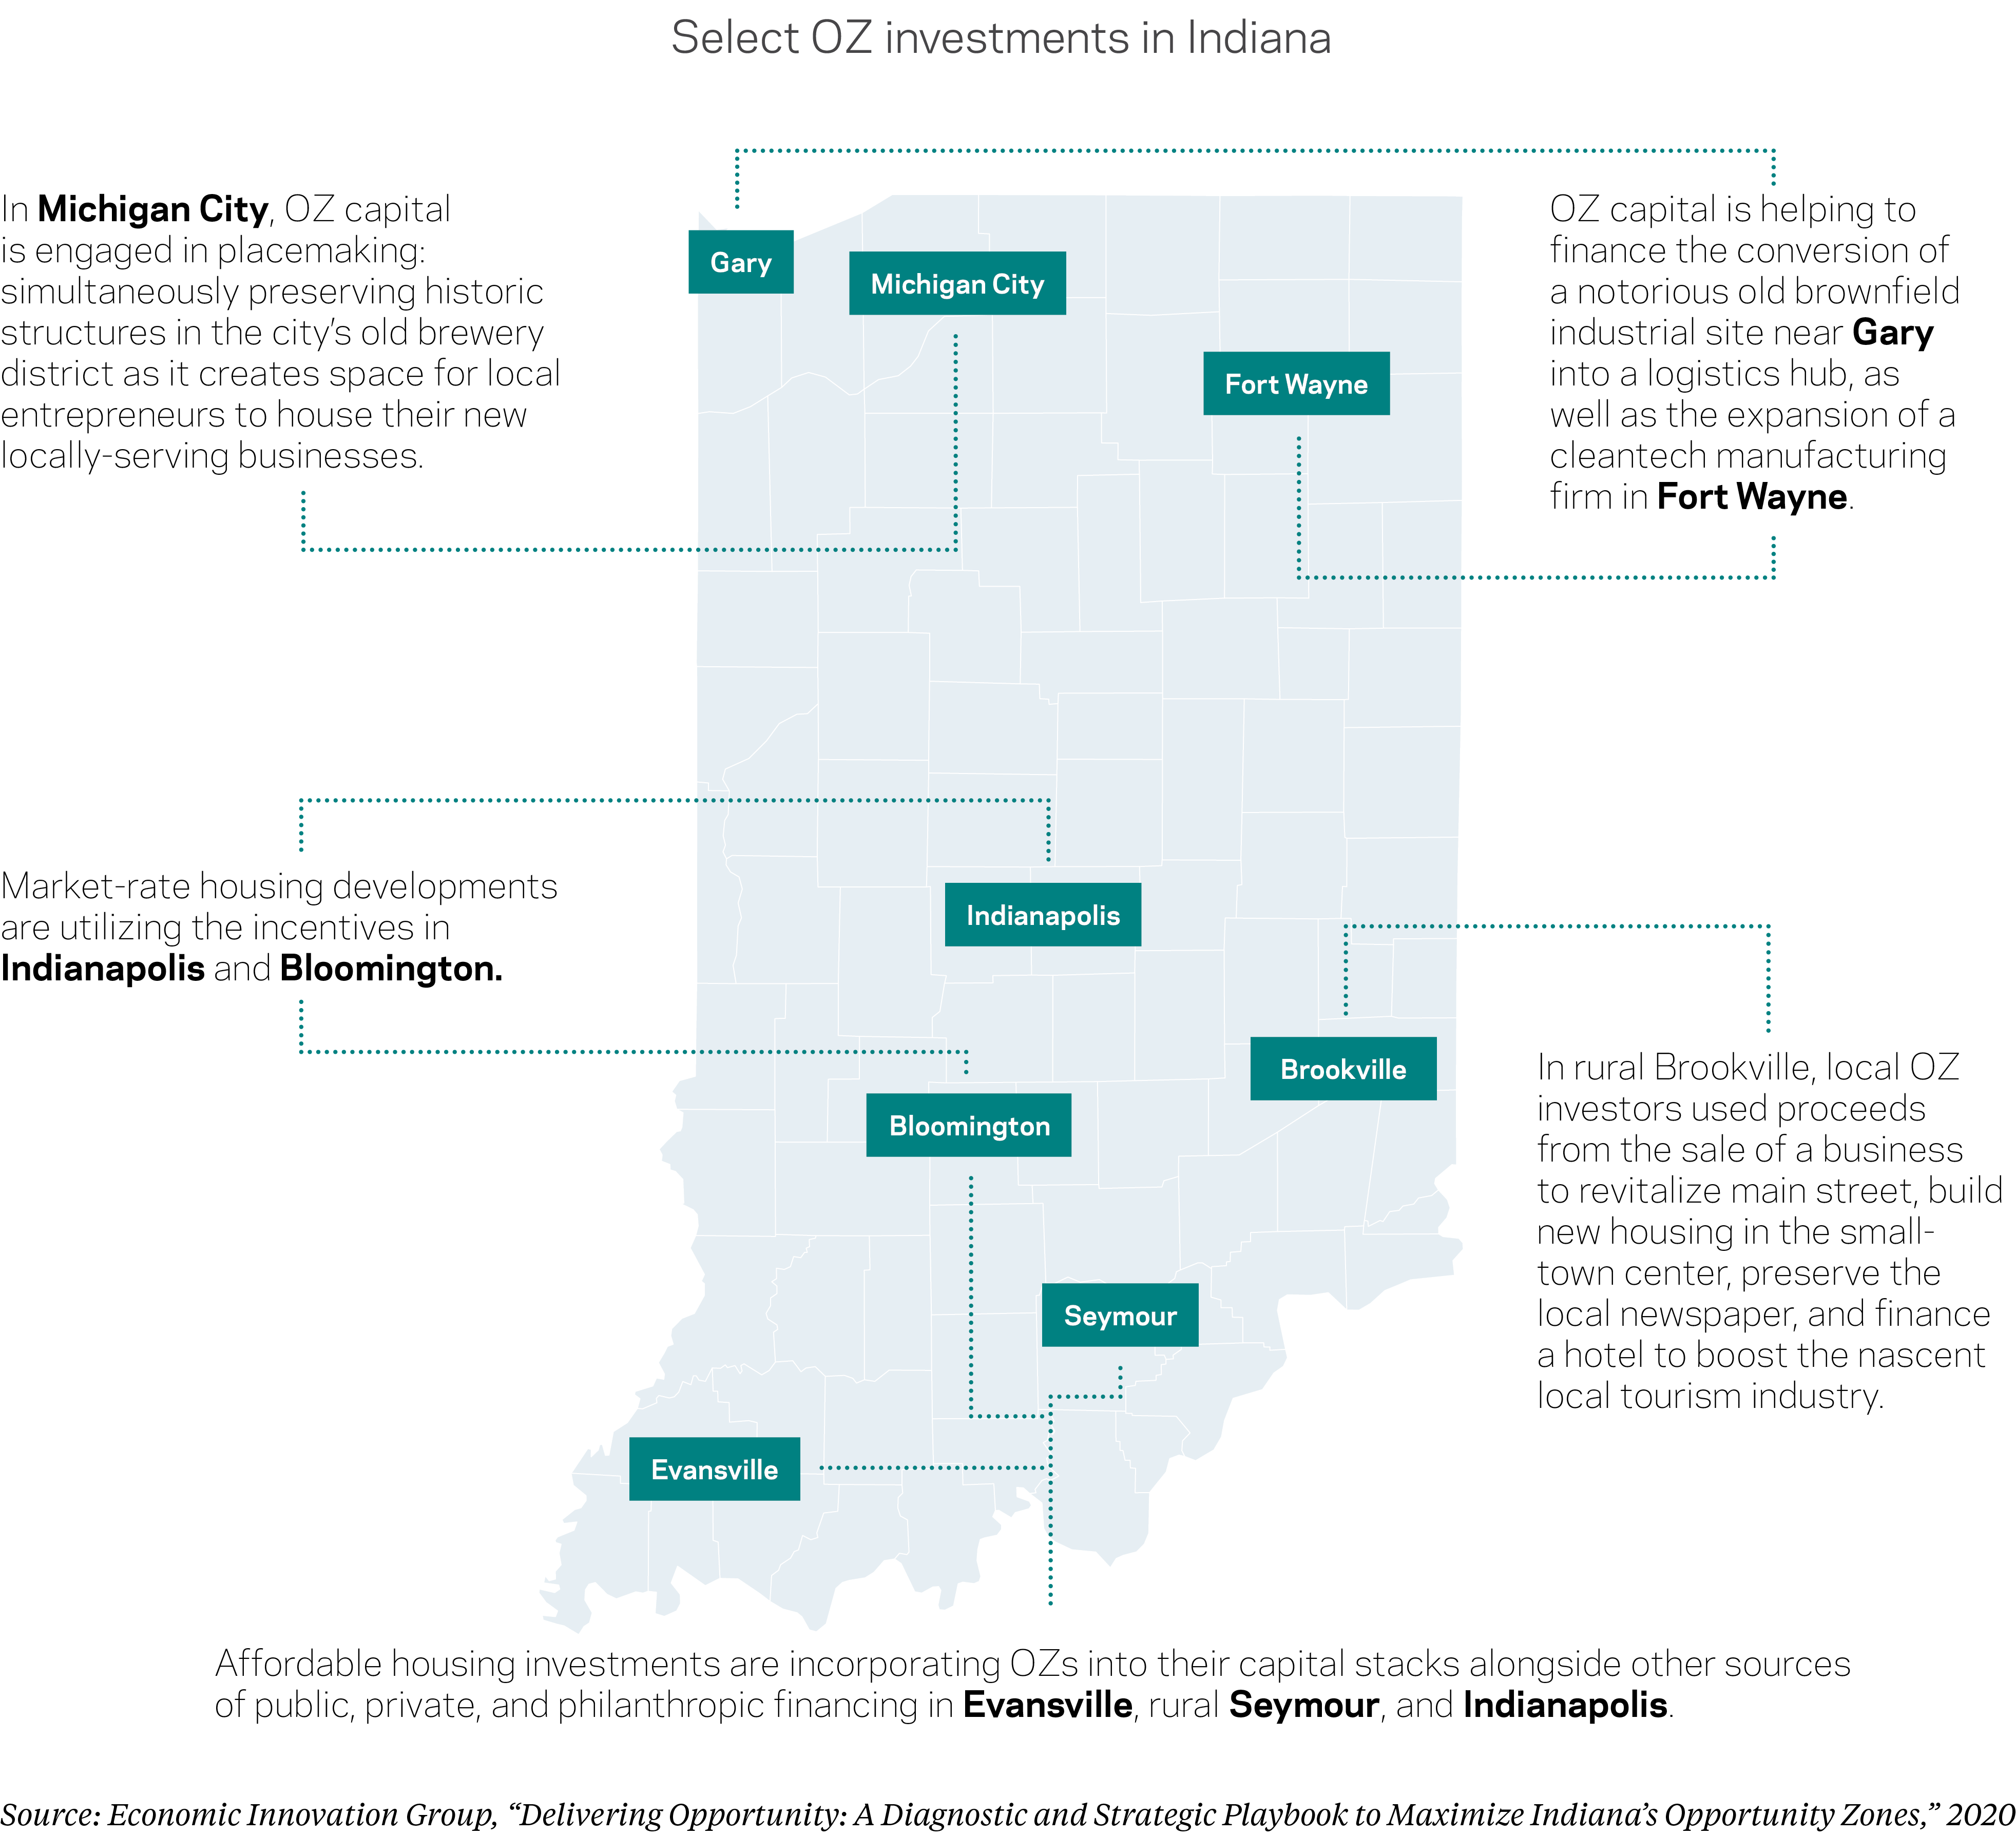
There is a growing body of anecdotal evidence that encourages us to believe that the map is indeed expanding. We see this in the Ohio data, where at least 28 tracts received investments in 2019 compared to 50 in 2020 and 46 already in 2021, and we saw it in the research we did for the development of an Opportunity Zones economic development playbook for the state of Indiana (see graphic). EIG’s OZ Activity Map itself captures hundreds of quality investments of all sizes with noteworthy clusters in places like Alabama, rural Colorado, and legacy cities such as Baltimore, MD, and Erie, PA. From robotics to cybersecurity and mental health technology to vertical farming, investment into operating businesses seems to have taken off in 2020 as well—with rural areas competing strongly.
Bolstering the marketplace
The Kennedy and Wheeler paper shows that Opportunity Zones are moving capital and that the capital is reaching a large number of communities. But the data also suggest that some targeted interventions early in the life of the policy to push the evolving market towards impact and increase the likelihood it reaches deeply struggling neighborhoods with quality investments would be worthwhile. Accordingly, the new administration and its partners in Congress should waste no time in fortifying the policy to be a constructive tool for an inclusive recovery from the COVID-19 pandemic. EIG has called for a number of actions to those ends that include:
- Building out reporting & transparency requirements: The unintended opacity of the OZ marketplace has only been a hindrance to equitable development in Zones. Establishing reporting and transparency requirements for OZ funds and investments in a manner that protects confidential information but provides the public with basic information about what the policy is financing, and where, would significantly enhance efforts to evaluate the OZ policy and guard against misuse. Senator Tim Scott’s bipartisan Improving and Reinstating the Monitoring, Prevention, Accountability, Certification, and Transparency Provisions of Opportunity Zones (IMPACT) Act is one proposal that would achieve these goals.
- Early sunset of high-income OZ tracts: The integrity of the OZ map is critical to the integrity of the policy. Enacting an early sunset of OZ designation for tracts that technically met Treasury’s definition of a low-income community at the time of designation but are clearly not economically struggling in any practical sense would fortify the policy. Zones with the highest median family incomes—the 150 tracts (1.7 percent of all OZs) with incomes over 125 percent of the national median, for example—do not appear to be garnering any disproportionate share of investment, but they are clearly candidates for sunsetting early. The Kennedy and Wheeler paper shows that the economic circumstances of each tract matter. Any sunset provision should include careful consideration of factors that could mitigate disqualification (tracts critical to local revitalization efforts, for example), provisions dictating how states can designate replacement tracts, and rules to protect existing and planned investments in the disqualified zones.

- Additional flexibility for affordable housing: Efforts to use OZs to finance the construction of affordable housing would be enhanced by steps to harmonize compliance between OZs and the flagship federal affordable housing program, the Low Income Housing Tax Credit. Providing additional regulatory flexibility to allow property converted from market-rate to affordable rental housing to be considered “original use” property instead of requiring the project to be “substantially improved” would increase the stock of affordable and workforce housing in communities seeking to offer more housing options across all income levels.
- Federal funding for states and communities: Since OZs were enacted, community leaders have clearly expressed the need for technical assistance, pre-development and risk mitigating capital, and dedicated personnel to coordinate OZ strategies, interface with local stakeholders, and conduct outreach to investors and project sponsors. Creating a federal fund, housed within the Department of Treasury, the Community Development Financial Institutions Fund, or the Department of Housing and Urban Development, that distributes money to states for such activities would help communities successfully develop and implement their OZ strategies to meet the unique needs of their residents.
Conclusion
In sum, Kennedy and Wheeler’s paper offers an important initial look at the reach of the Opportunity Zones policy in its first and formative year. While skeptics may point to the relatively small share of OZs that received investment in 2019 as cause for concern, there is good reason to believe that the reach, diversity, and economic impacts of OZ investment will only continue to increase in the coming years. As the policy matures and the nation begins to heal from the coronavirus pandemic, it is not a question of if, but by how much, the OZ map will expand. And indeed, we are already seeing significant increases in OZ-motivated capital investment and geographic reach.
Despite what we view as a promising trajectory, there is still unfinished business for the administration and Congress to further refine the policy and ensure its value as a tool in the nation’s economic recovery from COVID-19. Building out reporting requirements, enacting an early sunset of high-income OZ tracts, allowing for greater flexibility for affordable housing projects, and offering additional support for states and communities to implement the policy, would go far to ensure the Opportunity Zones program achieves its goal of spurring long-term, meaningful investment in struggling communities in all corners of the United States.