by August Benzow
Key Findings
- Large urban counties (defined as those with more than 250,000 people that include an urban center) experienced a net loss of 863,000 residents in 2021, the first time this group has experienced negative growth in the aggregate in the past 50 years.
- Sixty-eight percent of large urban counties lost population in 2021, an exceptionally high share by historical standards.
- Only four of the top 15 counties for net domestic migration in 2011 saw positive domestic migration a decade later in 2021, underscoring just how substantially patterns have shifted.
- California’s Inland Empire, the Mountain West and eastern Texas saw some of the most comprehensive population growth in 2021.
- The majority of the fastest growing counties in 2021 were suburban or exurban.
- Over eight in 10 (81 percent) of exurban counties gained population in 2021, outperforming any other group
The 2010s was a decade of population decline or stagnation for many parts of the country as national population growth reached historic lows and the legal immigration pipeline slowed to a trickle. New county-level data shows that beneath these well-documented national trends, a more complex narrative emerges. Large urban counties that since 2016 have seen dwindling numbers of international migrants, a crucial ingredient for their economic success, experienced unprecedented losses of domestic migrants in 2021 as the pull of suburban and exurban counties intensified.
Record high share of large urban counties losing population
Population growth in large urban counties has been trending downward since 2016 after surging in the early 2010s. However, 2021 marked a historic first for these 78 counties, which as a whole saw a total population loss of 863,000 residents from the year prior.
Importantly, the decline was widespread, with 68 percent of large urban counties in the red. It is worth placing this in a historical context. Even during the exodus from America’s urban centers in the 1970s, the share of large urban counties losing population never became a majority, and that was a period in American history where cities were experiencing disinvestment, high crime, and a stark lack of amenities.
Some of the effects of the pandemic that drove this outmigration are likely temporary, such as young people moving back in with their parents and the more affluent retreating to vacation homes. However, it seems less likely that those who purchased homes in the suburbs and exurbs during the pandemic, motivated in part by new remote work options, will be selling and moving back to cities.
Urban counties are no longer magnets for moves within the country
The fate of the 15 counties with the highest levels of net domestic migration in 2011 ten years later shows just how much the pandemic upended established trends. Only four of these counties had positive net domestic migration in 2021 and each of those four saw a decrease in domestic migration from the previous year. The only large urban counties with positive domestic migration in 2021 and an increase from the previous year were Kern County, California (Bakersfield), San Joaquin County, California (Stockton), El Paso County, Colorado (Colorado Springs), and Allen County, Indiana (Fort Wayne).
Even urban counties in booming metros like Travis County, Texas (Austin) and Mecklenburg County, North Carolina (Charlotte) were not immune to this trend. Both posted the first negative net domestic migration in the past decade in 2021 even though they managed to still have positive population growth overall. King County, Washington (Seattle) not only lost domestic migrants but saw its population shrink for the first time since the 1970s.
Population growth is now the most robust in suburbs and exurbs
Urban counties are no longer driving population growth in the country. Large urban counties make up 32 percent of the country’s population while small urban counties represent 16 percent of the country’s population, so around half the country’s population are in these urban counties. The combined population of suburban and exurban counties make up 27 percent of the country’s population and the remaining quarter of the population live in rural counties. In 2011, a year when the country as a whole added 2.3 million new residents, urban counties saw a net population increase of 1.5 million from the year prior compared to 0.6 million for suburban and exurban counties. By 2017 these two groups had nearly reached parity with the former adding 1 million new residents and the latter adding 0.9 million. Since 2017 suburban and exurban counties have had a net population growth that exceeds urban counties with a widening gap each year. This precipitous decline in urban population growth corresponds with a national slowdown in immigration.
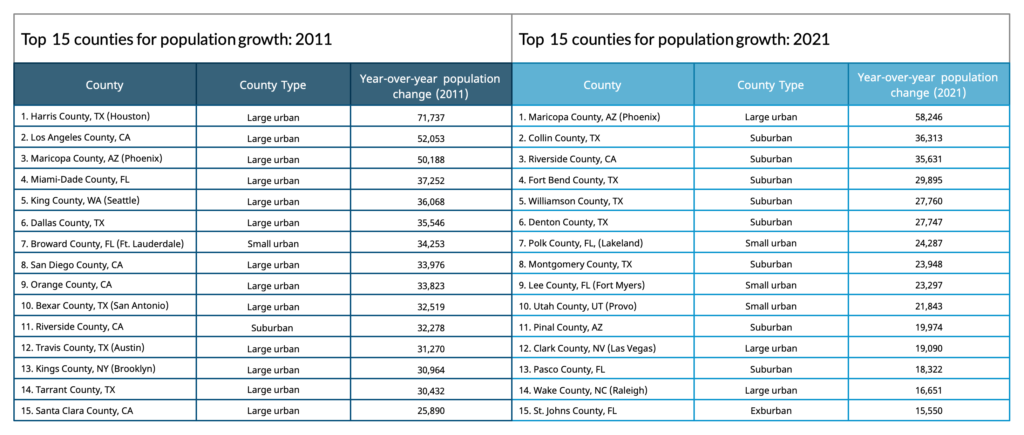
In 2011, the top 15 counties for net population growth were almost all large urban counties with the exception of the slightly smaller Broward County, Florida (Fort Lauderdale) and the urban-adjacent Riverside County, California (near Los Angeles). By contrast, in 2021, only three large urban counties numbered among the top 15 for population growth. Sprawling suburban counties in the Sunbelt posted the largest population gains even though population growth overall was less than it was ten years ago.

Although large urban counties experienced the biggest reversal of fortunes in 2021, small urban counties saw worse outcomes as well, suggesting urban areas overall faced pressure from pandemic-related factors. Among small urban counties, San Mateo County, California (Silicon Valley) saw the steepest loss of 24,600, while Polk County, Florida (Lakeland) saw the biggest increase with 24,300 new residents.
While there has been much discussion of a flight to the suburbs, the share of suburban counties growing actually declined. Instead, exurban and rural counties saw a rising share of counties that gained population, with non-metropolitan rural counties seeing the highest population gain since 2008. Eighty-one percent of exurban counties gained population in 2021, outperforming any other group. The implication here is that Americans did not just move out of cities in droves in 2021, but also selected far flung places to move to.
Affordability, sprawl, and recreation are driving population shifts
The map of these demographic shifts shows some familiar pre-pandemic trends and some new patterns. Overall, the Sunbelt and the Mountain West continued to outshine the rest of the country. Remote rural counties in eastern Oregon and northern Idaho experienced robust population growth while every single county in Nevada gained population. This is also where some of the country’s most successful small urban counties can be found, including Ada County, Idaho (Boise), Washoe County, Nevada (Reno), and Utah County, Utah (Provo). California experienced a dramatic shift to the interior of the state from the coast with counties like Kern (Bakersfield) experiencing the first positive domestic migration of the decade. Outside of major cities, the upper Midwest performed well as did New England.
The Great Plains struggled to retain population with Oklahoma being a clear exception. Its two major urban counties and the surrounding region all saw gain in population. The upper Midwest performed better than the lower Midwest overall, but both areas had few urban counties that gained population with Allen County, Indiana the biggest exception. The St. Louis metro provides an interesting example of state policy effects with the exurban counties on the Missouri side experiencing growth while those on the Illinois side lost population.
In the South, many large urban counties lost population while their surrounding exurbs and suburbs drew in more people. Notable examples include Davidson County, Tennessee (Nashville) and Fulton County, Georgia (Atlanta). Wake County, North Carolina (Raleigh) was an exception. It saw robust growth along with North Carolina’s three other large urban counties: Wake (Charlotte), Guilford (Greensboro) and Durham. The sprawling metropolitan areas in Texas and Florida also did quite well even as their urban core counties like Harris County, Texas (Houston) and Miami-Dade County, Florida (Miami) hemorrhaged population.
The Northeast experienced robust rural and suburban population growth in eastern Pennsylvania and New England while all of its large urban counties lost population. In the New York City metropolitan area, the counties further out outperformed those closer in. A similar pattern can be seen in the D.C. metro region with the District and its surrounding suburban counties all shedding population while exurban and rural counties in Maryland and Virginia racked up population gains. This is further evidence that Americans were trying to put substantial distance between themselves and the country’s urban centers.
One year of data is insufficient to draw any sweeping conclusions about the future of American cities. These places are hubs of dynamism and reinvention that have persevered through a multitude of economic and demographic shocks. Nonetheless, the share of Americans living in a suburban or exurban county has steadily increased from 22 percent in 1970 to 27 percent in 2021, while the share in an urban county has remained largely unchanged. And many of these urban counties include large swaths of suburbia and even extend into rural areas. Maricopa County, Arizona is more than five times the physical size of Cook County, Illinois (Chicago) and includes most of the suburbs surrounding Phoenix.
While 2021 may seem exceptional, and in many respects it was, it served to accelerate demographic trends in place before the pandemic. The momentum of cities clearly crested in the early 2010s and they may have a long road ahead to regain that momentum. Some shocks such as the widespread embrace of remote working relationships are starting to feel lasting and represent powerful forces for pushing economic activity out of urban hubs, especially the highest-cost ones. However, some things like immigration are within our control and policy-dependent, too. The future health of cities will depend on expanding the pipeline of skilled immigrants and addressing the housing stock and affordability crisis that makes living in far flung suburbs the cheapest option for many Americans.
Definitions
Large urban counties intersect with an urban area with a population of 250,000 or higher. If multiple counties intersect the same urban area, the county with the highest population density was selected. Small urban counties intersect an urban area with a population of 100,000-250,000. If multiple counties intersect the same urban area, the county with the highest population share in a midsize city based on NCES definitions, is classified as small urban and the other counties as suburban. Suburban counties have an urban area with a population of 50,000 to 100,000. At least 25 percent of the population must be in a large or medium-sized suburb, based on NCES definitions, otherwise it’s classified as exurban. If no population at all is in a large or medium-sized suburb, then it’s classified as rural. Exurban areas have a population smaller than 50,000, at least 25 percent of their population in a large or medium-sized suburb and must be in a metro with a population of 500,000 or higher. All remaining metropolitan counties are classified as metro rural and all non-metropolitan counties are classified as non-metro rural.


