Note: EIG has previously written on rounds one and two of the Paycheck Protection Program (PPP) and continues to track data updates from the SBA. Follow us @InnovateEconomy for the latest updates and analysis.
The SBA recently released comprehensive data that combines both rounds of PPP funding, covering from the program’s launch on April 3 up through May 30th. The analysis below compares this new cumulative data with data on the initial round of PPP in order to examine how the program has evolved over time and how it has been disbursed by lender size, state, and industry. We find that some initial imbalances across industries have evened out over the course of the program, while imbalances across states have moderated only somewhat.
Topline Comparisons
- On the whole, PPP data demonstrate the program’s extensive reach. Cumulatively, 4,475,599 loans have been made from 5,454 lenders, with a grand total of $510 billion dollars approved. The size of the average loan has fallen since the program began. In the first round of PPP funding, the average loan size was $206,000; it has now fallen to $114,000. Data from a separate Census Bureau survey suggest that 71 percent of small businesses have received financial assistance from the program.

Lenders
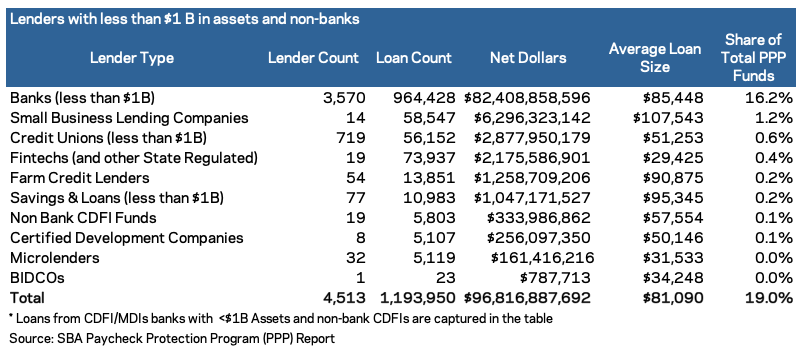
- The SBA reports now include data on lending from community development financial institutions (CDFIs), minority depository institutions (MDIs), and small banks. These data are intended to highlight the role of smaller lenders and non-traditional financial institutions targeting disadvantaged populations in the disbursement of PPP funds. CDFIs and MDIs have disbursed 3.1 percent of all PPP funding, and lenders with less than $1 billion in assets and non-banks account for nearly 19 percent of all funding.

—
States
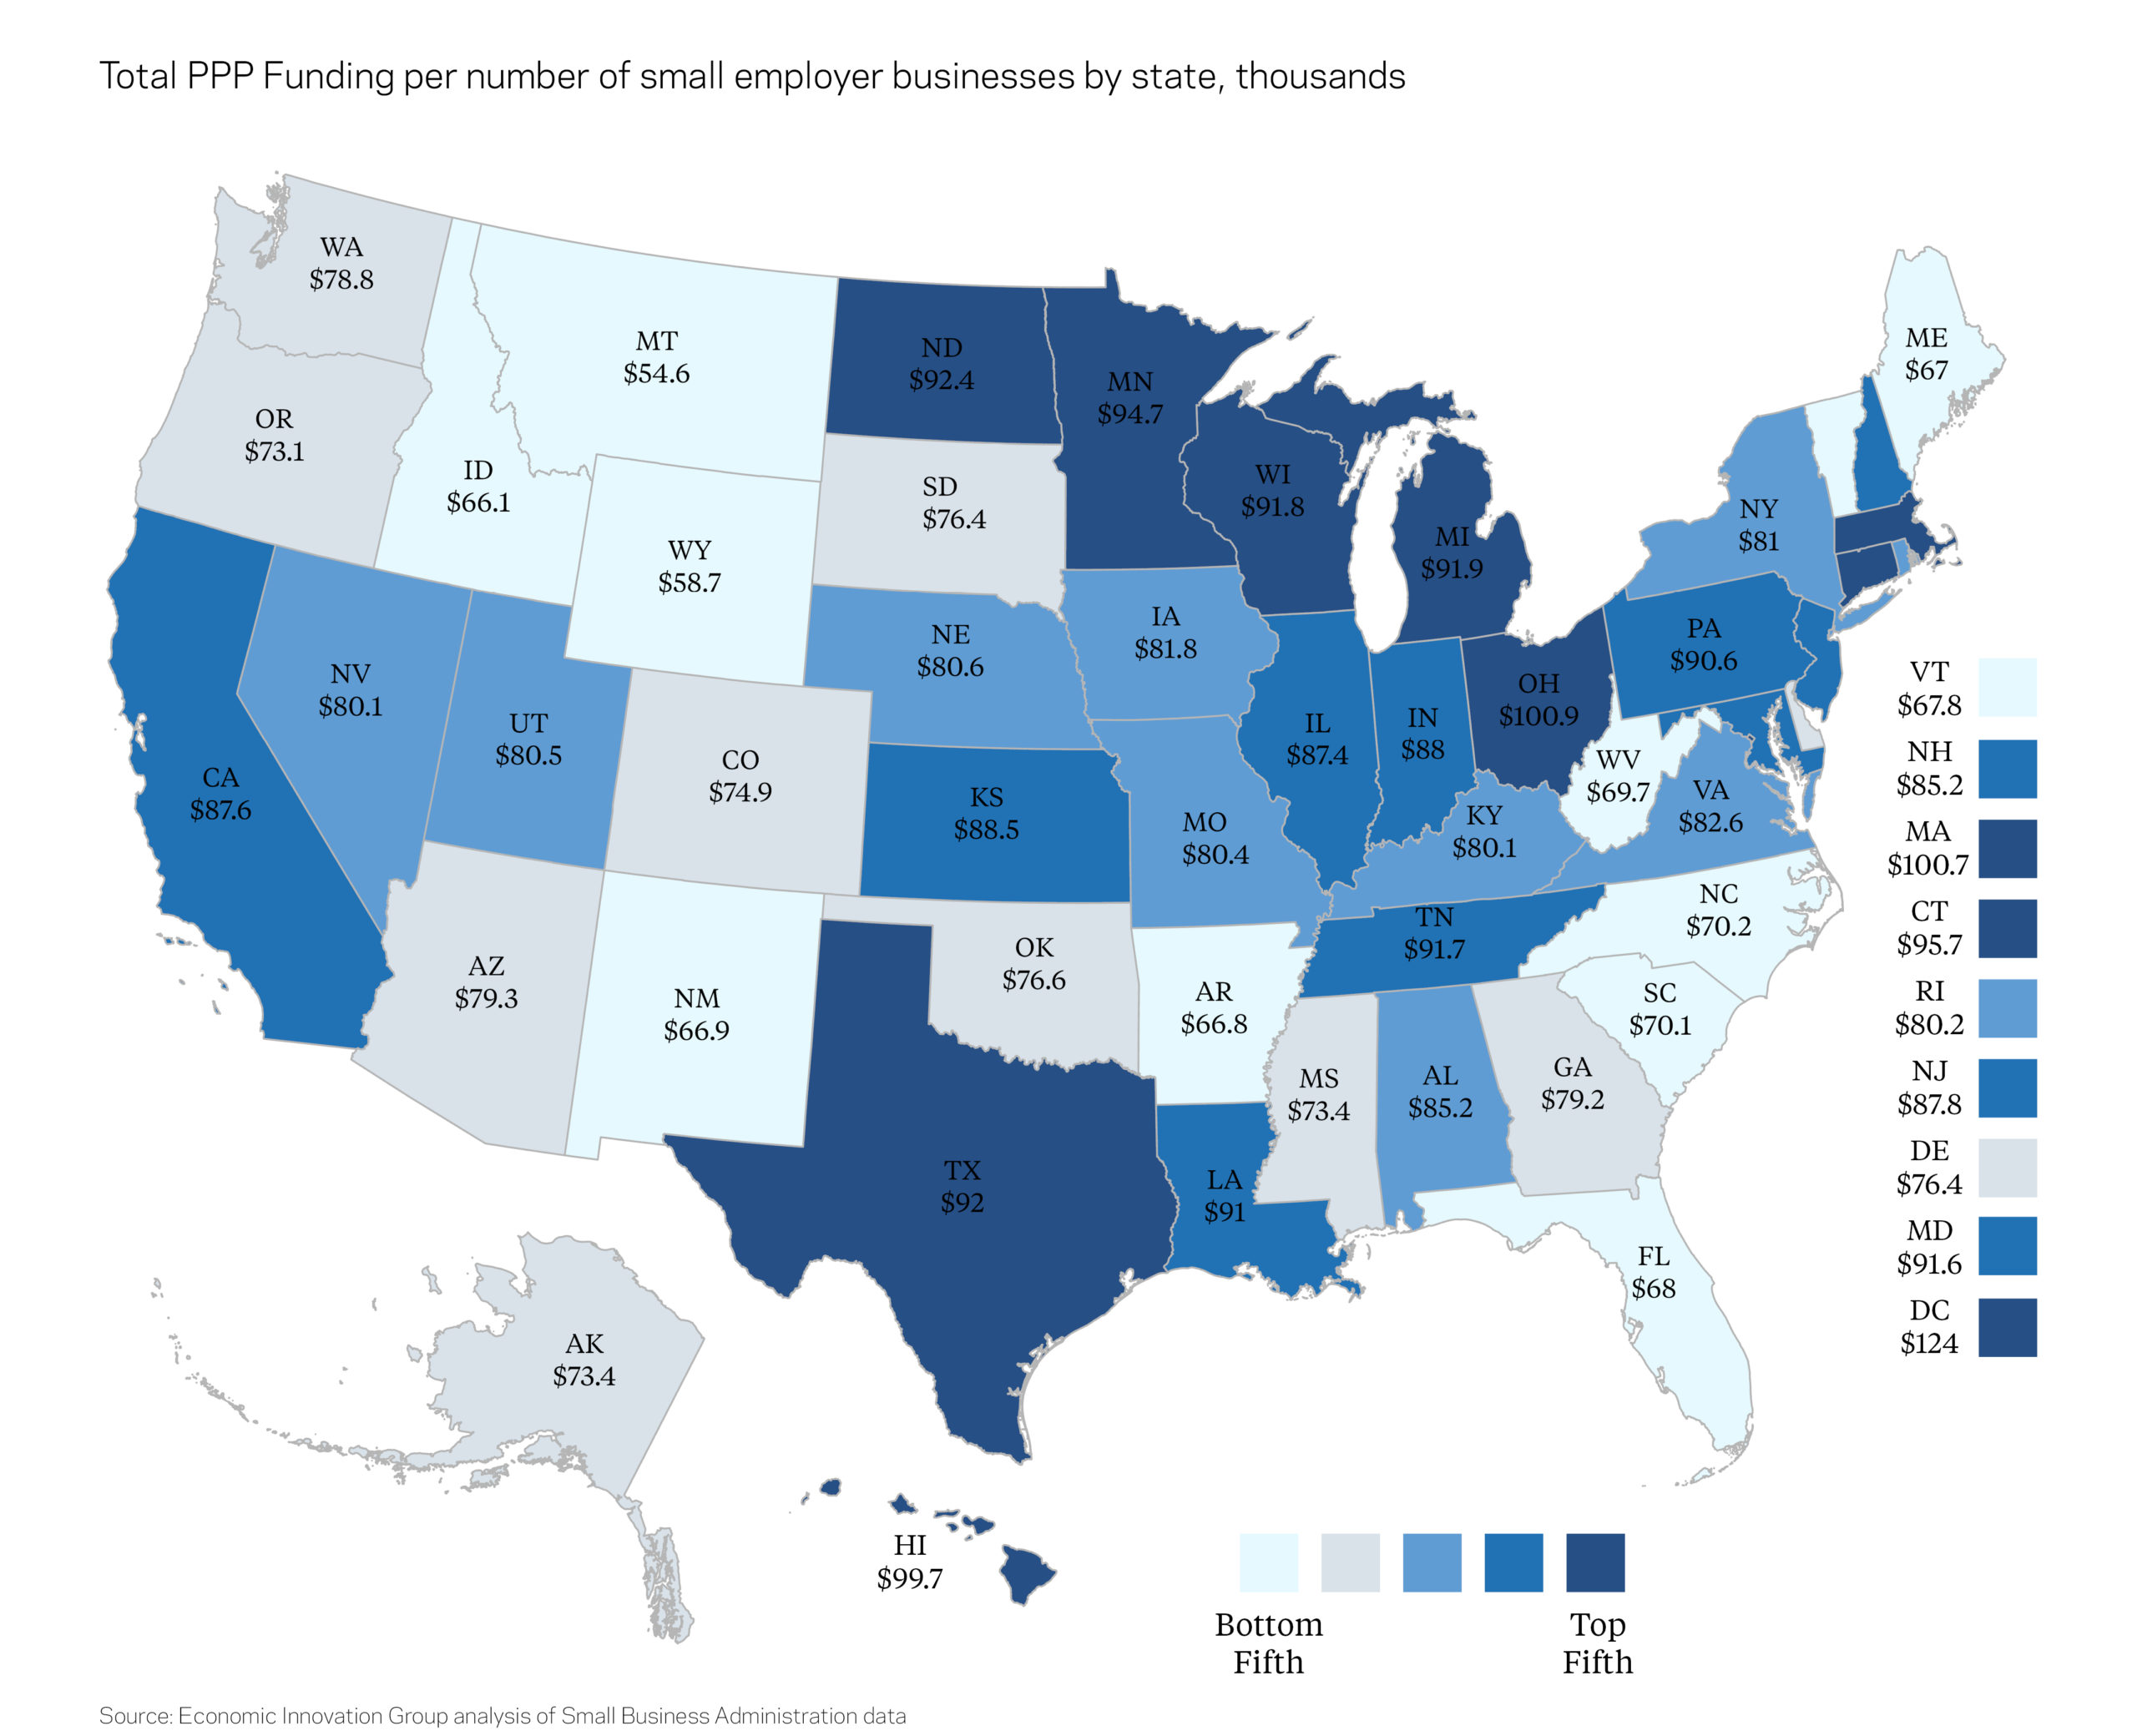
- The map of states with the highest amount of PPP funding per the number of small employer businesses shows that the District of Columbia, Ohio, Massachusetts, Hawaii, and Connecticut have all received a proportionately high amount of PPP funding compared to the number of small businesses in each state.
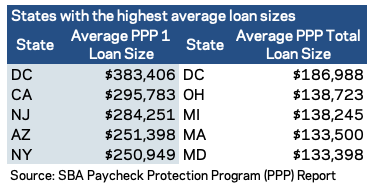
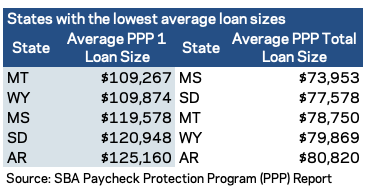
- Average loan sizes have evolved significantly over the course of the program. Initially, hard-hit, high-cost, big states such as California, New York, and New Jersey recorded the highest average loan sizes. By May 30th, average loan sizes were also running high in the manufacturing-intensive midwestern states of Ohio and Michigan, as well as prosperous, high-cost DC, Maryland, and Massachusetts. The mostly rural, low-cost states with the lowest average loan sizes have shifted much less throughout the lifespan of PPP. Average loan size is an important metric because it offers a proxy for how many very small businesses the program has reached, although the measure is also influenced by industry and prevailing cost levels.
—
Industries
- The top five industries with the highest amount of approved PPP funds have not shifted significantly as the program has evolved, although relative standing among the top industries has changed somewhat. The health care and social assistance group currently has the highest amount of approved PPP funding, and construction, manufacturing, and accommodation and food services also have received a high amount of PPP funding.

- The top five industries with the largest number of PPP loans have varied slightly throughout the course of the program, although the professional services group continues to have the greatest number of approved PPP loans.

- Manufacturing, utilities, mining, and management continue to have the highest average loan sizes. Additionally, wholesale trade now exhibits high average loan sizes, which may point to supply chain disruptions in light of the evolving economic fallout from the pandemic.

- Industries with the smallest average loan sizes have not shifted significantly throughout the course of different rounds of PPP. These small loan sizes may reflect that there are a large number of very small businesses in these industries.

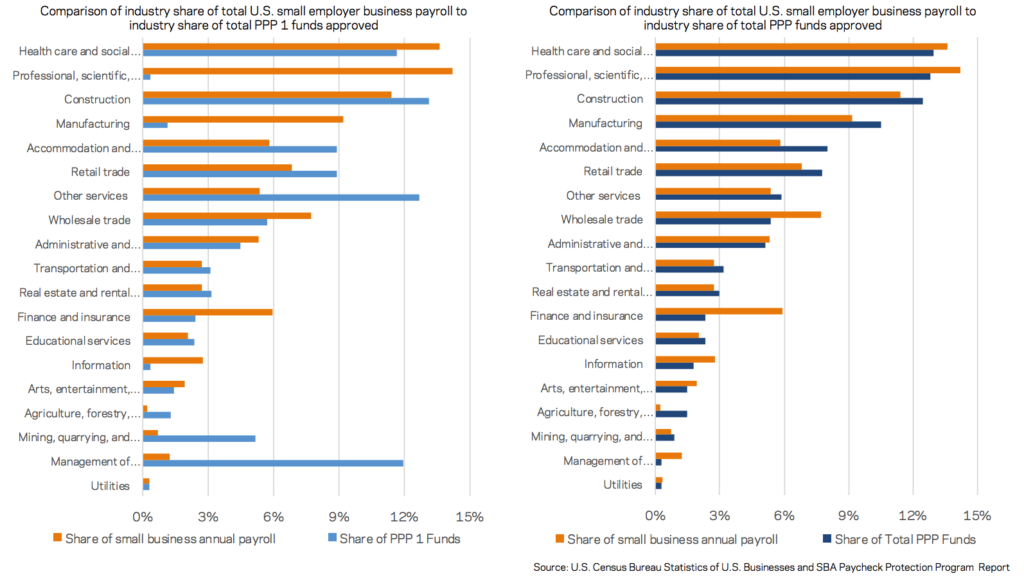
- In general, PPP has become roughly more proportional over time with respect to industry share of total small business payroll compared to industry share of total PPP funds. While the professional services group received disproportionately little initial PPP funding relative to its share of small business payroll, it has risen significantly. Initially, other services (which includes dry cleaners, salons, and repair shops) received a disproportionately high share, though now it has fallen closer in line with its share of total small business payroll.
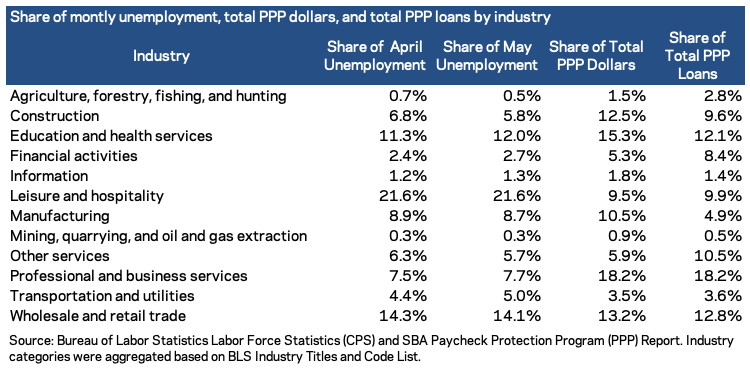
- Comparing the distribution of PPP funding and loans to the distribution of unemployment across industries is complicated by large differences in average wages but in general, suggests that PPP’s big beneficiaries are a mix of industries deeply affected by the pandemic’s economic fallout and others relatively insulated from it. The hard-hit leisure and hospitality industry looks underrepresented in terms of loans and funding, but some of the gap at least in dollar terms could be explained by the low wages that prevail in the sector. The manufacturing industry’s low loan share may be attributable to the large size of applicants; the industry’s share of funding is much closer to its share of monthly unemployment. Conversely, the other services industry consists of many small proprietors providing local services; its share of loans is accordingly higher than its share of total funding. Financial activities and professional services appear to be the two industries that have disproportionately high PPP uptake and disbursements relative to the share of total monthly unemployment, as well as construction and, to a lesser extent, agriculture and mining.
PPP has extended a critical lifeline to the country’s small businesses and achieved an extraordinary reach given the circumstances and urgency confronting the U.S. economy. However, broad eligibility regardless of need, poor alignment with the cost structure of some businesses, and practical reliance on pre-existing banking relationships have all limited the efficiency of the program’s targeting and the ability of some of the most at risk businesses to take advantage of it.


