The SBA recently released data on the second tranche of the Paycheck Protection Program (PPP), covering the period of April 27th through May 8th, allowing us to examine changes in how the program’s funding is deployed into the market. Treasury and SBA have continued to update PPP guidance and procedure to address loan size and more clearly target small businesses in need. Additionally, in replenishing the PPP in April, Congress set aside PPP funds for lending by Community Development Financial Institutions and Minority Depository Institutions. The tables below highlight differences between the first and second rounds in terms of loan size, loan numbers, geographic distribution, and lenders.
Topline comparisons
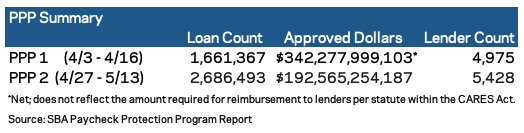
- In terms of sheer volume, over 1 million more individual loans have been approved in tranche two than were in tranche one, even though, to date, only $192.6 billion has been approved under tranche two, compared to $342.3 billion in tranche one.
Loan Sizes
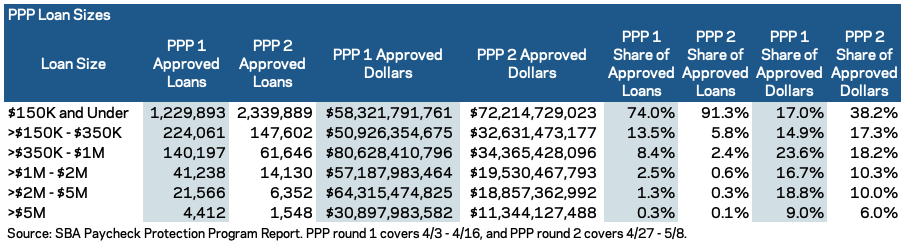
- Tranche two has seen significantly more loans in small dollar amounts. In tranche two, 91 percent of loans were of amounts under $150,000, compared to 75 percent in tranche one. In dollar terms, the under-$150,000 loan share in round two was more than double the share in round one; standing at roughly 38 percent and 17 percent, respectively. These differences are reflected in the overall average loan size for the two tranches: The average loan size in PPP’s first round was $206,000, while it was $72,000 in the second round.
Geographic Distribution of Funds
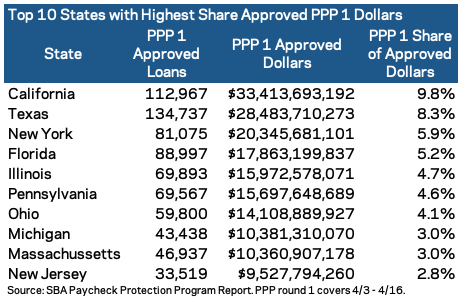
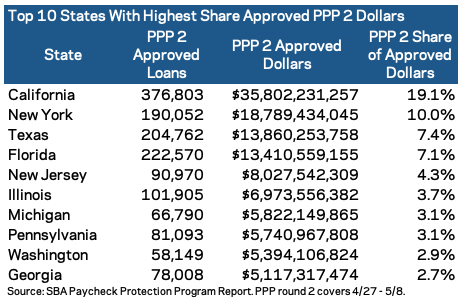
- On a per capita basis, populous states received relatively little PPP funding in tranche one. That changed in tranche two, as the share of PPP dollars approved nearly doubled in California and New York. Other states that saw proportionately little funding in round one, such as Florida and New Jersey, experienced a significant bounce in round two as well.
—
Lenders
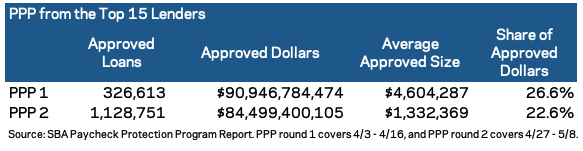
- The top 15 lenders have approved approximately 800,000 more loans so far in tranche two than they did in tranche one, even though the total amount of funds they approved was smaller. In terms of funding, the top 15 lenders accounted for 22.6 percent of PPP funds in tranche two while they accounted for 26.6 percent in tranche one. This is reflected in the fact that the average approved loan size from a top 15 lender was about 70 percent smaller in round two. In other words, the big lenders issued far smaller loans, presumably catering to smaller businesses in the process, in round two than they did in round one.
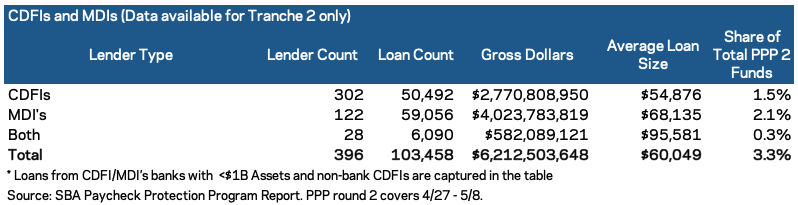
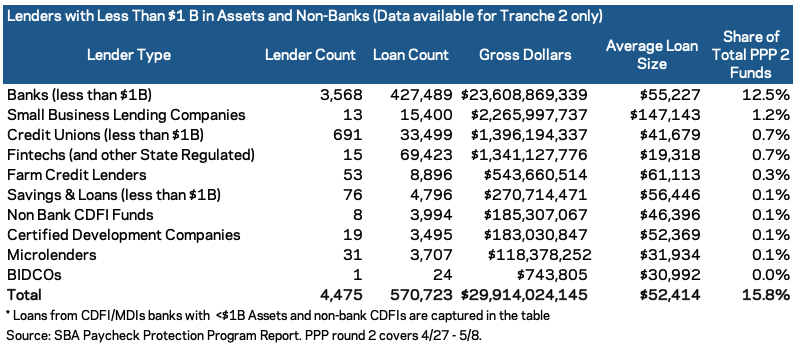
- SBA provided data on CDFI, MDI, and small bank lending in the release of the second round of data, but not the first. Accordingly, it is not possible to compare these figures across the two tranches, but these data highlight the role of smaller lenders in the program.
—
While these data suggest marginally better targeting of PPP lending across regions and types of firms in the program’s second stage, several shortcomings in its design remain unresolved. The fact uptake of the program has slowed even as the economic pain of the pandemic becomes more acute offers clear evidence of the need for further reforms.