By Jimmy O’Donnell
Last week, the Small Business Administration released new Paycheck Protection Program (PPP) loan data. This release—the result of a Freedom of Information Act (FOIA) request by several media organizations—contained details such as loan size, business address, sector, and the number of jobs retained for loans under $150,000. (Previously, this level of detailed information was only provided for loans in excess of $150,000.)
This data allows us to explore the precise distribution across communities of the nation’s leading small business relief program in response to COVID-19. When PPP loans are mapped onto EIG’s Distressed Communities Index (DCI), two important takeaways stand out. First, PPP loans were relatively proportionally distributed across prosperous and distressed communities. Second, distressed communities do not appear to have been systematically excluded from relief in the first tranche of PPP; in fact, distressed communities made up a larger share of PPP loans (whether measured by total dollars or total loans) in the first tranche of loans than they did in the second.
On the first point, we find that 31.0 percent of all PPP loans and 30.5 percent of all PPP dollars were allocated to the top quintile (defined as the one-fifth of ZIP codes that were rated the most prosperous by the DCI). Although that may seem disproportionate, it is important to note that the top quintile is home to 25.8 percent of the U.S. population and, even more relevant, 28.8 percent of all business establishments. (Note that there are substantial difficulties in defining the exact universe of PPP eligible business entities as discussed here; we rely on the universe of all business establishments captured in the Census Bureau’s Business Patterns datasets as a generalized approximation). So, although prosperous communities still received more money than either of those metrics would have predicted, the gap is modest—and may actually track closely with the map of local need: Research by Opportunity Insights earlier this year found that small businesses in affluent areas were among the most affected by pullbacks in consumer spending and in-person commerce.

By contrast, the bottom quintile (i.e., the most distressed one-fifth of ZIP codes) received proportionately less funding than their population would have predicted, but only marginally less than initial establishment counts would have predicted. We find that the most distressed quintile, which represents 15.8 percent of the population and 12.7 percent of establishments, received 11.6 percent of all loans and 11.9 percent of all PPP dollars. Thus, this nationally comprehensive look challenges some of the received wisdom that low-income communities were systematically excluded from accessing PPP. (Crucially, these statistics are averages, and there has been research and evidence highlighting localized exceptions and failures, including for Black small business owners in the DC region).
A second important finding has to do with the role that timing played in the distribution of loans. As has been previously documented, PPP loans were disbursed in two waves: the first was for loans approved between April 3 and April 16, 2020. The second tranche began on April 27, after Congress appropriated another $300 billion to the program, and accepted loan applications through August 8, 2020.
As shown in the table below, each quintile—from prosperous to mid-tier to distressed—received a relatively proportional share (as proxied by their share of business establishments) of PPP dollars and total loans in the first tranche. For example, prosperous areas represent 28.8 percent of establishments and they received 29.4 percent of all PPP dollars and 30.1 percent of all PPP loans in the first tranche (i.e., loans approved before April 16, 2020). For distressed communities, the story was similar: they account for 12.7 percent of all business establishments and received 12.9 percent of all PPP dollars and 12.7 percent of all PPP loans in the first tranche.
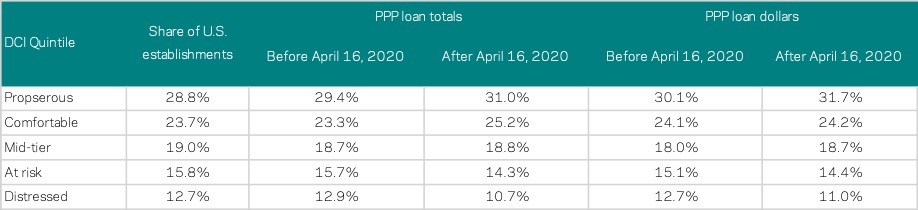
However, worse-off quintiles represented a smaller share of PPP dollars and loans in the second round. For example, although distressed communities represented 12.0 percent and 12.7 percent of PPP dollars and loans, respectively, in the first tranche, they only represented 10.7 percent and 11.0 percent of each in the second tranche. The opposite is true for more prosperous areas. This may suggest that the unmet demand for initial PPP relief specifically was actually greater in more prosperous areas.
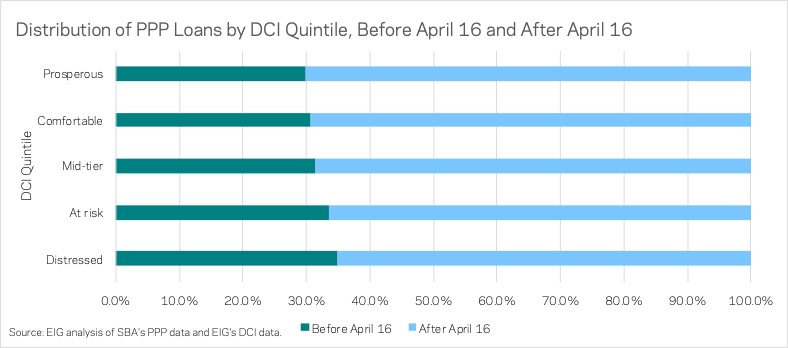
Another way to see how distressed communities fared is to look at the distribution of each quintile’s loans between the first tranche and the second. On the whole, we find that distressed communities actually received a larger share (35.0 percent) of their loans in the first tranche, compared to 29.9 percent for prosperous communities. However, there were sizable differences between distressed urban and distressed rural communities. Ailing rural areas received about 45 percent of their PPP allocations in round one, compared to only 27 percent in distressed urban areas. Those relatively limited early flows of relief to struggling urban America do suggest that policy tweaks to round two might have facilitated the flow of more capital to these traditionally underserved neighborhoods.
In sum, the release of detailed PPP loan data has provided important new insights into the program’s distribution to local communities. In this analysis, we find that the allocation of PPP loans—whether measured by total loans or total dollars—among American communities according to their underlying well-being largely matched the distribution of business establishments across those places; to be sure, prosperous areas received more and distressed areas less, but the overall allocation of PPP was relatively proportional. Nationally and as a group, distressed communities do not appear to have been systematically underserved by the program, although struggling urban areas did receive comparatively little PPP relief in the first tranche of support.
Despite acknowledged shortcomings of the program, PPP was effective in providing immediate assistance to small businesses in the early days of the COVID-19 pandemic, including to businesses located in distressed communities. With Congress now debating the details of a new relief package, this analysis offers reasons to believe that another round of PPP, if adequately funded and targeted to businesses in need, would be an effective means of providing short-term relief to small businesses across all types of American communities.