Newly-released data from the U.S. Census Bureau provide the clearest look yet at the country’s economic and demographic landscape at the start of the Opportunity Zones incentive in 2018, when governors across the country were nominating census tracts for inclusion in the policy. The latest numbers underscore the stark socioeconomic divide between the local conditions for 31.5 million Opportunity Zone residents and the rest of the country.
The American Community Survey 5-year Estimates for the 2014-2018 period released in December 2019 show modest improvement relative to the lagging data that was available at the time governors nominated tracts. Nevertheless, the new figures confirm that the bulk of Opportunity Zones were severely economically distressed at the time of nomination even relative to other low-income communities, and remain among the highest-need communities in the United States when examined against common measures of economic well-being.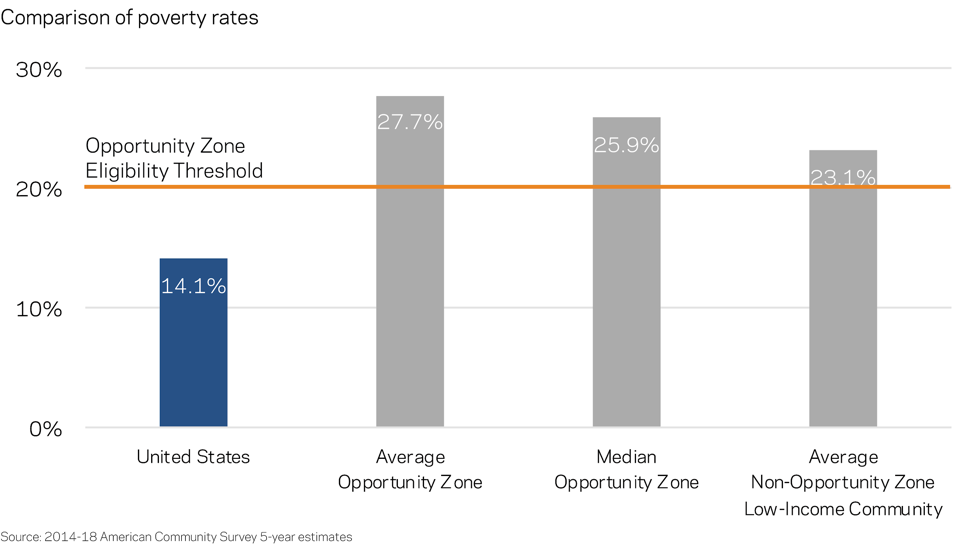
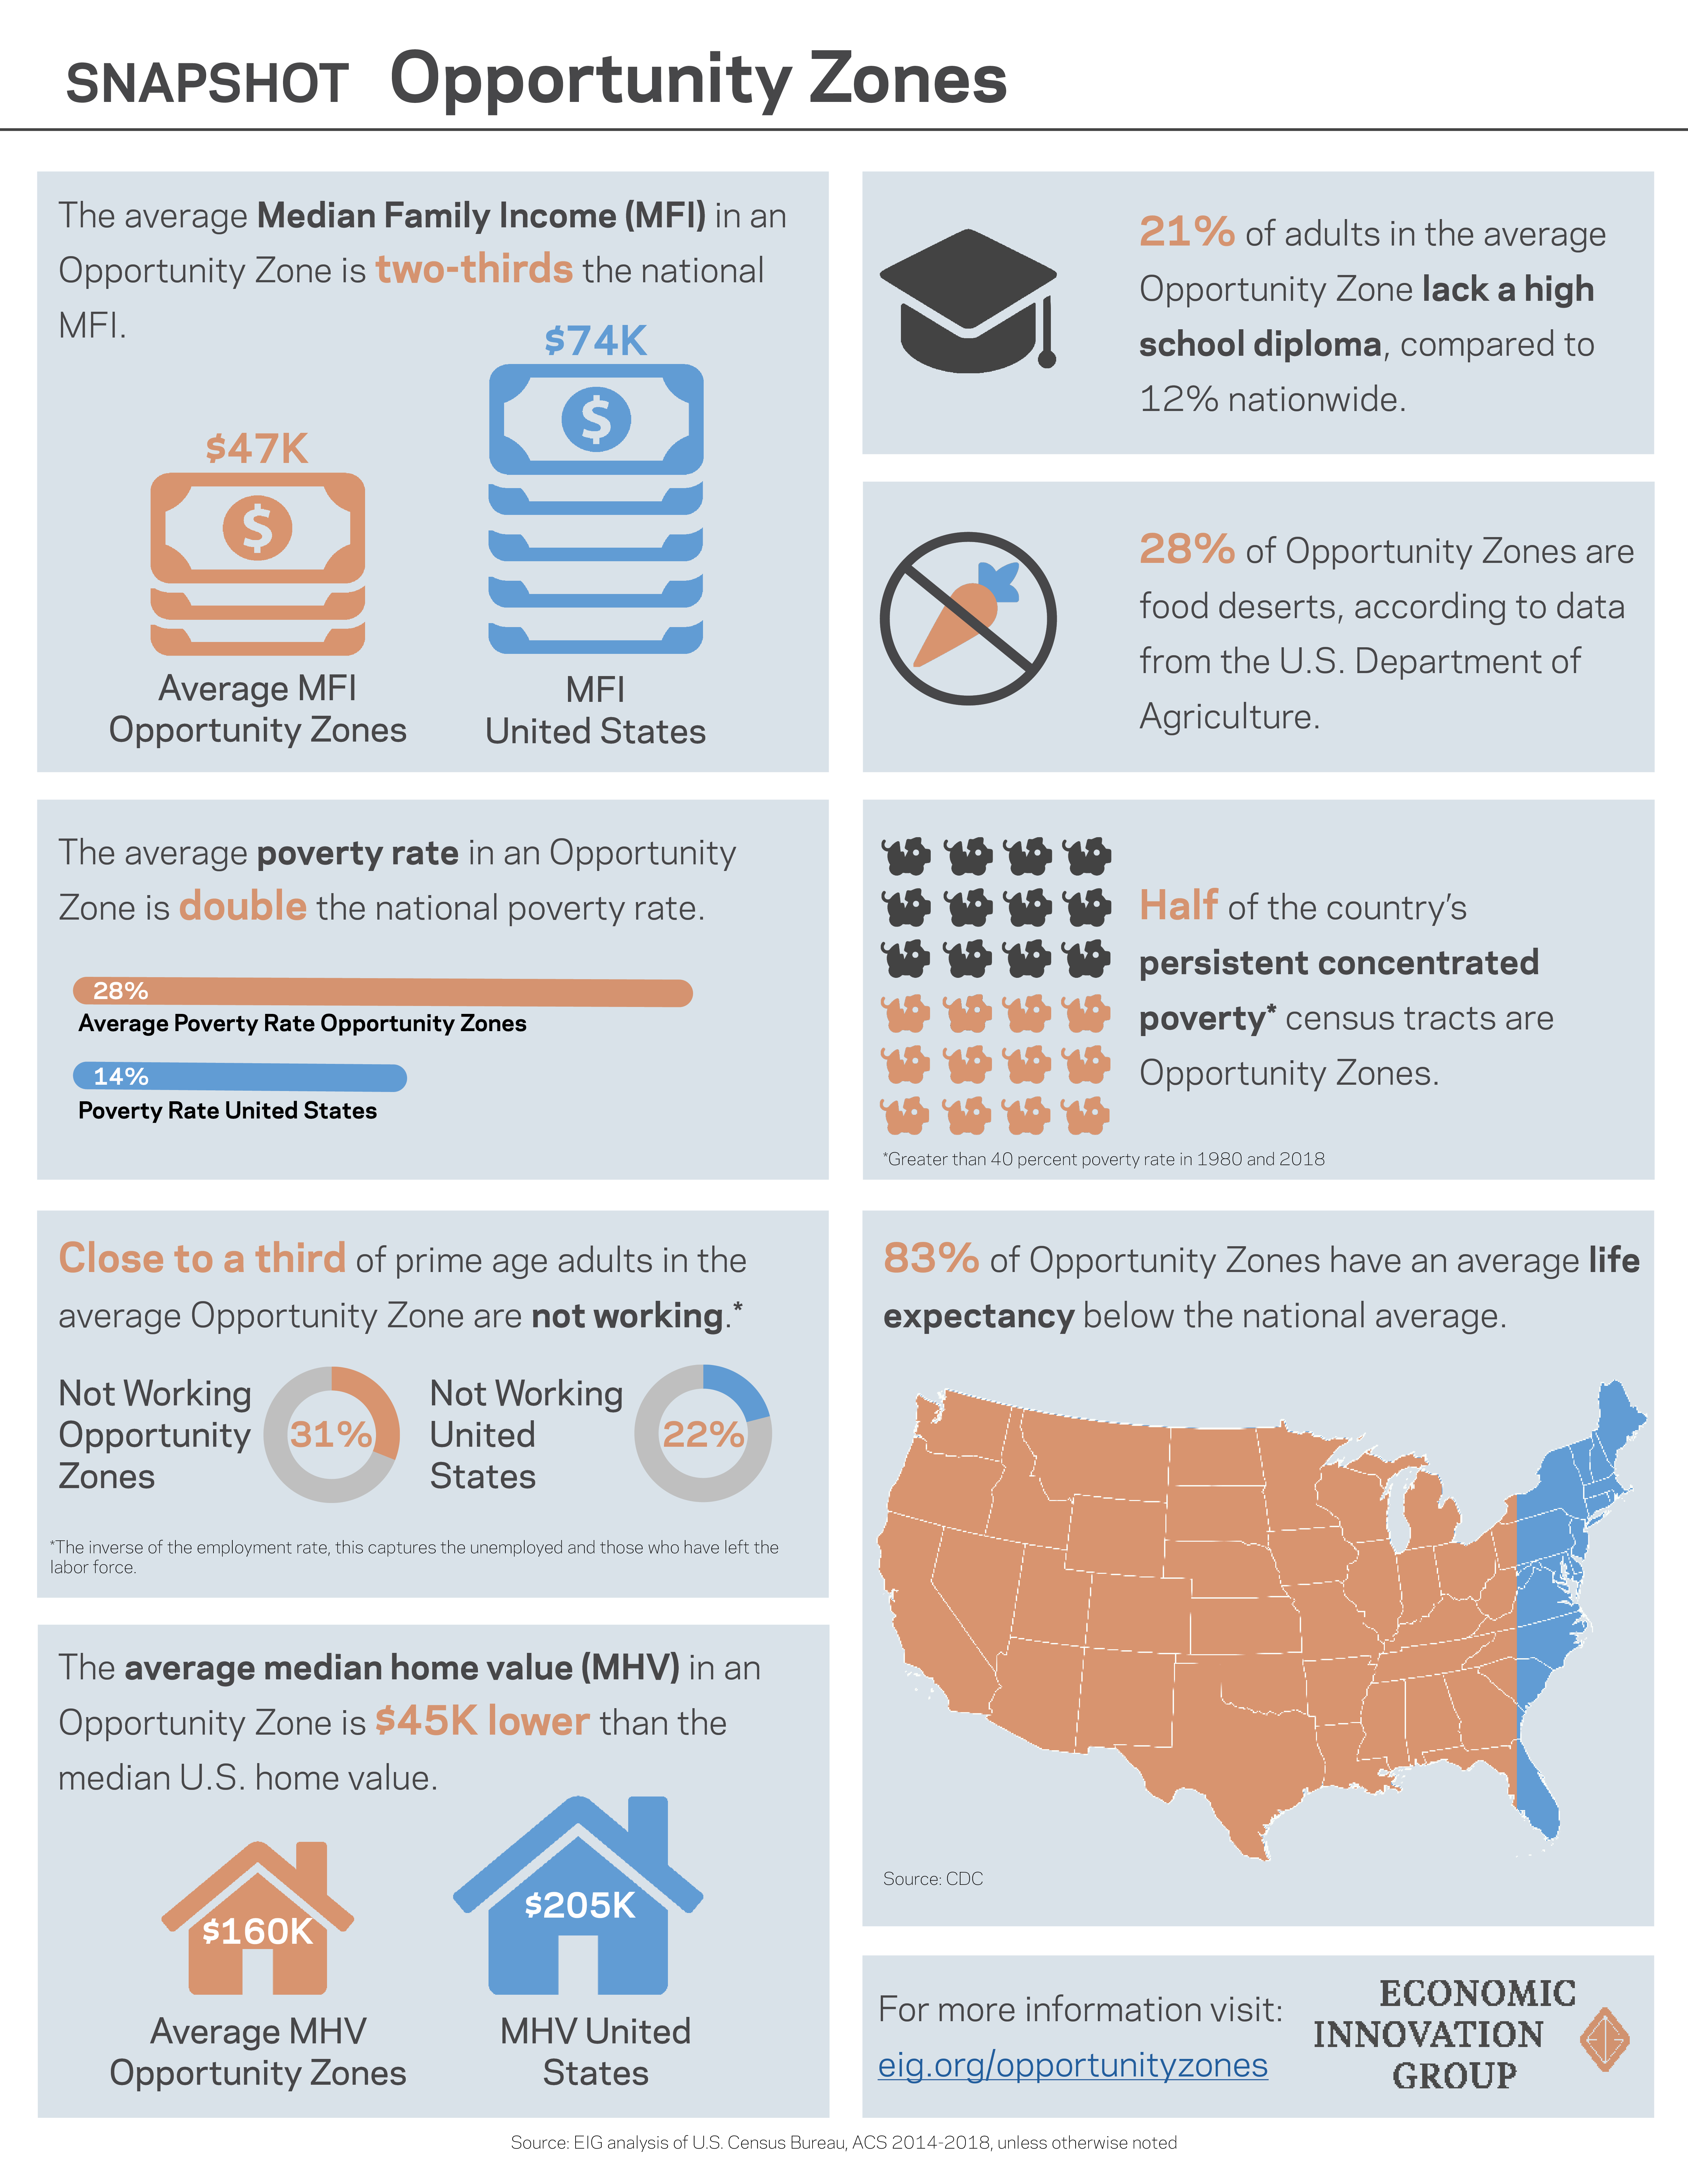
The latest figures report an average poverty rate among Opportunity Zones of 27.7 percent, nearly double the rate nationally, and well above the 20 percent eligibility threshold required by statute. The typical non-Opportunity Zone low-income community recorded a somewhat lower rate of 23.1 percent, demonstrating that governors generally used their nomination authority to target higher-need areas for the incentive. In fact, on every key measure, the cohort of designated communities fares worse than the cohort of eligible low-income communities governors did not select. Nevertheless, a small share of designated communities are relatively high-income areas with strong local economies–places where the incentive is unlikely to have much effect on incoming investment.
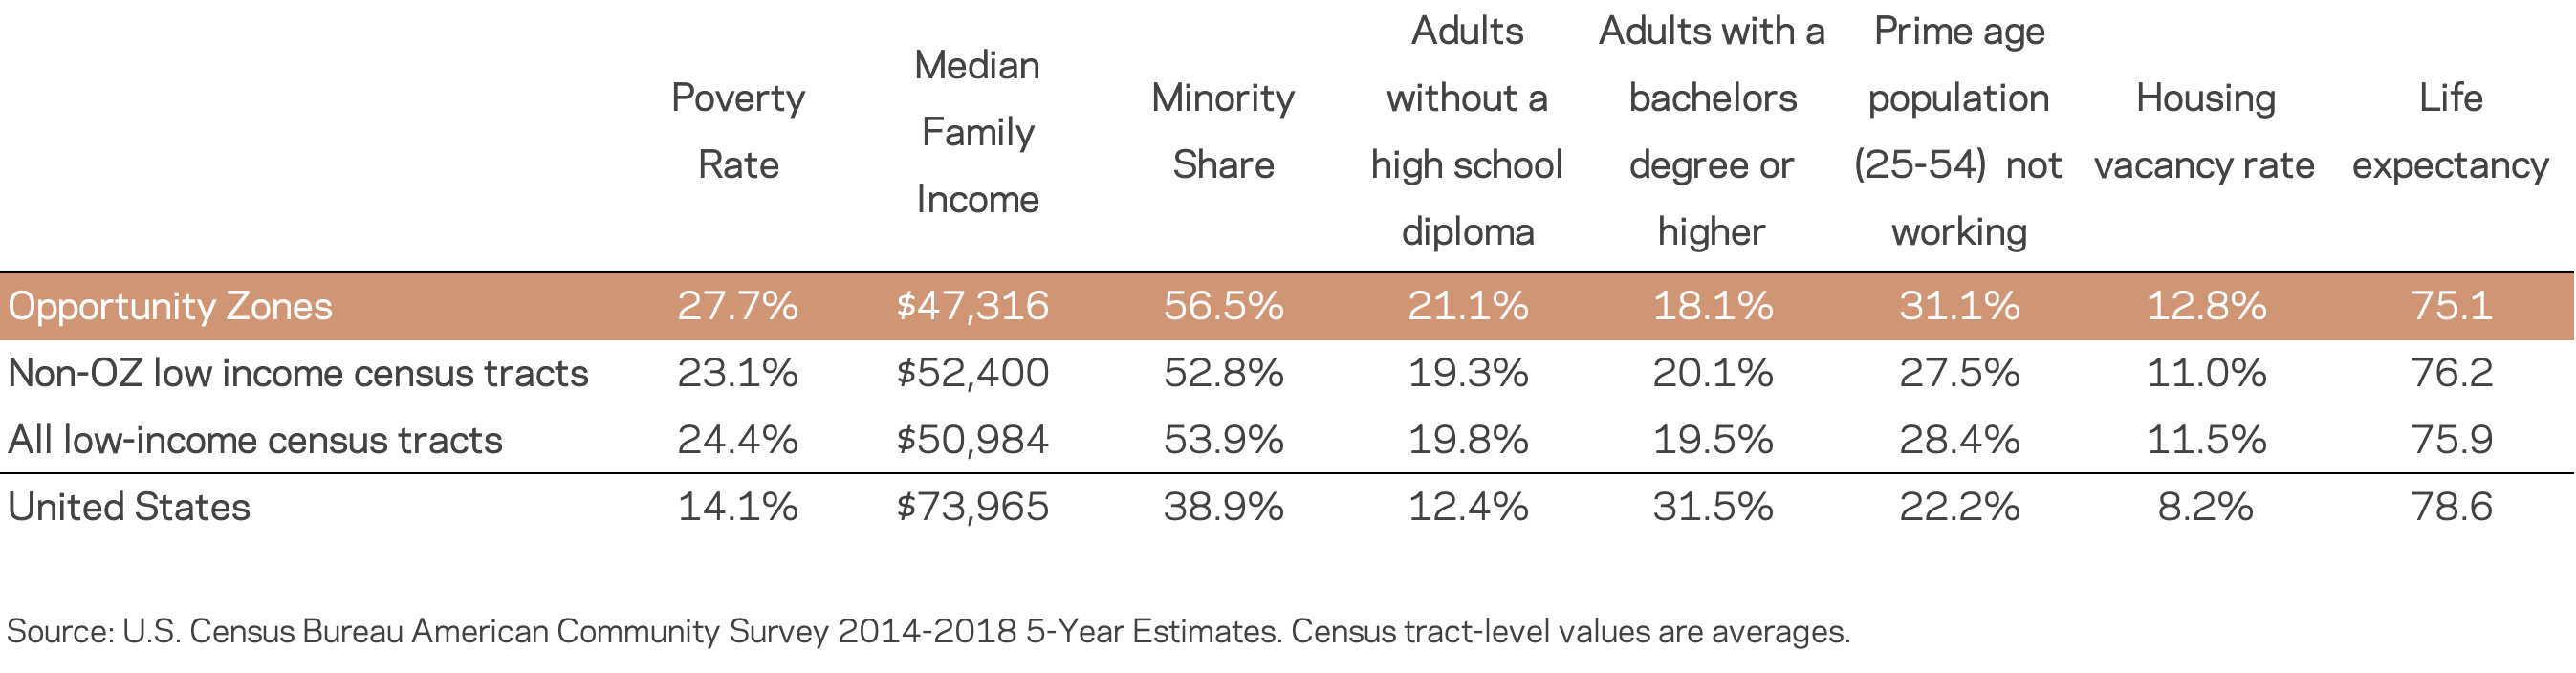
The table below shows how Opportunity Zones stack up in additional key metrics against all low-income census tracts, low-income census tracts that are not a qualified Opportunity Zone, and the United States overall for the 2014-18 time period.
Other key findings from the latest data, which we’ve compiled on our Opportunity Zones Facts & Figures page, include:
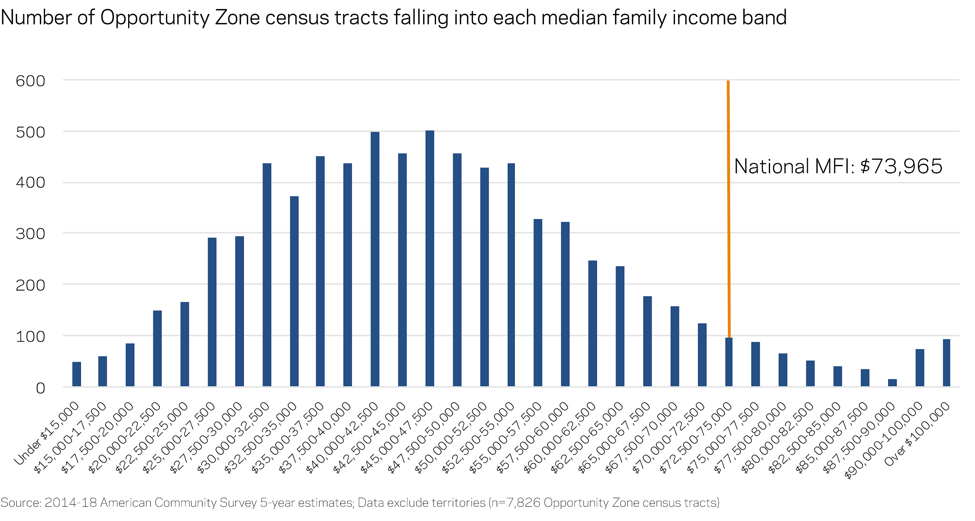
- The average median family income across Opportunity Zones was around $47,000, nearly $27,000 less than the national figure. That was also about 10 percent lower than the average low-income census tract not designated.
- More than 56 percent of Opportunity Zone residents belong to a racial minority, an outsized share relative to the national share of 39 percent. On average, 24 percent of Opportunity Zone residents are African-American, nearly double the national rate.
- In the typical Opportunity Zone, a greater share of residents lack a high school diploma than have a four-year college degree.
- Nearly a third of prime-age residents (25-54 years old) are not working, either because they are unemployed or because they have left the labor force altogether.
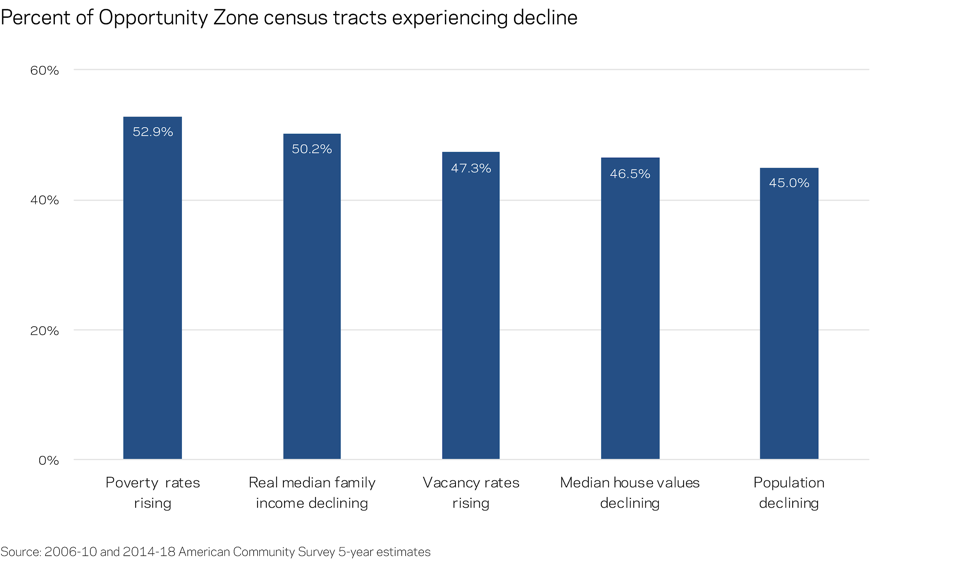
Large shares of Opportunity Zones have continued to experience active decline across a number of important metrics in spite of the country’s ongoing economic expansion–the longest period of sustained economic growth in modern U.S. history. Poverty rates increased in more than half of designated census tracts between the 2006-10 and 2014-18 time periods. At the same time, median family income declined in half of tracts, after adjusting for inflation. A significant share of Opportunity Zones are struggling across multiple measures of active decline. Nearly one out of five Opportunity Zone tracts were simultaneously experiencing a rising poverty rate along with declining median family income and home values. Generally lacking adequate investment and well-paying job opportunities, it perhaps should be no surprise that 45 percent of Opportunity Zone census tracts have recorded a drop in population in recent years.
It is important to underscore that, due to the lag in reported data, the latest figures do not yet capture the effect Opportunity Zones may be having on designated communities. Instead, they present the most complete picture to date of conditions at the time of designation. (Governors had only 2011-15 and 2012-16 data at their disposal when they nominated their Opportunity Zone census tracts in early 2018.)
In addition to the new Census data, the U.S. Treasury Department also released final regulations for Opportunity Zones in December 2019, providing much-needed clarity for investors and communities about how the incentive can be applied to address local needs. This comes as market activity across designated communities is finally showing signs of a major ramp-up. According to data tracked by professional services firm Novogradac & Company, Opportunity Fund managers reported a 50 percent increase in raised capital from December 2019 to January 2020 alone.
As the next chapter for Opportunity Zones begins, keep following EIG for market updates, new research, and community best practices. And check out the Opportunity Zone Activity Map to see noteworthy investments, fund models, and local initiatives springing up across the country.