


by John Lettieri and Connor O’Brien
The economic expansion following the Great Recession was the longest in U.S. history, adding net jobs for a record 113 consecutive months. Yet despite steady-if-unspectacular job growth and a run-up in the price of financial assets, a new report from the Congressional Budget Office (CBO) starkly highlights how little this prolonged stretch of national growth translated to a meaningful boost in wealth for low-income families.
In this analysis, we compare the recovery from the Great Recession to those of the mid-1990s and mid-2000s and discuss the broader failure of federal policy to help families at the bottom gain access to tools Americans have long counted on to build wealth. We find that, in contrast to prior recoveries, the recovery from the Great Recession saw the real value of retirement savings for families at the bottom of the wealth distribution decline outright. Although average home equity wealth at the bottom grew modestly for those who had it, access to this other long-cherished means of wealth-building fell for families in the bottom quartile.
The failure of a historically-long period of economic growth to generate substantial wealth accumulation for families at the bottom in spite of enormous federal subsidy highlights the urgent case for policymakers to address insufficient market access and poorly targeted incentives.
The overall wealth distribution grew more unequal in the aftermath of the Great Recession.
According to the CBO report, the overall stock of family wealth grew to $114.8 trillion in 2019, up $5.3 trillion from 2016 and $33.1 trillion since 2010 (in 2019 dollars). The CBO largely bases these estimates on those of the Survey of Consumer Finances (SCF) taken every three years going back to 1989, supplemented with its own valuations of defined-benefit retirement plans not included in SCF data.
Of the total $33.1 trillion net growth in family wealth between 2010 and 2019, $800 billion was captured by the bottom half of the wealth distribution. This is not a trivial sum and amounts to 58 percent growth in the wealth of the bottom 50 percent of families over 2010 levels, which outpaced the 45 percent rate of increase seen by the top 10 percent of American families. Nevertheless, total family wealth for the bottom half still remains below 2007 levels (in 2019 dollars). In sheer magnitude, the lion’s share of net new wealth–$25.7 trillion–accrued to the top 10 percent.
Overall, the bottom 50 percent of households reaped only 2.5 percent of the net growth in family wealth between 2010 and 2019. However, they fared much better later in the expansion as the labor market grew tighter, capturing 7.4 percent of the growth between 2016 and 2019, the most recent period measured by the SCF.
Retirement assets held by the upper half of the wealth distribution have soared in value while those at the bottom shrank.
Retirement accounts as an asset type are the largest source of aggregate wealth for American households at 37.4 percent, followed by home equity at 27.8 percent. Retirement assets–-including both defined benefit and defined contribution plans but excluding promised Social Security benefits–-grew modestly for the bottom quartile of families leading up to the Great Recession. In the recovery from the recession of the early 1990s, the bottom wealth quartile’s retirement assets grew faster than those owned by the rest of the wealth distribution. In the recovery from the early 2000s recession, retirement assets in the bottom quartile grew at a faster rate than those of all but the top decile. The aftermath of the Great Recession, however, was a different story. Average retirement wealth grew 34 percent for the 26th to 50th percentiles, 19 percent for the 51st to 90th percentiles, and 17 percent for the top ten percent of families between 2010 and 2019. At the same time, average retirement wealth for the bottom quartile fell 16 percent between 2010 and 2019.
In other words, despite a decade-long run-up in financial markets, the recovery from the Great Recession exhibited a very different distributional pattern in retirement savings from prior economic cycles. Middle class families and high earners grew their retirement assets substantially while, for the first time in decades, those at the bottom of the wealth distribution outright lost retirement savings. In addition, these figures only report average retirement assets for households that have any. In 2007, just 25.2 percent of families in the bottom quartile had any retirement assets at all. In 2019, only 23.6 percent of the bottom quartile had retirement assets, compared to 95.7 percent in the top decile of the wealth distribution.
The lack of retirement savings growth in the 2010s within the bottom quartile is not merely an artifact of the window of chosen data. Average retirement wealth in the bottom quartile stagnated or fell in each three-year interval covered by the SCF. In other words, the entire economic cycle–over which the value of the S&P 500 nearly tripled–failed to produce meaningful gains in retirement wealth and security for the bottom quartile of families.
Homeownership has been an effective means of building wealth for those who can access it, but families at the bottom are largely locked out.
Homeownership has for decades been one of the primary tools for wealth-building among American families. Compared with retirement savings, the recovery from the Great Recession was friendlier to families in the bottom quartile who own a home. Among those who have home equity, the average home equity in the bottom quartile of family wealth grew from -$13,900 (meaning the average family was “underwater” on their home in 2010) to positive $21,700 in 2019, the highest level going back at least to 1989. This amounts to more growth (in absolute terms) than the average family in the second quartile and the 51st-90th percentile buckets.
Despite recent growth—much of which was to be expected given how far home prices fell during the financial crisis of 2007 and 2008—the average home equity in the bottom quartile remains modest in comparison to higher income buckets. Even the average second quartile family has roughly three times the home equity wealth of the bottom quartile.
Further, these figures represent merely averages among those who have home equity. Among the bottom quartile, only 12.7 percent of families have any, down from 20.6 percent in 2010. Among the top 10 percent of families by wealth, over 96 percent have home equity, as do 89 percent of families in the 51st through 90th percentiles. Home prices have risen dramatically over the last decade—a trend that only accelerated in the aftermath of the Covid-19 pandemic—but with few families in the bottom quartile having access to homeownership, much of the country has been left behind.
The bottom end of the income and wealth distributions disproportionately lack access to key wealth-building tools.
Insufficient market access is a key barrier to lower-income families building wealth. Few families in the bottom quartile have any home equity. As many as six in 10 workers lack access to an employer-sponsored retirement plan, according to the U.S. Census Bureau. For low-income workers, lack of access is even more dire. Three-quarters of workers making under $40,000 per year don’t have access to an employer-sponsored retirement plan. A quarter of non-retired adults in the United States have no retirement savings at all.
Federal subsidies for retirement and homeownership exacerbate, rather than correct, the market failures underpinning inequality.
The federal government spends hundreds of billions each year through the tax code to subsidize wealth creation by reducing the income or payroll tax liability of households who make or receive contributions to retirement savings plans, take the mortgage interest deduction, or sell their primary residence. According to the CBO’s latest report on the size and scope of major federal tax expenditures, those related to both retirement and homeownership overwhelmingly benefit the top two income quintiles.
The CBO estimates that the income and payroll tax expenditures related to retirement savings totaled a whopping $276 billion in 2019 alone, making retirement the second largest category of all U.S. tax expenditures. Of that $276 billion, the top income quintile received benefits worth $160 billion, 58 percent of the total value of retirement savings-related tax expenditures. The share captured by the top two quintiles amounts to nearly 84 percent of all benefits. Those in the bottom 20 percent of household earnings received just 1.3 percent of the benefits from these tax expenditures.
The CBO highlights a few reasons why this distribution is so lopsided and why federal efforts to boost retirement wealth largely fail to reach the bottom half of the income distribution. First, lower income workers are far less likely to have access to, or take part in, an employer-sponsored savings plan. Only 19 percent of households in the bottom income quintile benefit from the exclusion for retirement account and pension contributions, in contrast to 77 percent of households in the highest quintile. Contributions to such accounts also tend to scale with income, with higher earners receiving larger contributions from employers. Finally, higher income quintiles are subject to higher marginal tax rates–making the prospect of deferring taxable income to their lower-earning retirement years more attractive. Low income households, however, are more likely to remain in the same tax bracket in retirement as in their working years and see less of a marginal benefit to deferring income. Therefore, even if access to retirement savings accounts were universal and all households had the same savings rate, higher-income households would benefit disproportionately from the ability to defer taxation on the proportion of income they put in those accounts.
The two primary homeownership-related tax expenditures are the mortgage interest deduction and the exclusion of capital gains from the sale of a primary residence. Of the $28 billion in federal revenue foregone as a result of the mortgage interest deduction in 2019, $23.4 billion of the benefit went to the top income quintile, while the bottom two quintiles’ total benefit sums to about $300 million. This is largely due to the fact that few households outside the top two income quintiles itemize income tax deductions, instead taking advantage of the standard deduction. A larger share of lower-income households are able to benefit from the exclusion of the sale of a primary residence from capital gains taxes, though the top two income quintiles’ benefits made up $24.7 billion of $35.1 billion in foregone federal revenue in 2019.
As with retirement savings-related tax expenditures, the lopsided distribution of homeownership-related tax expenditures is in part a story of uneven market access and in part due to the nature of exclusions in a system of progressive income taxes. Lower-income households are less likely to own a home, tend to have smaller capital gains from the sale of their home, and face lower marginal tax rates than high earners.
The wealth distribution is relatively static over workers’ careers.
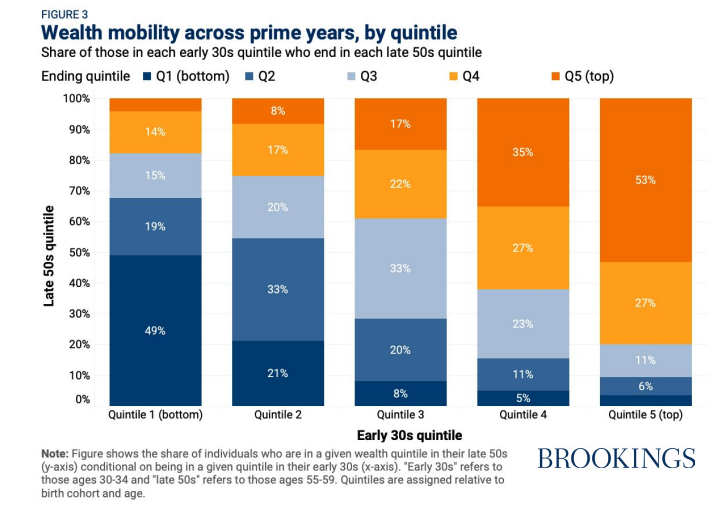
Given stark disparities in market access and federal tax benefits across the income distribution, it should perhaps not be surprising that most workers do not ascend to a higher wealth quintile over the course of their careers, according to a Brookings analysis of data from the Panel Study of Income Dynamics.
Among workers who, in their early 30s, begin in the bottom two quintiles of wealth for their age group, more than half remain in the bottom two quintiles in their late 50s. Fewer than 10 percent of those in the bottom two quintiles in their 30s are able over the course of their careers to climb to the top quintile.
Without an early start, wealth mobility becomes increasingly difficult. According to the Brookings study, among those who start their late 20s in the bottom quintile, 28 percent of workers rise to the top two wealth quintiles by their late 30s. In contrast, those entering their 40s in the bottom wealth quintile are much less likely to escape, and those entering their 50s in the bottom quintile even less likely. This finding highlights in particular the need to support wealth-building early in workers’ careers.
Conclusion
The federal government now spends over $300 billion per year through the tax code to subsidize Americans’ wealth in the form of retirement savings and home ownership. But rather than correcting market failures that disadvantage lower-income families, those expenditures exacerbate them instead. The trends noted in the recent CBO report are therefore not the inevitable outcome of American capitalism, but rather a reflection of poorly targeted policies that by design, if not intention, exclude most workers and families at the bottom of the distribution. Furthermore, we see that even a prolonged period of uninterrupted national economic growth no longer translates to the kind of boost in wealth for families at the bottom that it once did.
Policymakers should respond by expanding market access to proven tools for building wealth and ensure that federal incentives are designed in such a way that those at the bottom are not excluded.


