For most of the 21st century, Americans were told we were living
through a period of unprecedented economic change and
transformation. Record waves of startups and new technologies
were unleashing disruption across the economy. Headlines blared
about gig work and automation turning the labor market upside
down. So dizzying was the pace of change that we would need to
reimagine the future of work, the social contract, and even
capitalism itself. Reflecting the consensus, one prominent
senator declared that we were in the midst of “arguably the
largest economic disruption in recorded human history.”
But none of these claims was actually true. Instead, America was
mired in a period of unprecedented complacency. The very thing
that people were told to fear–rapid change and progress–had gone
inexplicably missing.
In fact, American dynamism was in a decades-long retreat.
Startup rates languished near all-time lows. Fewer companies
were going public. Corporate America looked old and complacent.
Increasingly, too, did American demography. U.S. productivity
growth dramatically decelerated in spite of promising new
technologies. And a country whose people were once known for
their restless, pioneering spirit became increasingly stuck in
place.
Simply put: America was losing its mojo.
But now, after a prolonged period of relative stasis, the
pandemic has jolted key indicators of economic dynamism–at least
temporarily–back to life. The labor market is churning as job
quits matched their highest levels on record in November 2021,
when 3 percent of the workforce quit in a single month. IPOs are
back to levels last seen in the heyday of the technology boom in
the late 1990s and early 2000s. Firms are pouring resources into
new technologies, developing new processes, and embracing new
work arrangements with their employees. And entrepreneurship
appears to be surging: in 2021, a record 1.8 million
applications were filed to start new “likely employer”
enterprises–37 percent more than in 2019.
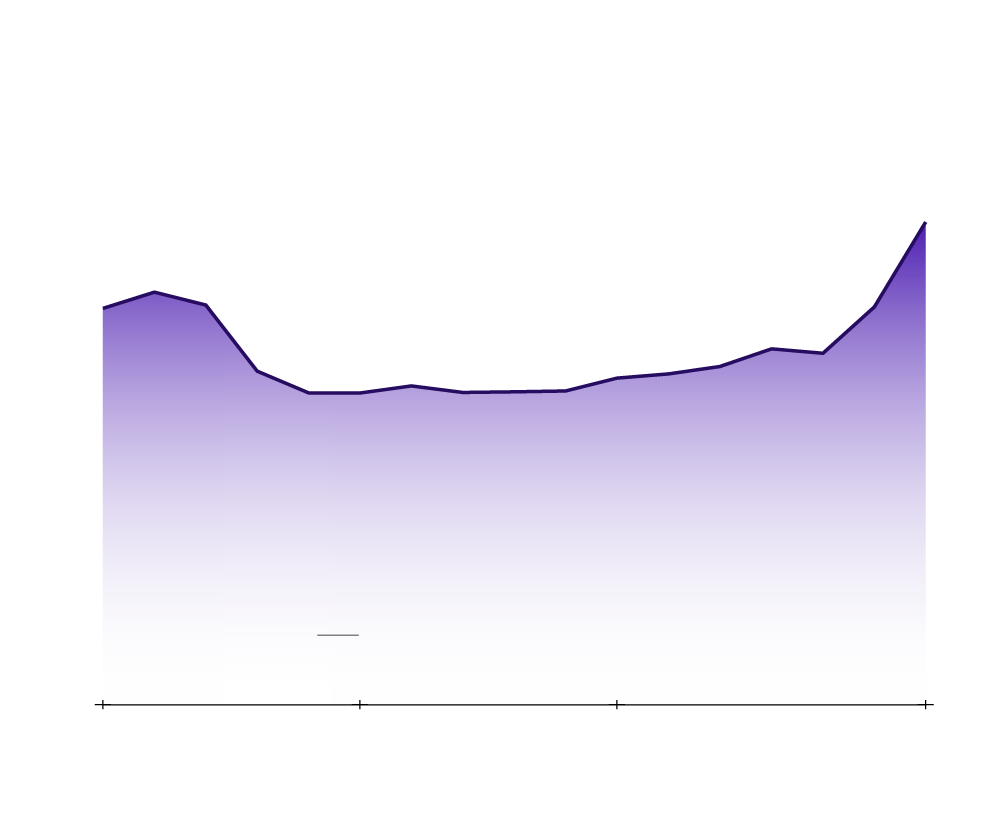
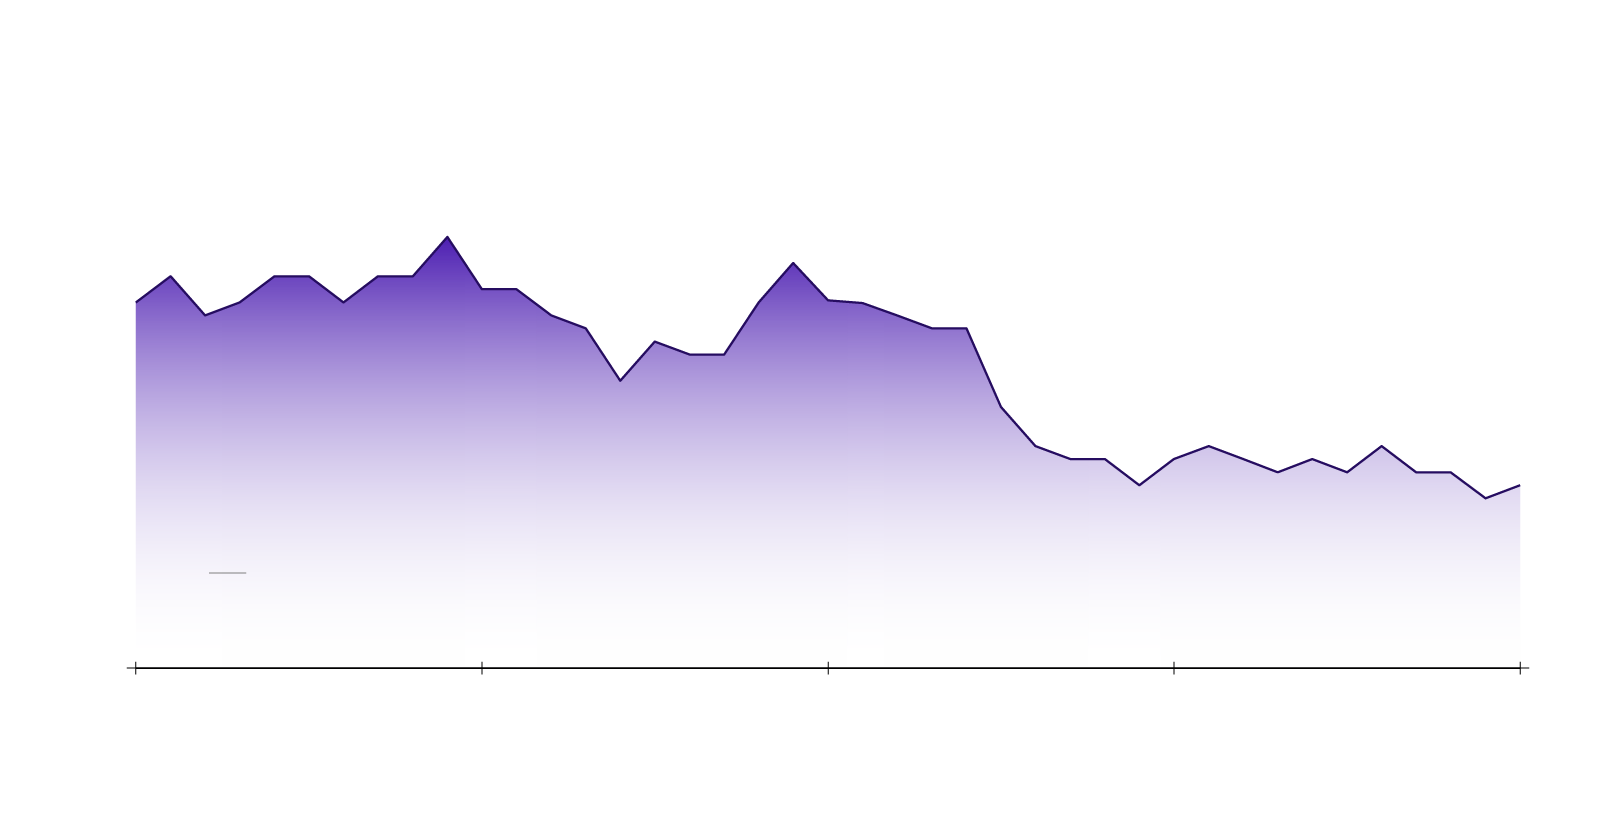
In 2021, the pandemic helped spur the
largest number of new likely employer
business applications on record
Annual total of likely employer
business applications (millions)
1.8
1.5
1.0
0.5
Recession
periods
0.0
2005
2010
2015
2021
Source: U.S. Census Bureau’s Business Formation
Statistics
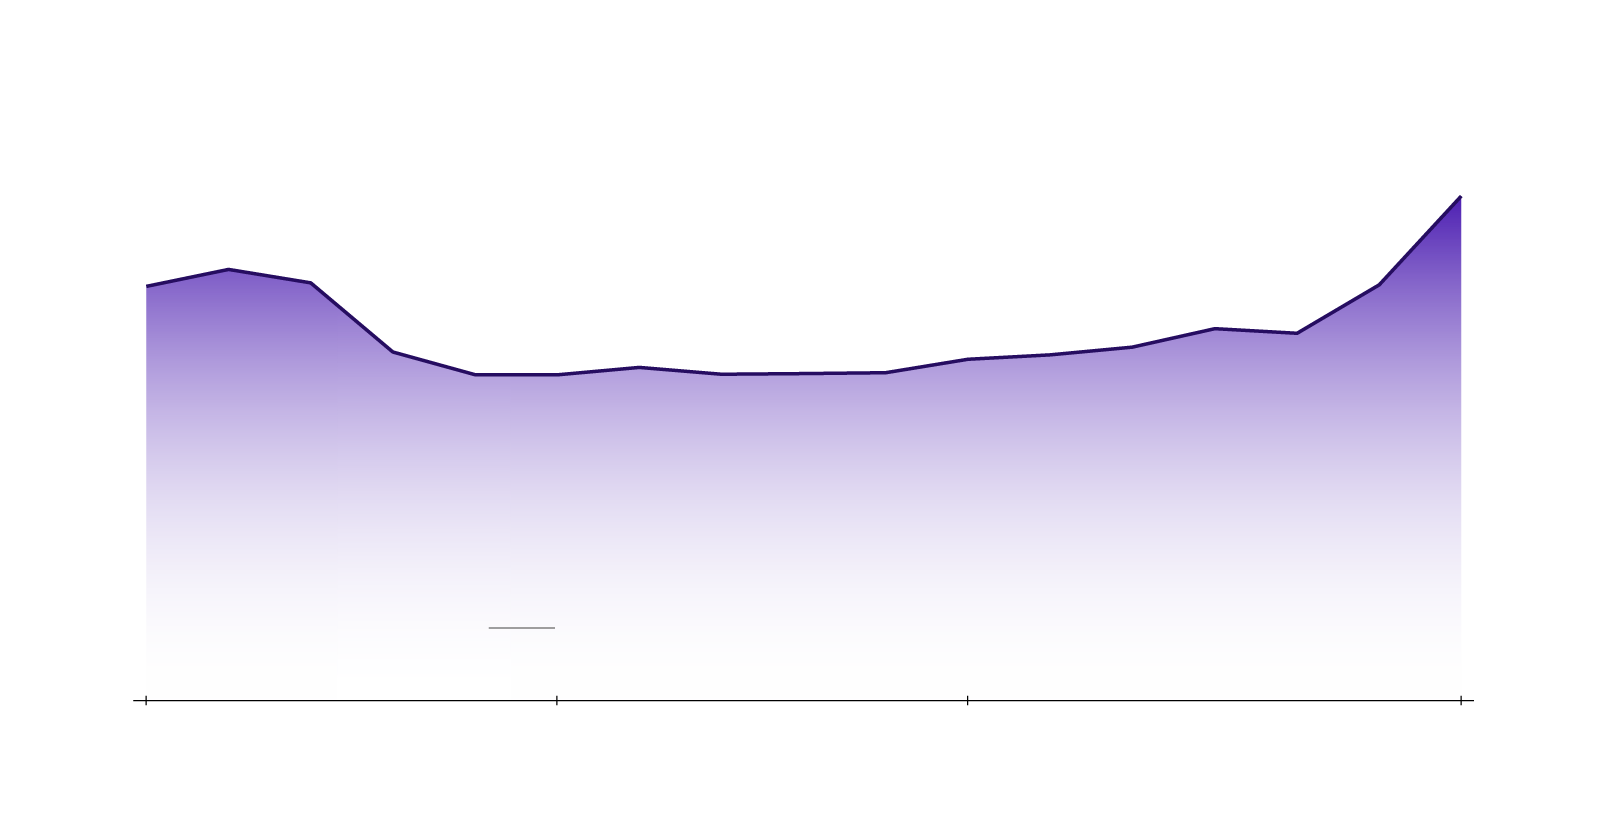
In 2021, the pandemic helped spur the largest number
of new likely employer business applications on record
Annual total of likely employer business applications
(millions)
1.8
1.5
1.0
0.5
Recession
periods
0.0
2005
2010
2015
2021
Source: U.S. Census Bureau’s Business Formation
Statistics
In 2021, the pandemic helped spur the largest number
of new likely employer business applications on record
1.8
Annual total of likely employer business applications
(millions)
1.5
1.0
0.5
Recession
periods
0.0
2005
2010
2015
2021
Source: U.S. Census Bureau’s Business Formation
Statistics
Look beyond the current momentum, however, and it remains clear
that powerful headwinds are working against a return to the
high-churn qualities that once characterized our economy. While
the quantity of new businesses in the pipeline appears
record-breaking, questions remain about their quality and
longevity. The pandemic has accelerated the country’s
demographic challenges, pushing population growth and
immigration to historic lows. The continued dominance of
incumbent firms and vested interests across the economy means
that market conditions are not especially hospitable to new
upstarts. The economy is replete with gatekeepers that stymie
workers and slow the pace of adaptation and adjustment. And the
impact of temporary fiscal and monetary stimulus may be
distorting markets and obfuscating the long-term economic
outlook. For the country to overcome these challenges, we must
renew the forces of competition, entrepreneurialism, and
adaptivity that have waned dramatically in recent decades.
In the following paper, we examine the fall and potential
rebirth of American dynamism and why it matters deeply for
American workers. We track the downward trajectory of key
economic indicators, such as startup and job reallocation rates,
and highlight the major forces that help explain their decline.
We reject the notion that Americans must settle for a complacent
future in which stasis and managed decline replace dynamism as
the new norm. We also reject the notion that replacing dynamism
with stasis serves the interests of American workers and
families. Policy mistakes—large and small—compounded over
decades have contributed heavily to the country’s diminished
vitality, but it is not too late to change course. And change is
urgently needed, because a high-churn, dynamic economy is one
that offers the strongest benefits to workers in the form of
abundant jobs and better wages, as well as greater access to
opportunity for marginalized workers. To that end, we conclude
by sketching out the pillars of a pro-dynamism policy agenda
that would unleash the economy’s pent-up potential and help all
Americans share more fully in the benefits of economic growth.
01 Diagnosing the decline
What is dynamism?
The term economic dynamism refers to the rate and
pervasiveness of change across industries, geographies, and
the labor market in an economy.
Key indicators of dynamism traditionally include the rates of
business formation and closure, the frequency at which workers
quit and switch jobs, and the propensity of workers and
families to move to new locations. Economic dynamism is not
simply “disruption”; it equates more closely to a state of
productive churn and adaptation that enables the economy and
its workers to respond to disruption.
Dynamism lies at the heart of a well-functioning market economy.
A robust ferment of churn and change underneath the surface
endows the economy with an inherent flexibility that allows it
to adapt, evolve, and grow. Dynamism is safeguarded by multiple
forces: the intensity of healthy market competition, demographic
vitality, a high-quality human capital base, strong
institutions, and even social and cultural factors like the
population’s entrepreneurial proclivity.
In dynamic economies, firms both form and fail more frequently,
and a healthy startup rate ensures that the economic impacts of
failures are short-lived, as the economy’s natural restorative
forces redeploy workers and resources into new and better
endeavors. Healthy startup rates also ensure that markets remain
competitive, priming a virtuous circle. In dynamic economies,
workers move and change jobs frequently in both pursuit and
attainment of economic opportunity, too. But when dynamism slows
and competition withers, these processes become interrupted, and
imbalances accumulate. Resources go idle. The rate of
experimentation in the economy slows, and it becomes less able
to adapt. Economic opportunities dry up.
The promise of a dynamic economy lies in its ability to ignite
progress and provide insurance against future unknowns.
Dynamic economies generate the innovation and productivity
advances that raise well-being. Constant churn fosters an
underlying resilience that mitigates shocks and smooths
transitions─be they black-swan pandemics or clean energy
revolutions. And dynamism provides its own form of an economic
safety net, with a healthy circulatory system that helps catch
displaced workers and carry them into new occupations and
endeavors.
In short, dynamism helps ensure workers find opportunity in the
midst of economic change.
When the economy’s inherent dynamism begins to ebb, so does its
ability to deliver on the aspirations of American workers and
their families. Unfortunately, that is precisely what has
occurred in recent decades.
Let’s turn now to a closer look at key measures of economic
dynamism and the forces at play behind their steady declines.
The trends
The fall of American entrepreneurship
The startup rate captures the share of all businesses in the
economy that started within the past year, and it may be the
foremost indicator of the economy’s overall dynamism.
Strong startup rates signal a competitive and healthy
marketplace with low barriers to entry that allow new firms to
enter and compete—raising quality, lowering prices, and spurring
further innovation. On the flip side, a healthy firm death or
closure rate is a sign that competitive forces are working:
businesses that are unable to adapt (e.g., improve their goods
and services, offer lower prices, or reduce their production
costs) are forced out of the market, freeing resources to be
deployed more productively elsewhere. In this way, firm births
and deaths go hand in hand, as the flow of new entrants into a
market puts healthy pressure on incumbents, some of whom will
rise to the challenge of increased competition, while others
perish. Healthy startup rates help mitigate the tangible
downsides of firm closures for workers by ensuring they can
quickly find employment elsewhere. Without a steady flow of new
firms, workers feel the pain of each closure more acutely.
The business
startup rate has
languished near its all-time low point
for over a decade
U.S. startup rate and firm death rate
12%
Startup rate
8%
Firm death rate
4%
Recession
periods
0%
1980
1990
2000
2010
2020
Source: U.S. Census Bureau’s Business Dynamics
Statistics
The business
startup rate has
languished
near its all-time low point for over a decade
U.S. startup rate and firm death rate
The startup rate
plummeted between
2006 and 2010...
12%
8%
Firm death rate
... from then until the
coronavirus pandemic,
it hardly budged from
its record low
4%
Recession
periods
0%
1980
1985
1990
1995
2000
2005
2010
2015
2020
Source: U.S. Census Bureau’s Business Dynamics
Statistics
The business
startup rate has
languished near its
all-time low point for over a decade
U.S. startup rate and firm death rate
The startup rate
plummeted between
2006 and 2010...
12%
8%
Firm death rate
... from then until the
coronavirus pandemic,
it hardly budged from
its record low
4%
Recession
periods
0%
1980
1985
1990
1995
2000
2005
2010
2015
2020
Source: U.S. Census Bureau’s Business Dynamics
Statistics
The startup rate has been trending downwards since the 1980s,
but two pivotal points stand out in the data. The first occurred
around the year 2000, when startup rates and the incidence of
high-growth young firms in high-tech industries fell sharply for
a decade. The late-2000s financial crisis then brought another,
more wide-reaching watershed. The startup rate plummeted across
sectors and geographic regions between 2006 and 2010. From then
until the onset of the coronavirus pandemic, it hardly budged
from its record low. The rate at which firms die also slowed
around the same time, albeit to a lesser extent. The result was
a low-dynamism equilibrium that lasted for the duration of the
2010s in which firm starts barely exceeded firm closures at the
national level—and actually fell below in many metropolitan and
rural areas. No longer did the American economy comfortably add
new firms at a faster pace than old ones that went out of
business.
Nowhere is the fading heft of startups more apparent than in
employment data. In the mid-1980s, roughly 4 percent of the
workforce was employed in a company that started within the past
year. By 2010, the figure fell below 2 percent, where it
remained through 2019. In absolute terms, startups launched in
2019 employed 2.4 million workers—the same number as were
employed by new firms in 1982, when the workforce was 57 million
workers (or 43 percent) smaller. Two core factors contribute to
startups’ diminished weight in labor market: startups are both
smaller (the average startup now has only four employees at
founding, compared to five in the 1990s) and scarcer (the
country produced almost 10 percent fewer new firms in absolute
terms in the late 2010s than it did in the 1990s or early 2000s)
than they used to be.
The share of Americans employed
in startups has fallen by one-half
since the mid-1980s
Share of total employment in startups
4%
3%
2%
1%
Recession
periods
0%
1980
1990
2000
2010
2020
Source: U.S. Census Bureau’s Business Dynamics
Statistics
The share of Americans employed in startups has fallen
by one-half since the mid-1980s
Share of total employment in startups
4%
3%
2%
1%
Recession
periods
0%
1980
1990
2000
2010
2020
Source: U.S. Census Bureau’s Business Dynamics
Statistics
The share of Americans employed in startups has fallen
by one-half since the mid-1980s
Share of total employment in startups
4%
3%
2%
1%
Recession
periods
0%
1980
1990
2000
2010
2020
Source: U.S. Census Bureau’s Business Dynamics
Statistics
The graying of corporate America
The flip side of declining startups is the increasing dominance
of older incumbent firms. The share of workers employed in older
firms (defined here as firms that have been in business for at
least 16 years, based on age groups provided by the Census
Bureau) has steadily risen since the turn of the 21st century,
reaching 74.9 percent in 2019. This trend is broad-based across
industry sectors; between 2000 and 2019, only the mining,
quarrying, and oil and gas extraction sector saw its share of
employment in older firms decline meaningfully. The comparative
youthfulness of the extraction industries can likely be
explained by the technological revolution in hydraulic
fracturing – a textbook case in how dynamism within sectors can
transform industries, create wealth, increase productivity, and
reshape economic geography.
Nearly every industry now has
a larger share of workers in
old firms
than at the start of the century
Percentage-point differences in share of
employment in firms aged 16 or older
between 2000 and
2019, by sector
Admin, Support,
Waste Mgmt, Rem. Serv.
+23 pp
Wholesale Trade
+17 pp
Professional, Scientific, and
Technical Services
+17 pp
Construction
+16 pp
Arts, Entertainment, and Recreation
+15 pp
Accommodation and Food Services
+15 pp
Real Estate and Rental and Leasing
+12 pp
Health Care and Social Assistance
+12 pp
Manufacturing
+11 pp
Retail Trade
+10 pp
Information
+9 pp
Management of Companies
and Enterprises
+9 pp
Transportation and Warehousing
+9 pp
Other Services (except Public
Administration)
+7 pp
Finance and Insurance
+6 pp
Utilities
+2 pp
Educational Services
-1 pp
Mining, Quarrying, and Oil and
Gas Extraction
-10 pp
Source: U.S. Census Bureau’s Business Dynamics
Statistics
Nearly every industry now has a larger share of
workers in old firms than
at the start of the century
Share of employment in firms aged 16 or older by sector
0%
20%
40%
60%
80%
100%
2000
2019
Utilities
Management of Companies and Enterprises
Manufacturing
Finance and Insurance
Retail Trade
Wholesale Trade
Transportation and Warehousing
Educational Services
Information
Health Care and Social Assistance
Admin, Support, Waste Mgmt, Rem. Serv.
Other Services (except Public Administration)
Arts, Entertainment, and Recreation
Professional, Scientific, and Technical Services
Mining, Quarrying, and Oil and Gas Extraction
Real Estate and Rental and Leasing
Construction
Accommodation and Food Services
Source: U.S. Census Bureau’s Business Dynamics
Statistics
Nearly every industry now has a larger share of workers
in
old firms than at the
start of the century
Share of employment in firms aged 16 or older by sector
0%
20%
40%
60%
80%
100%
2000
2019
Utilities
Management of Companies and Enterprises
Manufacturing
Finance and Insurance
Retail Trade
Wholesale Trade
Transportation and Warehousing
Educational Services
Information
Health Care and Social Assistance
Admin, Support, Waste Mgmt, Rem. Serv.
Other Services (except Public Administration)
Arts, Entertainment, and Recreation
Professional, Scientific, and Technical Services
Mining, Quarrying, and Oil and Gas Extraction
Real Estate and Rental and Leasing
Construction
Accommodation and Food Services
Source: U.S. Census Bureau’s Business Dynamics
Statistics
As a rule, old firms are slower growing than young firms, if
they grow at all. Thus, the shift in economic weight towards
older (and often larger) firms leaves the economy less dynamic
overall and more dependent on a dwindling cohort of new and
younger firms to power job growth.
The slowing churn of workers in the labor market
Contrary to popular myths regarding today’s job-hopping
millennials and gig economy precariat, churn in the American
labor market has actually dampened over time. Even the record
number of job quits registered in late 2021 only pushed total
hires and separations in the economy (workforce turnover) back
to levels last seen around 2000. For the duration of the
recovery from the Great Recession, turnover rates for prime-age
workers failed to recover to pre-crisis levels.
The stagnation appears even more acute when examining the net
volume of jobs created and destroyed across firms (job
reallocation) in the economy.
Job reallocation versus workforce turnover: What’s the
difference?
These two terms refer to distinct but complementary concepts.
Job reallocation is assessed at the firm level and offers an
aggregate measure of how the distribution of jobs or positions
in the economy shifts across firms each year. The reallocation
rate is driven by new firm starts, firm closures, and the
differential rates of expansion and contraction of different
businesses. Workforce turnover, by contrast, refers to the
rate at which workers change employers. A job position does
not need to be reallocated between two firms for workers to
turnover among them, for example. Job reallocation is
important for aggregate economic productivity, while workforce
turnover is important for an individual’s career and wage
growth, along with promoting quality job matches.
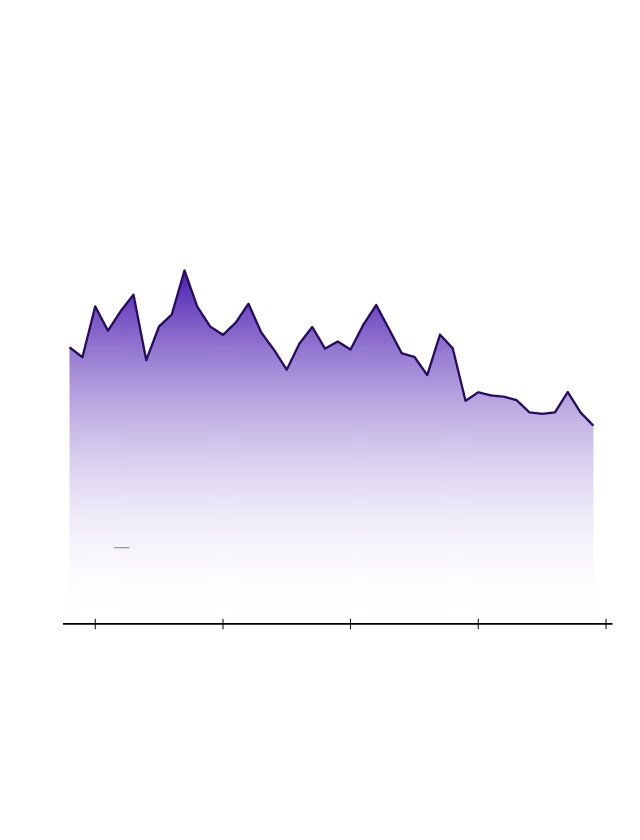
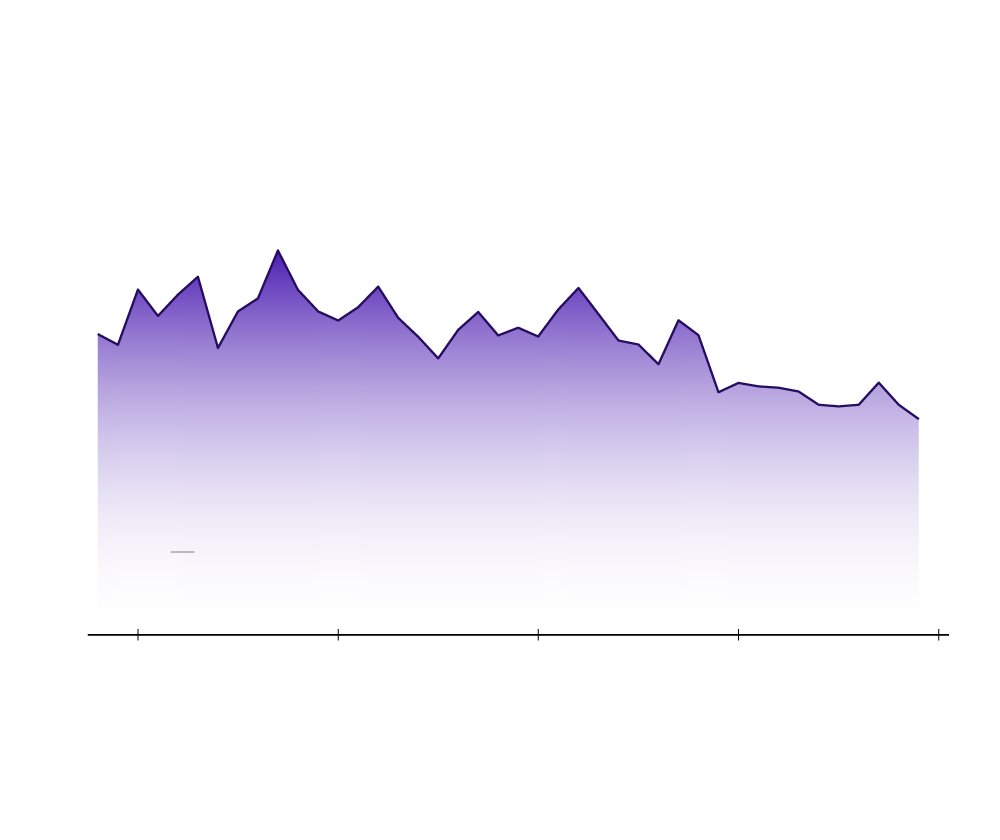
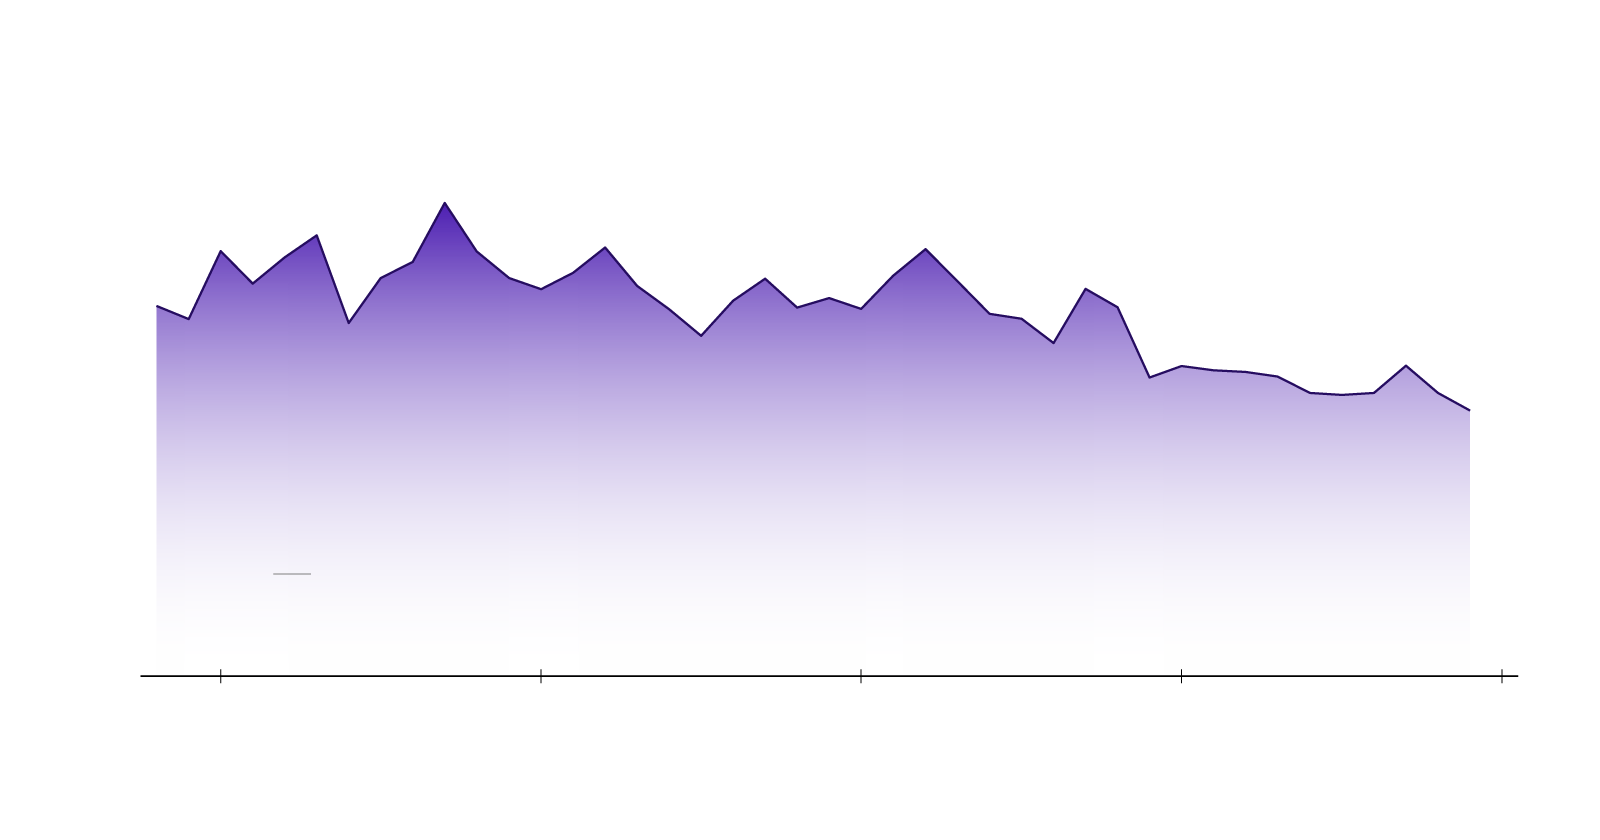
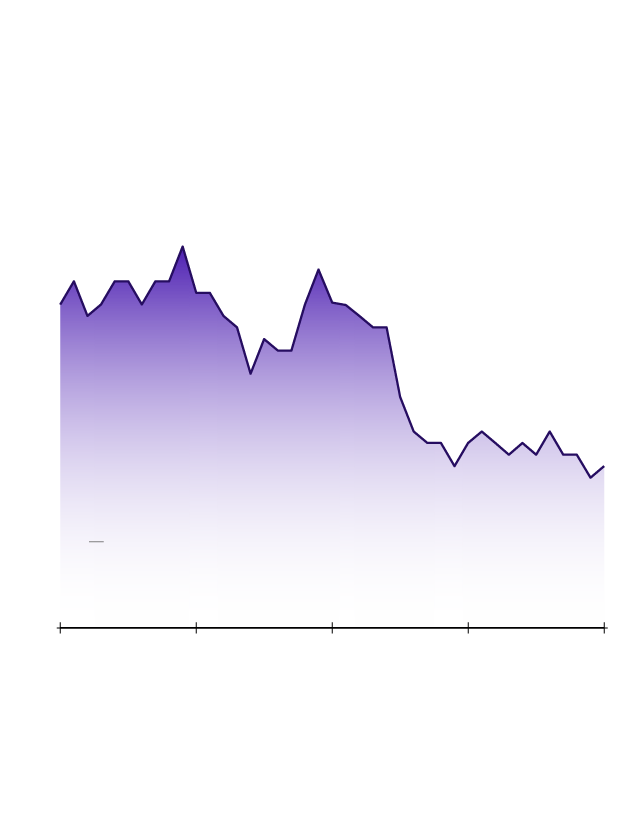
In the 1990s, the equivalent of roughly one-quarter of all jobs
in the economy were reallocated across companies annually as
firms expanded, contracted, started, and failed in any given
year. By the 2010s, that figure hovered around one-fifth—a 20
percent decline. In 2019, job reallocation reached an all-time
low. While it may sound arcane, job reallocation is an integral
economic process; its slowdown reflects a broader falloff in the
rate at which even successful firms scale and grow. Economists
Ryan Decker and colleagues calculate that falling job
reallocation drove aggregate productivity growth more than
one-third lower in the 2000s than it otherwise would have been.
And of course, the situation deteriorated further over the
2010s.
The rate at which workers churn
across firms slowed to its
lowest level on record in 2019
Job reallocation rate
30%
20%
10%
Recession
periods
1980
1990
2000
2010
2020
Source: U.S. Census Bureau’s Business Dynamics
Statistics
The rate at which workers churn across firms slowed
to its lowest level on record in 2019
Job reallocation rate
30%
20%
10%
Recession
periods
1980
1990
2000
2010
2020
Source: U.S. Census Bureau’s Business Dynamics
Statistics
The rate at which workers churn across firms slowed
to its lowest level on record in 2019
Job reallocation rate
30%
20%
10%
Recession
periods
1980
1990
2000
2010
2020
Source: U.S. Census Bureau’s Business Dynamics
Statistics
The falling job reallocation rate is an important corollary to
the other patterns discussed here: fading startup rates,
disappearing cohorts of high-growth young firms, and an aging
firm distribution. While the slowdown in worker turnover may
partially be attributable to improved employer-employee matches,
the broader decline in job reallocation has negative aggregate
economic implications, given the important role the process
plays in helping to ensure that American workers are employed
productively and paid well in return. The weak startup and
worker reallocation rates coming out of the Great Recession
explains some of the slow productivity and weak wage growth of
the 2010s.
Stuck in place
Once a restless bunch, Americans have become more firmly stuck
in place over the past two decades than at any period on record.
Interstate mobility (i.e., moving across state lines) has
historically served as an important mechanism for reducing
economic disparities across the country, allowing workers to
leave struggling places in pursuit of better economic
opportunities elsewhere. However, interstate migration has
fallen by half since the 1980s, with much of that decline coming
in the immediate run-up to the Great Recession. The interstate
migration rate hit a record low in 2019, as Bill Frey from the
Brookings Institution has chronicled.
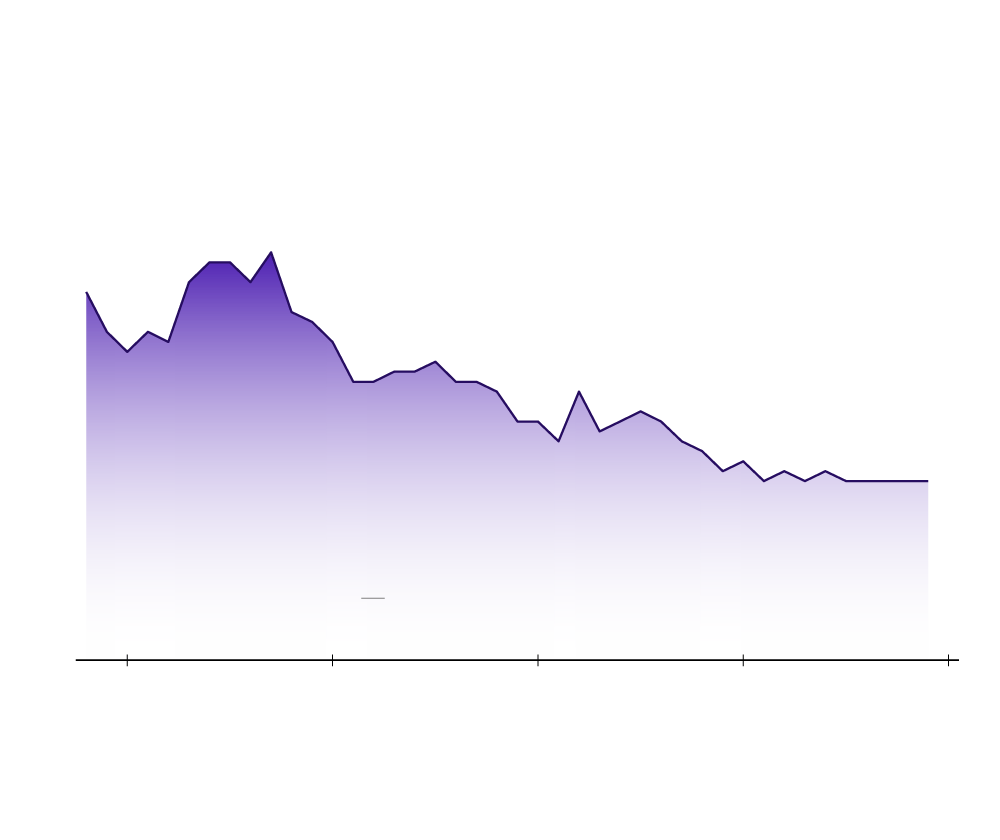
Americans have never been
less likely to move across state lines
Interstate migration within U.S. population
3%
2%
1%
Recession
periods
0%
1980
1990
2000
2010
2020
Source: U.S. Census Bureau’s Historical Migration
and Geographic Mobility Tables
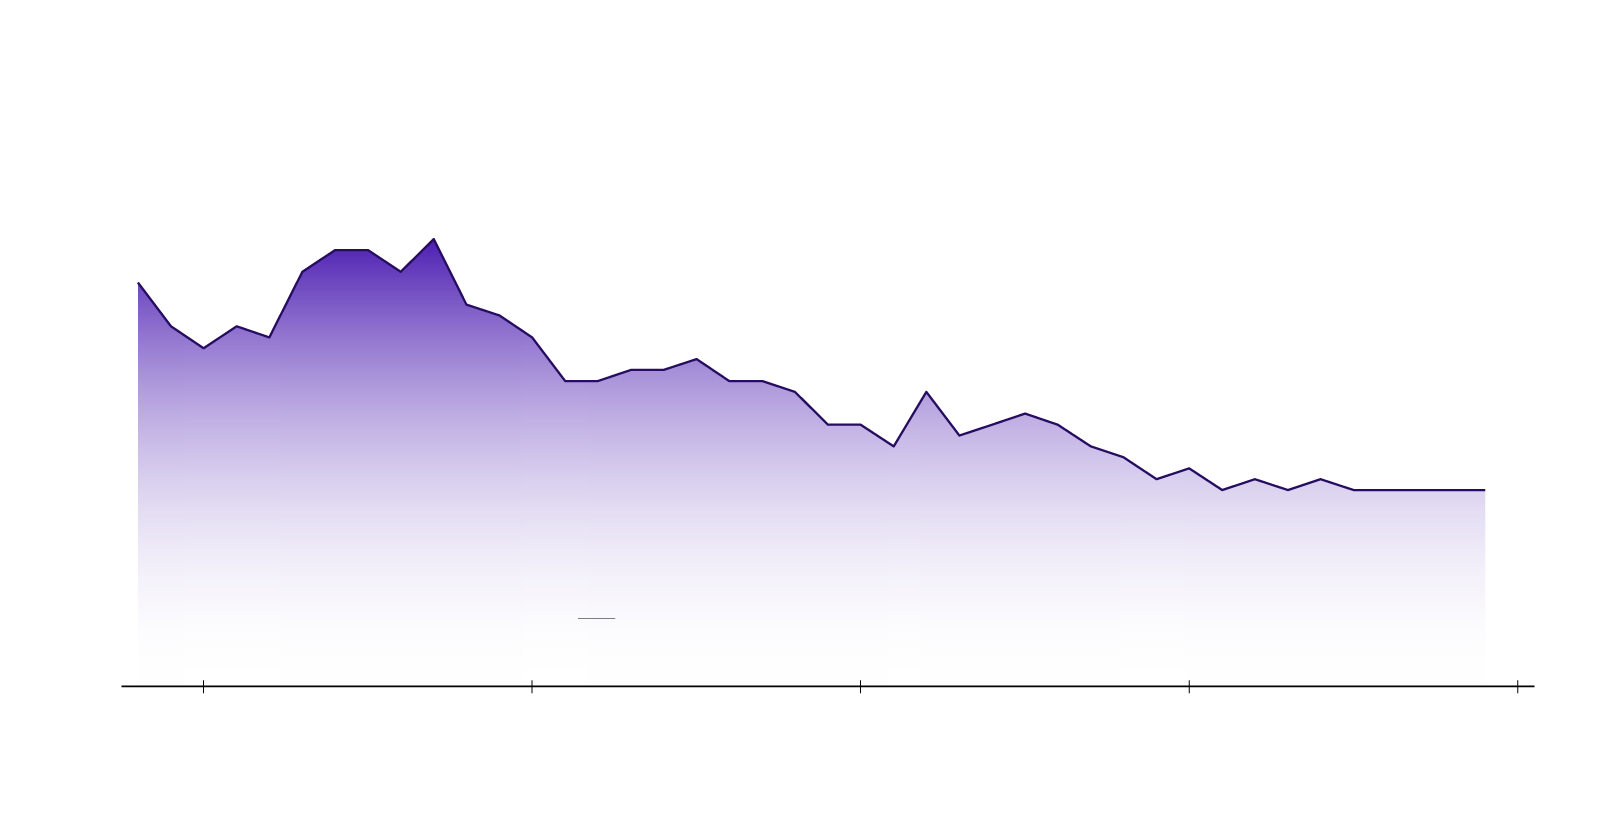
Americans have never been
less likely to move across state lines
Interstate migration within U.S. population
3%
2%
1%
Recession
periods
0%
1980
1990
2000
2010
2020
Source: U.S. Census Bureau’s Historical Migration
and Geographic Mobility Tables
Americans have never been less likely to move across
state lines
Interstate migration within U.S. population
3%
2%
1%
Recession
periods
0%
1980
1990
2000
2010
2020
Source: U.S. Census Bureau’s Historical Migration
and Geographic Mobility Tables
Meanwhile, migration has become increasingly skill-biased, with
highly educated Americans moving at much higher rates compared
to those who only have a high school diploma. Several factors
likely contribute to the decline in mobility, and a perceived
reduction in economic opportunities elsewhere appears to be a
significant one: between 2000 and 2010, more than half of the
decline in residential migration was the result of declines in
economic migration (i.e., moving because of a job change).
Contrary to initial expectations, the pandemic has delivered no
observable reversal to this trend. Whether down the street,
across town, or across the country, Americans moved less during
the pandemic than any time on record. None of this is to say
that Americans are satisfied with declining geographic mobility.
The share of Americans who report being stuck in a neighborhood
they would like to leave has risen by nearly 50 percent over the
past four decades.
The forces at work
What explains America’s lost mojo? The decline in U.S. dynamism
is widespread across sectors and regions of the country, and is
mirrored across advanced economies around the globe. This
pervasiveness suggests that several different and interrelated
forces operating on economy-wide scales are likely behind the
development. Disentangling them is difficult, but economists
generally see two basic causes: slowing rates of population
growth and slowing rates of knowledge diffusion. We would add a
third: the generalized, all-encompassing shift towards
gatekeeping at every level of economic life, which makes it
harder to build, move, switch jobs, start firms, and compete.
Demography
A young and growing population helped buoy the U.S. economy for
most of the 20th century with plentiful labor and a growing
consumer base. No longer. The 2010s were the second-slowest
decade for population growth in the country’s entire history,
barely beating out the 1930s, which included the Great
Depression and strong restrictions in immigration policy.
Between 2010 and 2019, 81 percent of counties saw their prime
working-age population (i.e., 25- to 54-year-olds) decline (see
Figure 10). The share of the country’s labor force in their
prime entrepreneurship years fell by 7 percentage points from
2000 to 2019. The pandemic pushed annual population growth to
0.1 percent in 2021–the lowest in the country’s history.
This slowdown has many implications, both for labor market
outcomes and the broader economy. A declining population means
fewer workers and fewer consumers to stimulate economic
growth—as well as fewer would-be entrepreneurs. Work by Ian
Hathaway and Bob Litan has shown that population growth is a
strong contributor to new business formation. Fatih Karahan and
colleagues estimate that the slowdown in labor force growth
since 1970 may account for 33 percent to 60 percent of the
decline in the startup rate. It may also help explain why the
startup rate has remained stuck at historically low levels
despite the return to broader macroeconomic growth. Even at the
county level, population growth is associated with higher
startup rates, while a 1 percent loss in population leads to a 2
to 3 percent decline in the local startup rate. With national
population growth so slow and localized population losses so
widespread, demographically induced dynamism can no longer be
taken for granted.
The country’s population
grew more slowly during the
2010s than
at any point since the Great Depression
U.S. population growth rates by decade
20%
15%
10%
5%
0%
1900s
'20s
'40s
'60s
'80s
2000s
Frey. “For the First Time on Record, Fewer than
10%
of Americans Moved in a Year.” Brookings
Institution, 2019
The country’s population grew more slowly during
the 2010s than at any
point since the Great Depression
U.S. population growth rates by decade
20%
15%
10%
5%
0%
1900s
'10s
'20s
'30s
'40s
'50s
'60s
'70s
'80s
'90s
2000s
'10s
Frey. “For the First Time on Record, Fewer than
10% of Americans Moved in a Year.”
Brookings Institution, 2019
The country’s population grew more slowly during
the 2010s
than at any point since the Great Depression
U.S. population growth rates by decade
20%
15%
10%
5%
0%
1900s
'10s
'20s
'30s
'40s
'50s
'60s
'70s
'80s
'90s
2000s
'10s
Frey. “For the First Time on Record, Fewer than
10% of Americans Moved in a Year.” Brookings
Institution, 2019
Knowledge diffusion
The spread of knowledge and expertise is key to an economy’s
dynamism. While there are inherent measurement challenges at
play, a growing body of evidence points to the decline in the
rate at which knowledge diffuses through the economy as a
cause—not just a consequence—of declining American dynamism.
This decline may seem paradoxical in the age of information
technology, but economists estimate that diminished knowledge
diffusion accounts for up to 70 percent of the observed symptoms
of diminished dynamism, from high corporate markups to slowing
startup rates and aborted growth trajectories of young firms.
Recent research from the Organization for Economic Cooperation
and Development (OECD) finds that dynamism’s decline has been
swiftest in the most digitized and knowledge-centric advanced
economies.
Obstructions to the flow of knowledge would be consistent with
observations by Ryan Decker and colleagues that high-growth,
high-wage startups have disappeared even more quickly than other
types of startups. Why might these critical economic
inputs—knowledge and ideas—not be flowing as freely as they used
to? The answer may be wrapped up in the nexus between technology
and market concentration. Digitization offers leading companies
compounding advantages that extend their lead and entrench their
dominance, making it harder for upstarts and laggards alike to
compete. Indeed, further evidence from OECD economists suggests
that the hold that superstar firms have over new knowledge is
tighter and longer lasting than ever before. Overlapping
thickets of patents perpetuate the gaps and slow the rate at
which new technologies get absorbed by other firms and deployed
across the economy. Strategic acquisitions are used to either
snuff out would-be competitors or seize innovations to further
strengthen incumbent advantage.
Startups play a critical economic role in commercializing
innovations, which means their retreat could be a symptom of
slowing innovative activity further upstream as well. Falling
federal investment in basic R&D—the earliest-stage fountain of
new knowledge and where the public sector has the greatest
comparative advantage—relative to the size of the economy (or
the waning effectiveness of such spending) could be making
itself felt in less new knowledge and technology flowing
throughout the system, for example, and fewer new business
opportunities as a result. To be sure, on many measures the
country still produces large crops of extremely innovative, high
quality new firms in most years, but the volume, variety,
survival, and growth of such firms lags far behind the economy’s
potential—and its history.
Workers themselves are essential in spreading knowledge and
know-how throughout the economy but face mounting barriers at
every turn. The proliferation of restrictive employment
covenants such as non-compete agreements prevent knowledge
workers from moving to competitors or starting their own firms.
Frivolous lawsuits and opportunistic trade secret enforcement
actions undermine risk-taking in our most innovative sectors.
Fewer spin-offs, fewer job-hops, and fewer cross-country moves
all bolster the sequestration of knowledge behind moats of
intellectual property and other protections that advantage the
goliaths. All of this slows the pace that know-how and
innovations filter through the economy, and it translates into
fewer opportunities to start and scale new businesses around new
ideas.
Sclerosis
In 1982, economist Mancur Olson coined the term “institutional
sclerosis” to describe the process through which rich, stable
democracies become weighed down with vested interests,
bureaucratic overreach, and forms of inefficiency and
gatekeeping over time. This sclerosis makes economies slower and
less flexible, eventually sapping market-based democratic
systems of much of their strength and reducing productivity,
growth, and individual economic mobility. One can easily see
this diagnosis applying to the United States today, where
mojo-destroying inaction and stasis define so many aspects of
economic life.
Perhaps nowhere is the sclerotic build-up more apparent than in
sectors touching the built environment itself. The American
construction industry has experienced almost no productivity
gains in multiple generations. It costs more to build new
transportation infrastructure in the United States than nearly
anywhere in the developed world. This chokes off the economic
potential of major infrastructure investments. It suggests that
absent a broader institutional cleanup, even major federal
efforts to modernize and expand the country’s infrastructure are
at risk of getting stuck in a morass of permitting delays and
cost overruns—and ultimately underdelivering for the American
people. As Brink Lindsey of the Niskanen Center warns, “a
government that cannot build things on time and on budget is a
government incapable of providing the public goods the 21st
Century demands.” Indeed, our inability to build to meet even
our most exigent priorities threatens the nation’s ability to
successfully transition to a lower carbon economy.
At the federal level, the mass of rulemaking appears only to
grow. Declining dynamism writ large cannot be pinned on the
growing volume of federal regulation alone, but complexity is a
gift to large incumbents and vested interests all the same. What
happened to the country’s banking sector in the wake of the
2008-09 financial crisis is telling. As tomes of new financial
rulemaking were spun in the wake of the crisis, entrepreneurship
in the country’s traditional banking sector was completely
neutralized for nearly a decade. More than 1,500 new banks were
chartered in the 10 years prior to the financial crisis; between
2011 and 2018, only 14 were. Small banks were strained, large
banks consolidated, and small and risky traditional business
lending overall fell dramatically. Measures to stabilize the
financial sector were surely necessary, but a more adaptive and
responsive political system would have been able to monitor
unintended consequences and fix them; instead, they have been
left to fester.
If this institutional malaise were only a federal phenomenon it
might feel more tractable. However, everything from local
permitting and zoning rules to poorly crafted state
environmental impact assessments conspire to stop progress in
its tracks at every turn. From neighborhood associations to
state licensing boards, the U.S. economy is now replete with
institutional gatekeepers who, after securing their own
preserve, close the door to opportunity behind them. With
respect to building, this manifests itself in private litigation
to stop key infrastructure projects that might connect
low-income workers with job opportunities, and in vocal
community opposition to even the most modest attempts to densify
development patterns or build anything but single-family housing
in opportunity-rich neighborhoods. If such tactics do not
prevent projects from proceeding altogether, they dramatically
raise the costs, ensuring that the country accomplishes less
with the resources at its disposal.
The ensuing distortions are flabbergasting: the country’s most
successful metropolitan agglomeration, the San Francisco Bay
Area, has been shedding domestic migrants for years, unable to
build sufficient housing to feed what should be the country’s
most magnetic industry cluster and opportunity-rich job market.
Such cautionary tales barely scratch the surface of how deeply
the tyranny of NIMBYism has harmed workers and reduced economic
growth and dynamism. Researchers Chang-Tai Hsieh and Enrico
Moretti found that restrictive land-use regulations in our most
productive cities have exacted a truly staggering toll, reducing
wage growth and dragging GDP growth in American cities down by
36 percent over the past five decades.
There are analogues across economic and social life, from
finance to housing, in which arguably fair competition in one
period gave way to unfair competition in the next. Competitive,
contestable market conditions need to be continuously secured,
because the winner in one period has every incentive to use all
tools at his or her disposal to ensure they are the winner of
each subsequent period too. In the social realm, this behavior
can be seen in the “opportunity-hoarding” of the upper-middle
classes, as Richard Reeves puts it, where public policy at all
levels is coopted to reinforce the advantages of the affluent
and upper middle classes, distorting the meritocracy much like a
leading firm might rationally use its available means to distort
the market in its favor.
The public’s weapons for safeguarding competition in
markets–proactive and robust antitrust enforcement, competent
regulators, and insurgent entrepreneurs–are all flagging.
Antitrust enforcement actions have been minimal since the
mid-1990s, and enforcement agency appropriations have fallen for
a decade. As knowledge, technology, and business grow
increasingly more complex, regulators with limited resources and
capacity are at ever greater risk of capture by incumbent
interests. And a negative feedback loop may already be
preventing startups from entering new markets, further cementing
incumbent advantage and deterring future startup activity.
In the end, sclerosis and gatekeeping are detrimental because
they prevent people from accessing economic opportunity. They
raise the cost of building things–literally and figuratively–in
the United States, diminishing the pace of progress and
restricting how broadly the benefits of progress can spread.
Broad institutional shortcomings that make it hard to afford
housing, change careers, or build a business constrain the
opportunity sets within which individuals make economic
decisions. Institutional sclerosis obstructs the sort of
risk-taking that is the lifeblood of a dynamic economy.
02 How Workers Benefit from a Dynamic Economy
The simplest way to understand how workers directly and
indirectly benefit from a dynamic and changeful economy is to
examine dynamism’s essential role in:
creating jobs;
boosting wages; and
providing economic opportunities for less advantaged
workers.
Creating jobs
New firms power a healthy job market. The most successful young
firms in any given year are responsible for nearly all of the
economy’s lasting net job creation. From 1990 to 2006, new firms
created an average of 2.8 million jobs each and every year. That
figure fell by more than one-fifth to 2.3 million following the
Great Recession, after which it failed to recover. The impact
has been significant. Recent research from the OECD suggests
that a 20 percent decline in startups (essentially what the
United States has experienced with the Great Recession) reduces
total employment down the road by 0.7 percent after three years
and 0.5 percent after 14 years. In other words, the startup
shortfall coming out of the Great Recession translated into a
national deficit of well over half a million jobs by 2019.
Nearly all of the country’s net job
creation has come from
startup
businesses over the past
two decades
Net job creation (millions)
Firms age 0 (startups)
2
0
2000
2005
2010
2015
Ages 1-5
0
-2
Ages 6-15
0
-2
Ages 16+
2
0
-2
-4
All firms
4
2
0
2000
2005
2015
-2
-4
Source: U.S. Census Bureau’s Business Dynamics
Statistics
Nearly all of the country’s net job creation has
come
from
startup businesses over
the past two decades
Net job creation (millions)
Firms age 0 (startups)
2
0
2000
2005
2010
2015
Ages 1-5
0
-2
Ages 6-15
0
-2
Ages 16+
2
0
-2
-4
All firms
4
2
0
-2
-4
Source: U.S. Census Bureau’s Business Dynamics
Statistics
Nearly all of the country’s net job creation has
come from
startup businesses
over the past two decades
Net job creation (millions)
Firms age 0 (startups)
2
0
2000
2005
2010
2015
Ages 1-5
0
-
2
Ages 6-15
0
-
2
Ages 16+
2
0
-
2
-
4
All firms
4
2
0
-
2
-
4
Source: U.S. Census Bureau’s Business Dynamics
Statistics
For all the pain that they cause, recessions can perform a
salutary function in the economy at large. Firms generally shed
their least productive workers in a downturn, and downturns are
usually hardest on the least productive firms. This creates an
opportunity for new, fast-growing, and more productive firms to
expand on the other side, offering laid-off workers better
matches and better wages to fuel an even stronger bounce back.
Tellingly, the Great Recession had less of a “cleansing” effect
on the economy than past recessions (meaning the rate at which
workers were reallocated from less productive to more productive
firms was far lower), in large part because new firm creation
rates were so weak in its aftermath. Steven Davis and John
Haltiwanger show this weakness was at least partly due to the
fact that the Great Recession was precipitated by a dual housing
and financial crisis, affecting both household equity and credit
markets—two essential sources of startup capital—severely. All
the same, one of the reasons the employment recovery from the
Great Recession took so long was because fewer startups were
there to help productively reabsorb the workers hit hardest by
the downturn. As a rule, established firms just do not grow
quickly enough during expansions to pick up all of the slack
they shed during downturns.
Boosting wages
Workers benefit when there is strong competition for their
labor. Yet, as high-growth young firms disappear and older
incumbents loom more dominant in labor markets, that beneficial
competition has weakened substantially. Ioana Marinescu
estimates that over 60 percent of local labor markets in the
United States are highly concentrated, covering one-fifth of the
U.S. workforce. Fewer employers means fewer potential buyers of
an individual’s labor and greater likelihood that a worker must
simply accept terms and wages set by whichever firm is hiring.
This imbalance not only translates into less job-to-job
mobility, but also into worse wage growth.
More competition among firms, by contrast, gives workers
leverage. With competing offers in hand and better alternatives
a click away, workers have more choice and power, and thus can
often bargain for higher pay. Nowhere is this more apparent than
in a comparison of wage growth rates for people who switch jobs
versus those who stay in their current jobs. Job switches are
strongly correlated with wage growth, both for the individual
and the broader economy.
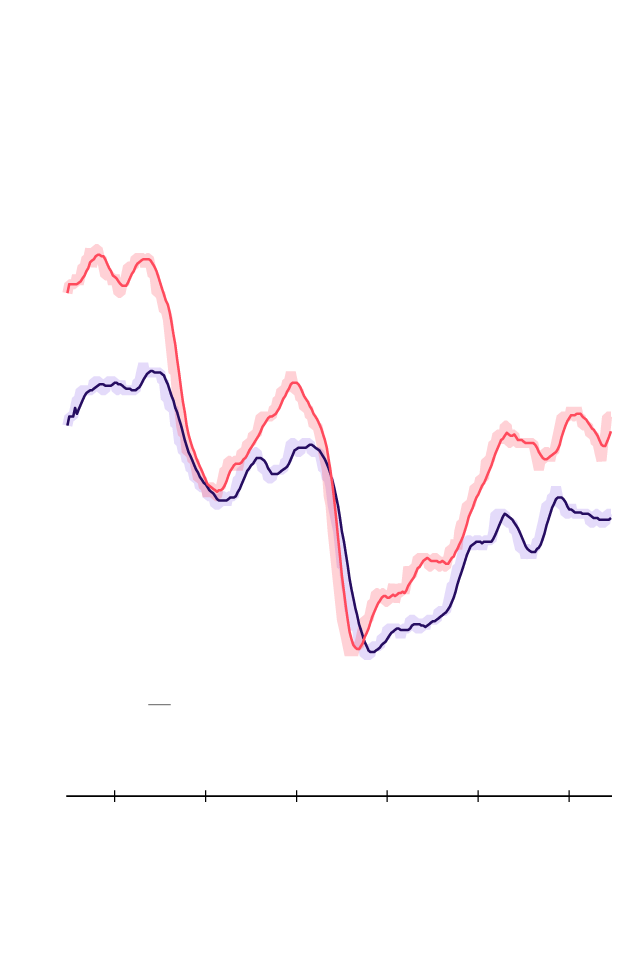
Job switchers
consistently enjoy
higher wage growth than
other workers
Median wage growth
6%
4%
2%
Recession
periods
0%
2000
2004
2008
2012
2016
2020
Source: Federal Reserve Bank of Atlanta’s
Wage Growth Tracker
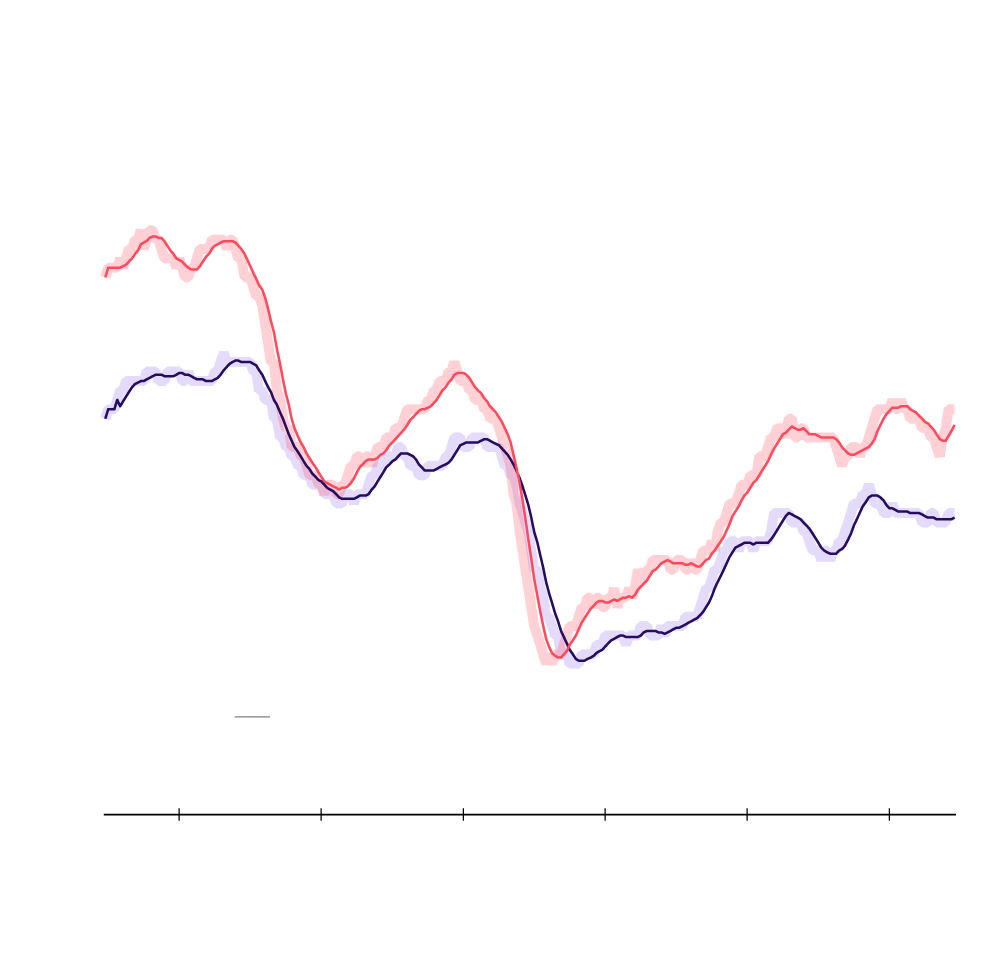
Job switchers
consistently enjoy higher wage
growth than other workers
Median wage growth
6%
4%
2%
Recession
periods
0%
2000
2004
2008
2012
2016
2020
Source: Federal Reserve Bank of Atlanta’s Wage
Growth Tracker
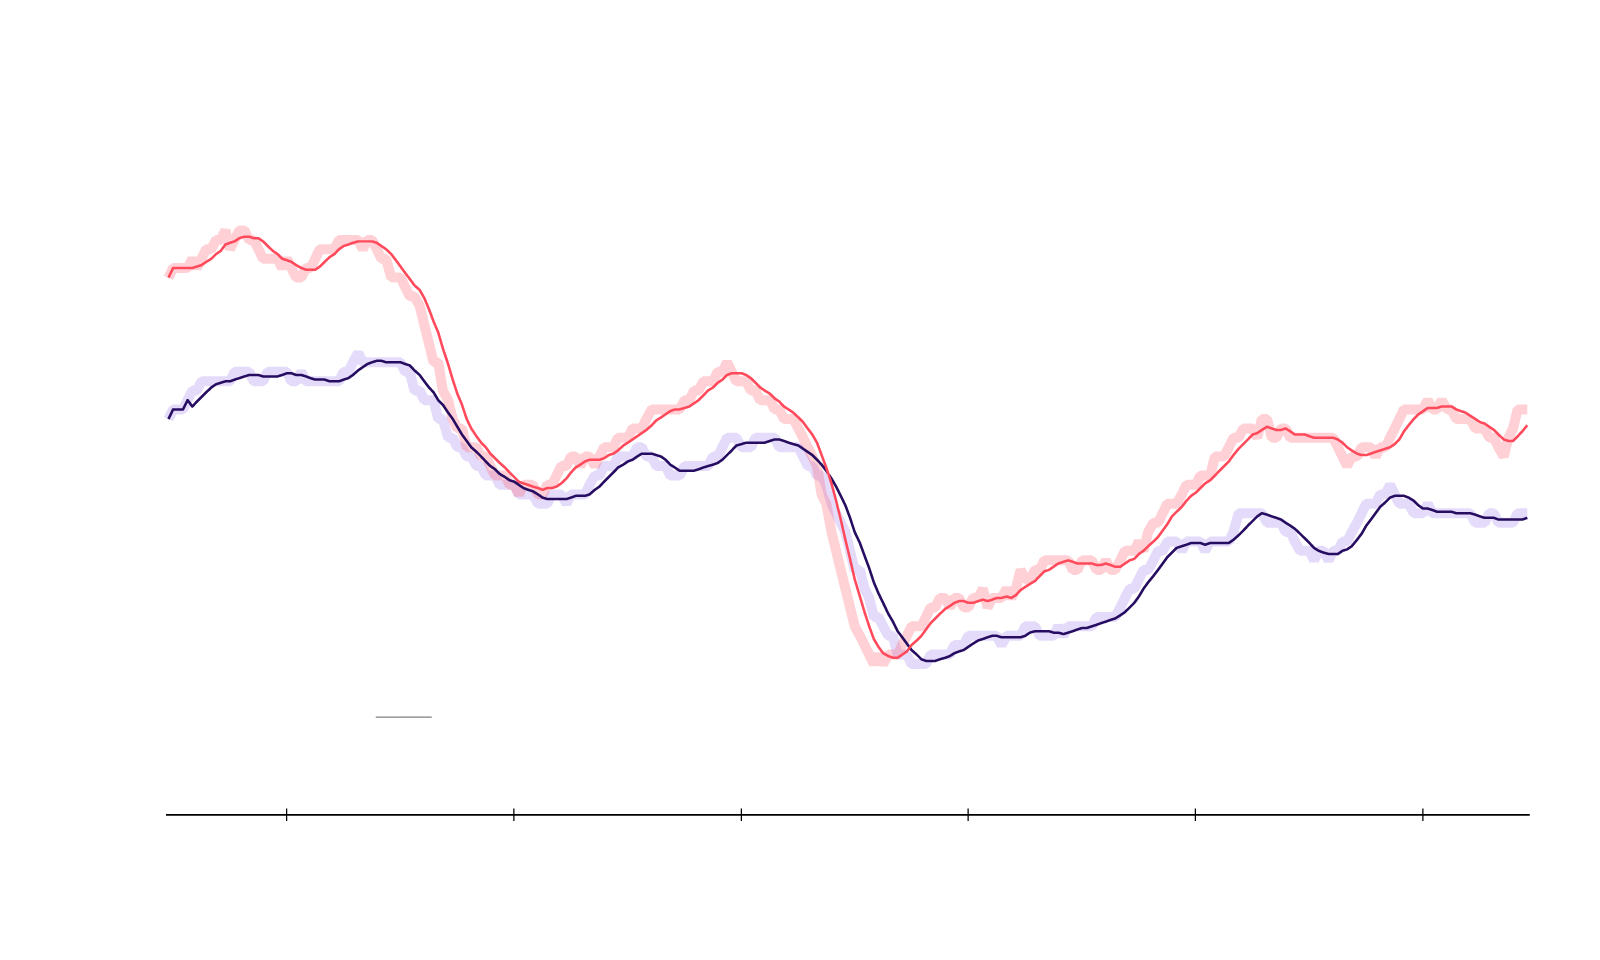
Job switchers
consistently enjoy higher wage
growth than other workers
Median wage growth
6%
4%
2%
Recession
periods
0%
2000
2004
2008
2012
2016
2020
Source: Federal Reserve Bank of Atlanta’s Wage
Growth Tracker
Even in the labor market, the role of startups as catalysts in a
dynamic system is critically important. The formation of new
firms and their subsequent hiring activity triggers job switches
that cascade through the labor market. These switches help
improve the quality of employer-employee matches. And as
discussed above, such labor market dynamism represents a broader
reallocation of the country’s workforce towards more productive,
faster-growing, higher-paying firms—an essential process for
sustaining the productivity growth that allows for living
standards to rise. Indeed, successful new startups generate much
of the country’s long-term productivity growth with their
innovations, which include new business models and new ways of
employing people. For individuals, job switching is a critical
method of accumulating human capital and associated with
stronger lifetime earnings.
Providing opportunities for less-advantaged workers
Robust startup rates and healthy labor market churn are
especially beneficial for workers with the weakest leverage in
the labor market,
particularly younger workers and those who have the lowest
levels of skill, wealth, social connections, or educational
attainment. Startups are disproportionately likely to hire young
people, immigrants, less-educated adults, and new labor market
entrants, for example. And Steve Davis and John Haltiwanger
calculate that when the workforce turnover rate (the sum of
total hires and separations over total employment) falls by 1
percentage point, the employment rate for men with less than a
high school diploma falls by 0.8 percentage points. It falls by
0.5 percentage points for equivalently-educated women (see
Figure 9). The situation is even worse for young workers in
their crucial early years in the labor market: for that same
decline of 1 percentage point in the worker turnover rate, the
employment rate for workers under the age of 25 with less than a
high school diploma declines by 1.4 percentage points for men
and 1.0 percentage point for women. Thus, less churn in the
labor market leads to less employment for those with the most
tenuous attachment to it. The slow recovery in turnover
following the Great Recession therefore seems correlated with
the slow jobs recovery experienced by so many segments of the
labor force (it took 13 years to recover all jobs lost in the
Great Recession, and not until 2019 did labor market turnover
recover to 2006 levels).
Less churn in the labor market
makes it harder for
jobseekers with
less education or work
experience
to find jobs
Change in employment from a 1 percentage
point decline in the worker turnover rate
Men
Women
Bachelor's
degree or more
-0.36%
-0.17%
Some college
-0.39%
-0.41%
High school
diploma
-0.61%
-0.16%
Less than a high
school diploma
-0.77%
-0.47%
Source: Davis and Haltiwanger. Working Paper 20479,
National Bureau of Economic Research, 2014
Less churn in the labor market makes it harder
for jobseekers with less
education or
work experience to find jobs
Change in employment from a 1 percentage point
decline in the worker turnover rate
Men
Women
Bachelor's
degree or more
-0.36%
-0.17%
-0.39%
Some college
-0.41%
High school
diploma
-0.61%
-0.16%
Less than a high
school diploma
-0.77%
-0.47%
Source: Davis and Haltiwanger. Working Paper 20479,
National Bureau of Economic Research, 2014
Less churn in the labor market makes it harder for
jobseekers with less education or work experience to find jobs
Change in employment from a 1 percentage point decline
in the worker turnover rate
Men
Women
Bachelor's
degree or more
-0.36%
-0.17%
-0.39%
-0.41%
Some college
High school
diploma
-0.61%
-0.16%
Less than a high
school diploma
-0.77%
-0.47%
Source: Davis and Haltiwanger. Working Paper 20479,
National Bureau of Economic Research, 2014
Job churn and opportunity go hand in hand because flux creates
more frequent job openings, allowing relatively disadvantaged
workers to get a foot on the first rung of a career ladder.
Labor market fluidity thus provides chances to limit spells of
unemployment, accrue critical on-the-job human capital, and seek
out progressively better job matches with higher wages.
Startups, meanwhile, tend to operate outside of the box and may
intentionally set out to hire from varied backgrounds. They
offer employment opportunities for individuals with greater risk
tolerances or particular ambitions and preferences that allow
for more non-standard matches to be made. In a less dynamic
labor market with fewer matches and fewer disruptive new
employers coming on the scene, workers from weaker positions or
untraditional backgrounds have a much harder time competing
successfully against those with stronger credentials, more
conventional career histories, or better connections. In other
words, a dynamic labor market in which new firms apply pressure
to incumbents and all firms are forced to compete harder for
labor helps those who are traditionally disadvantaged or
overlooked.
The symbiosis at the heart of creative destruction
Few events are as traumatic for a worker as losing a job when
their employer goes belly up. Yet the closing of unproductive
enterprises and the recycling of their assets into new and
better vocations is central to the healthy functioning of a
market economy–and to the longer-term well-being of workers
themselves.
Colorado shows the power of a high-churn, dynamic economy in
action. The state has a firm death rate averaging 8.4 percent
in recent years–higher than the 8.1 percent average national
rate. Yet its startup rate averaged 9.3 percent, higher than
the national startup rate and easily eclipsing the statewide
rate of firm closure. In fact, states with elevated firm death
rates tend to have even higher startup rates, underscoring how
creation and destruction intertwine to fuel business dynamism.
And what does higher firm-level churn mean for a state’s
workers? From prime age employment rates to wages at all tiers
of the distribution, Colorado outperforms the nation in terms
of worker well-being and the abundance of economic
opportunity.
Halfway across the country, Ohio demonstrates the false
promise of an economic “stability” premised on low rates of
churn and change. Only 6.9 percent of Ohio’s firms closed in
the average year leading up to the pandemic, well below the
national rate. Yet the intensity of renewal was even lower;
the state’s 6.0 percent startup rate over the past three years
was one of the lowest in the country. Fully fourth-fifths of
the state’s workforce enjoys the assumed security of working
for an old, established firm, but prime age employment is low,
and wages lag at all points in the distribution. Ohio–like all
of its peers across the Eastern Heartland–is already farther
down the slope of diminished dynamism than the country as a
whole, and its workers are worse off as a result. In the
country’s lagging regions, stasis is the problem. To break out
of it, the velocity of creative destruction needs to be
rekindled.
Dynamic economies
outperform
static ones across
measures
of opportunity
Difference to national average in %
National Avg.
−6%
−3%
+3%
+6%
Ohio
Colorado
Average startup rate 2017-2019
6.0%
9.3%
8.2%
Average firm death rate 2017-2019
6.9%
8.4%
8.1%
Share of workers in younger firms
19.4%
29.2%
25.1%
Job reallocation rate
19.2%
22.1%
20.3%
Prime age employment rate
79.2%
84.3%
79.6%
Difference to national average in $
−2$
−1$
+$1
+$2
Wages (25th percentile)
$12.1
$14.9
$12.9
Wages (50th percentile)
$18.7
$21.3
$19.4
Source: U.S. Census Bureau’s Business Dynamics
Statistics, 2019; U.S. Census Bureau’s Current
Population Survey, 2018
Dynamic economies
outperform static ones
across measures of opportunity
National Avg.
−6%
−3%
+3%
+6%
Difference
to national
average in %
Colorado
Ohio
Average startup
rate 2017-2019
6.0%
9.3%
8.2%
Average firm death
rate 2017-2019
6.9%
8.4%
8.1%
Share of workers in
younger firms
19.4%
29.2%
25.1%
Job reallocation
rate
19.2%
22.1%
20.3%
Prime age
employment rate
79.2%
84.3%
79.6%
Difference
to national
average in $
−2$
−1$
+$1
+$2
Wages
25th percentile
$12.1
$14.9
$12.9
Wages
50th percentile
$18.7
$21.3
$19.4
Source: U.S. Census Bureau’s Business Dynamics
Statistics, 2019;
U.S. Census Bureau’s Current Population Survey,
2018
Dynamic economies
outperform
static ones across
measures of opportunity
National Avg.
Difference to national
average in %
−6%
−3%
+3%
+6%
Ohio
Colorado
Average startup
rate 2017-2019
6.1%
9.3%
8.2%
Average firm death
rate 2017-2019
6.9%
8.4%
8.1%
Share of workers in
younger firms
19.4%
29.2%
25.1%
Job reallocation
rate
19.2%
22.1%
20.3%
Prime age
employment rate
79.2%
84.3%
79.6%
Difference to national
average in $
−2$
−1$
+$1
+$2
Wages
25th percentile
$12.1
$14.9
$12.9
Wages
50th percentile
$18.7
$21.3
$19.4
Source: U.S. Census Bureau’s Business Dynamics
Statistics, 2019; U.S. Census Bureau’s Current
Population Survey, 2018
03 The Path to Renewal
As the country emerges from the COVID-19 pandemic, policymakers
confront a high-stakes opportunity to restore U.S. economic
dynamism and forge a more optimistic, aspirational future for
American workers. We believe such an agenda should start with
three fundamental policy goals that would deliver large and
pervasive benefits for all Americans:
First, dismantle federal- and state-level barriers to
competition and mobility in the labor market so that workers
can access the jobs they want, in the places they choose, at
the wages they deserve.
Second, embrace our national advantage as a magnet for
skilled immigration to fuel entrepreneurship and innovation,
boost demand for American workers, and support the revival
of struggling regions.
Third, end the tyranny of NIMBYism to make it easier,
faster, and more cost-efficient to build housing and
infrastructure so that America’s built environment can
accelerate, rather than stifle, economic adaptation and
resiliency.
While the political challenges of achieving these goals are not
insignificant, their budgetary impacts would be. At a time when
the sticker shock of federal spending has itself become a major
barrier to legislative progress, the U.S. can nevertheless reap
massive economic rewards from extremely low-cost policy
initiatives. Let’s look at each in turn.
Dismantle barriers to competition, mobility, and knowledge
diffusion in the labor market
Entrenched interests, usually in the form of incumbent
businesses, industries, and professional licensing and lobbying
associations have succeeded at steadily reducing the forces of
competition that benefit American workers. Gatekeeping
incumbents have used law and regulation to restrict how and
where workers can deploy their talents in the labor market,
while policymakers have largely been asleep at the wheel. In
fact, we’ve come to accept interference in the basic competitive
functions of the labor market as a normal part of life, rather
than a sometimes necessary exception. And workers have paid the
price. A dynamism agenda should start with aggressively rooting
out barriers that limit Americans’ ability to take risks, build
businesses, switch jobs, or move to different parts of the
country.
Nothing better sums up the creeping shift away from dynamism
than the proliferation of non-compete agreements. Non-competes
prohibit workers from fully exercising their freedom to switch
jobs for better opportunities or to use their work experience to
start a new business. A worker subject to such an agreement
signs a contract preventing them from becoming or working for a
“competitor” to their former employer in the near future, often
even if they are laid off or fired. Practically, non-competes
block workers from being poached for higher pay, jumping to a
peer company for better benefits or working conditions, spinning
out to create their own new and related enterprise, or even
deploying their talents in a new high-growth startup that could
become their community’s next major anchor employer. The
academic literature finds negative effects of non-competes
across the board, from stifling entrepreneurship and blunting
competition in product markets to suppressing worker wages and
reducing the survival rate of young firms. Economists including
Michael Lipsitz and Evan Starr have also found immediate worker
benefits in states that have curtailed their use.
Non-compete agreements are anathema to the basic principles of a
free and fair market, yet they have proliferated rapidly:
Low-end estimates suggest they cover nearly one-fifth of all
U.S. workers, including millions of low-wage workers in
industries such as fast food restaurants, custodial services,
and transportation. They are often quite difficult for workers
to challenge in legal settings. As a result, non-competes trap
millions of workers in their current jobs. Fortunately,
progressive and conservative reformers alike have taken notice.
For example, the bipartisan Workforce Mobility Act currently
before Congress would ban the use of these agreements nationwide
under most circumstances. Not waiting for Congress to act, many
states are taking meaningful steps to curtail the use and abuse
of non-competes: fully half of all states considered
non-competes reform in 2021 alone.
Just as non-competes give employers the means to limit
competition for their workers, onerous occupational licensing
requirements enable incumbent businesses to erect barriers to
competition within their industries. Seminal research by Morris
Kleiner demonstrates that licensing requirements applied to an
estimated 1 in 20 U.S. workers in 1950 but have since spread to
an estimated 29 percent of the workforce. Overly expansive
licensure has been shown to impose higher prices on consumers,
restrict the geographic mobility of licensed workers, raise the
costs associated with entering into certain professions, and
reduce the wages and economic opportunities of unlicensed
workers. These drawbacks have motivated bipartisan calls for
reform focused on rigorous cost-benefit analyses, uniform
standards and reciprocity across states, and outright
elimination of requirements for entry into certain professions.
The proliferation of non-competes and licensing requirements
have harmed U.S. dynamism in another way: reducing the spread of
knowledge and know-how throughout the economy. By making it more
difficult to switch to better jobs, start a better company, and
move to a better area, they weaken the invisible circulatory
system that distributes expertise and makes innovation and
productivity gains possible.
The exigencies of the pandemic have revealed the costs of such
labor market distortions. Millions of workers have gone
freelance and don’t want to go back to a traditional work
setting. States have suspended certain licensing requirements or
adopted reciprocity with other states specifically for
healthcare workers in order to fill critical skill gaps. The
worker shortage across the economy may make employers more
amenable to non-competes reform, too, as the cost of measures
that gum up the labor market make themselves felt more acutely.
Embrace our immigration advantage
Better immigration policy is one of the most powerful tools
available for boosting American dynamism. However, our current
immigration regime is ad hoc and poorly designed, and it fails
to place sufficient emphasis on maximizing the economic benefits
of immigration to the American economy and its workers. To boot,
the number of legal immigrants into the United States has
dropped severely in recent years due to policy shifts, pandemic
effects, and a bureaucracy crumbling under its own weight and
unable to process even simple visa renewals. The result was a
multi-decade low in net international migration in 2021, falling
three-quarters from over 1 million net newcomers in 2016 to
fewer than 250,000 in 2021.
The case for high-skilled immigration should be self-evident.
Skilled workers offer high local economic “multipliers,” given
their higher wages, meaning their economic contributions locally
and nationally are positive and outsized. Knowledge
workers—native and foreign-born alike—are complementary to each
other, and demand for knowledge workers is nearly unlimited in
today’s economy; the supply of them is the binding constraint on
economic growth. Thus, the conventional worries about
substitution or crowd-out with vulnerable native born workers
that plague political debates over immigration do not apply.
Instead, welcoming more highly skilled immigrants would help the
country perform at the frontiers of its potential.
Research by Pierre Azoulay and colleagues also shows that
immigrants’ propensity towards entrepreneurship means they play
a much more significant role as “job creators” than “job takers”
in the U.S. economy. Put immigrants’ many economic roles
together and their consumption, investment, and entrepreneurship
all help to boost demand for domestic labor, supporting native
employment and wages. Importantly, expanding the flow of
high-skilled immigration would yield powerful benefits
throughout our economy quickly and at extremely low cost.
It is difficult to overstate how badly today’s U.S. immigration
policy falls short of its potential. This country is unique in
its status as the overwhelmingly preferred destination of
would-be migrants across the world. As such, simply by enacting
sensible policies, we can enjoy the presumption of practically
limitless access to scientists, engineers, medical
professionals, and other in-demand talent the world over. This
attractiveness to talent is arguably the single greatest
advantage any nation can possess. But instead of embracing it,
we continue to languish in an incoherent and self-defeating
approach that fails to identify the right goals or facilitate
the best outcomes. We must do better.
Pro-dynamism immigration reform should start by improving
existing pathways like the H-1B visa so that they are easier to
administer, decoupled from a single employer, and more readily
accessible to new, small, and medium-sized enterprises. But
improving existing pathways is only the beginning. The United
States needs new pathways for skilled immigrants that are linked
to specific goals, namely: increasing entrepreneurship, boosting
STEM talent in the workforce, and bolstering the economic
well-being of lagging regions. And rather than caps, our skilled
immigration policy should be oriented around aggressive targets
for welcoming the world’s most talented and hard-working people.
Perhaps the most obvious way to expand high-skilled immigration
is by creating a startup visa for immigrant entrepreneurs. Such
a program would create a special fast-track for those with
promising ideas, proven fundraising ability, and the desire to
build their businesses in the United States and create jobs for
native-born Americans. Immigrants already contribute in profound
ways to American entrepreneurship. On average, immigrants are
significantly more likely to start a business than native-born
Americans, and they are responsible for founding a large share
of today’s biggest and most successful companies. The global
competition for entrepreneurial talent will only grow fiercer in
the coming decades. Establishing a startup visa is an excellent
way to help ensure that the short-run boom in pandemic-era
startups leads to a lasting and widely beneficial revival in
American entrepreneurship.
The United States should also employ immigration as a regional
economic development tool. For example, a place-based “heartland
visa” would provide benefits and incentives to skilled
immigrants who settle in parts of the country contending with
economic stagnation and the loss of prime age workers. The
economic impact would go beyond supplying needed skills to local
businesses. Newcomers would bolster housing markets, supporting
the wealth of local residents. They would fortify municipal tax
bases, thereby improving services for native families. Their
presence would improve local economic prospects, drawing new
businesses and employers to places struggling with attrition.
And since immigrants have a high propensity for
entrepreneurship, heartland visas would recruit people
disproportionately likely to start businesses and drive growth
in the future to areas that have been left behind. While
immigrants have long played these important roles in legacy
cities, national immigration policy itself hasn’t been designed
with the needs of such communities in mind. It’s time for that
to change.
Boosting immigration would also help address one of the major
forces behind the decline of U.S. dynamism: rapid demographic
decline. Indeed, the precipitous drops in fertility and
population growth now underway in the United States represent an
unprecedented challenge for policymakers. Never before has this
country had to confront the reality of sustained demographic
decline or a shrinking prime-age workforce. America may never
again achieve the demographic vitality that characterized the
20th century, but we need not accept the dire consequences of
demographic collapse.
Build, baby, build!
The built environment must be adaptable for the economy to
evolve. Local housing supplies must be elastic enough to ensure
that hubs of innovation can also serve as destinations for
workers seeking better opportunities. Cleaner technologies must
be both manufactured and deployed in order to decarbonize the
economy. Productivity-enhancing infrastructure investments must
be realized to deliver social and economic dividends. But on all
of these fronts, the United States has become mired in a costly
artificial paralysis that has turned our nation’s built
environment into a hostage of interests deeply opposed to its
continued development.
The practical inability to build so many things across so much
of the country is an almost entirely self-inflicted wound and
serves as a hefty tax on American dynamism. We’ve allowed
pervasive, supply-constraining regulations to disfigure the
housing market—and then are puzzled over why housing is so
scarce and expensive in places where demand is the highest.
We’ve allowed poorly designed policy and regulatory complexity
to make efficient infrastructure spending impossible—and then
wondered why our basic infrastructure is the most expensive to
build of anywhere in the developed world. We hear countless
exhortations about the threat of climate change–then watch as
the necessary process of transitioning to a cleaner energy
economy get stymied in the purgatory of permitting hurdles and
community-level vetoes.
Simply put: NIMBYism has become nothing short of a monumental
threat to progress and prosperity.
Aggressive local, state, and federal leadership will be required
to pull the country out of the morass of regulatory barriers and
stakeholder vetoes that prevent the foundation of the future
from even being laid. A handful of localities across the country
have begun the slow process of reforming local land-use and
zoning codes in recognition of how exclusionary practices have
driven up housing prices, fueled inequality, and undermined
economic prospects and wealth accumulation for low-income
families. More states should follow the lead of Massachusetts,
for example, which signed into law in January 2021 a requirement
that municipalities allow for multi-family real estate
development around transit stations. The core goal for reformers
should be simple: allow more of the U.S. housing market to
function as an actual market—one in which demand can efficiently
be met with supply, and special interests are not empowered to
block progress at every turn.
States and the federal government should fully leverage the
power of the purse to incentivize state and local land-use
reform. Our federalist system grants localities considerable
rights around land use, but that does not mean the federal
government must remain agnostic about local planning decisions
and subsidize regressive practices with far-reaching negative
externalities. Instead, eligibility for key funding streams
around infrastructure and housing, to name a few, should be
predicated on a minimum level of land use liberalization and
procedural efficiency. Places that implement best practices
should be rewarded accordingly. And federal lawmakers need at
long last to tackle the massive policy-related inefficiencies
that plague federal infrastructure spending and dilute its
economic benefits. At the end of the day, how much is spent on
infrastructure–the question that still dominates political
discussions–only matters in relation to how efficiently that
money is actually spent.
These three pillars are of course only the beginning of a fully
formed dynamism agenda. We also need greater and more effective
federal investment in basic research and development, for
example, as well as a modernized approach to innovation policy.
We need a social safety net that encourages the kinds of healthy
risk-taking that is essential to a mobile and entrepreneurial
society. We must do better at retraining workers and helping
them rebound from economic shocks. We should examine how our
system of intellectual property protections can be improved to
balance tradeoffs and prevent abuses that work against the
public interest. And drawing from the lessons of the tepid
recovery from the Great Recession, we need a macroeconomic
policy environment that pushes the labor market to operate at
full employment, with all the attendant benefits it achieves for
American workers.
At its heart, the task is to improve the economy’s circulatory
system so that it can naturally deliver better outcomes for
workers, families, and communities, thereby limiting the scale
and cost of other interventions.
Conclusion
Working Americans have far more to lose from an economy that is
changing too little and too slowly than from one that is quickly
adapting and advancing to new frontiers. To see that this is
true, we need only look back to our not-too-distant past, when
standards of living were booming alongside rates of mobility,
job switching, population growth, and startup activity that make
those of the 21st century seem anemic by comparison.
But in recent decades, policymakers have ignored signs that the
dynamic mechanisms at the heart of our economy were growing
weaker. Worse still, policy failures at every level of
government have contributed to the sclerosis that has slowly
robbed the country of its vitality. From NIMBYs to non-competes,
vested interests have steadily weighed the economy down with
artificial barriers to mobility, competition, and adaptation.
These barriers have made our economy less abundant in
opportunity and less able to improve the lives of ordinary
Americans.
There are many reasons to be hopeful in spite of the challenges.
The United States remains an enormously prosperous and capable
country—one with unique cultural and economic advantages, such
as our historic openness to change, our embrace of pluralism,
and a deep-seated, ambitious brand of optimism. The speed and
resiliency with which the U.S. economy adapted to the
coronavirus pandemic are proof that the country’s dynamism may
have subsided, but its embers can be rekindled. Now,
policymakers must seize the opportunity to turn temporary gains
into something sustainable, securing a dynamic and prosperous
future for generations of American workers to come.