Is the American Dream Alive or Dead? It Depends on Where You Look

The 2016 election exposed deep social, geographic, and economic rifts crossing the United States. Since November, a flurry of new research into economic mobility and income inequality has added to our understanding of these divides. Now, EIG offers its latest contribution to the discussion. We have joined county-level data from our Distressed Communities Index (DCI) with the economic mobility estimates created by Raj Chetty’s team at Harvard’s Equality of Opportunity Project (EOP) to examine the relationship between economic well-being (as measured by the DCI) and economic opportunity (as measured by the EOP) in communities across the United States.
Our analysis finds a clear correlation between the degree of prosperity or distress in a county and the extent to which it boosts or hinders the future earnings potential of the children who grow up there. However, exceptions abound: Numerous ostensibly prosperous counties fail to boost economic opportunity for young people from poor backgrounds, just as a handful of economically distressed counties still manage to endow their children with the hard and soft skills needed to climb the ladder. With more than half of all U.S. counties exerting a negative impact on children’s future earnings, this analysis finds an American Dream unequivocally at risk. Whether it goes on to further retreat or future renewal will depend on whether the recipe offered by places where it is alive and well proves replicable in the country’s less hopeful corners.
Introduction
Place matters. While many like to think of the United States as a country where anyone willing to work hard can succeed, the reality for many is more complicated. The American Dream lies far out of reach for young people across much of the country not due to any individual shortcomings, but due to the unique mix of social, cultural, and economic forces at work in their communities—forces that condition and affect, if not always determine, lifetime outcomes.
Raj Chetty, Nathaniel Hendren, and their colleagues at Harvard University’s Equality of Opportunity Project (EOP) set out to measure these effects of place on children’s earnings as adults (so called neighborhood effects). They controlled for a large number of individual and family characteristics in order to isolate the effect of place alone, which they call the “childhood exposure effect.” It measures the percent increase or decrease in income at age 26 relative to the national mean that a child can expect by spending one additional year in any given county. Some counties have positive exposure effects (boosting incomes), some negative (reducing them).
EIG merged EOP’s data on economic mobility with its own Distressed Communities Index (DCI) data on economic well-being to produce a dynamic analysis of how the economic situation in a place today may impact the economic opportunities of its residents tomorrow. Of course, we cannot see the future, and this piece only extrapolates the childhood exposure effects documented in EOP’s work (based on the incomes at age 26 of children born from 1980 to 1986) by associating them with the prevailing economic conditions in counties from 2010 to 2014. The results are therefore best interpreted as whether, for example, a county that is prospering today has a history (or not) of boosting economic mobility. Whether the county delivers on or defies past performance remains to be seen.
What is the state of the American Dream?
In concrete terms, the American Dream can be summed up as a two-fold promise of prosperity and mobility. Neither is in good health. Figure 1 draws from the DCI to show the immense gap in well-being that separates the country’s most prosperous and most distressed communities. Research from The Hamilton Project meanwhile finds that a child born into a family in the bottom 20 percent of the income distribution has only a 4 percent chance of rising into the top 20 percent of the distribution as an adult. The EOP extended these insights to show that mobility rates vary immensely across counties and metro areas.
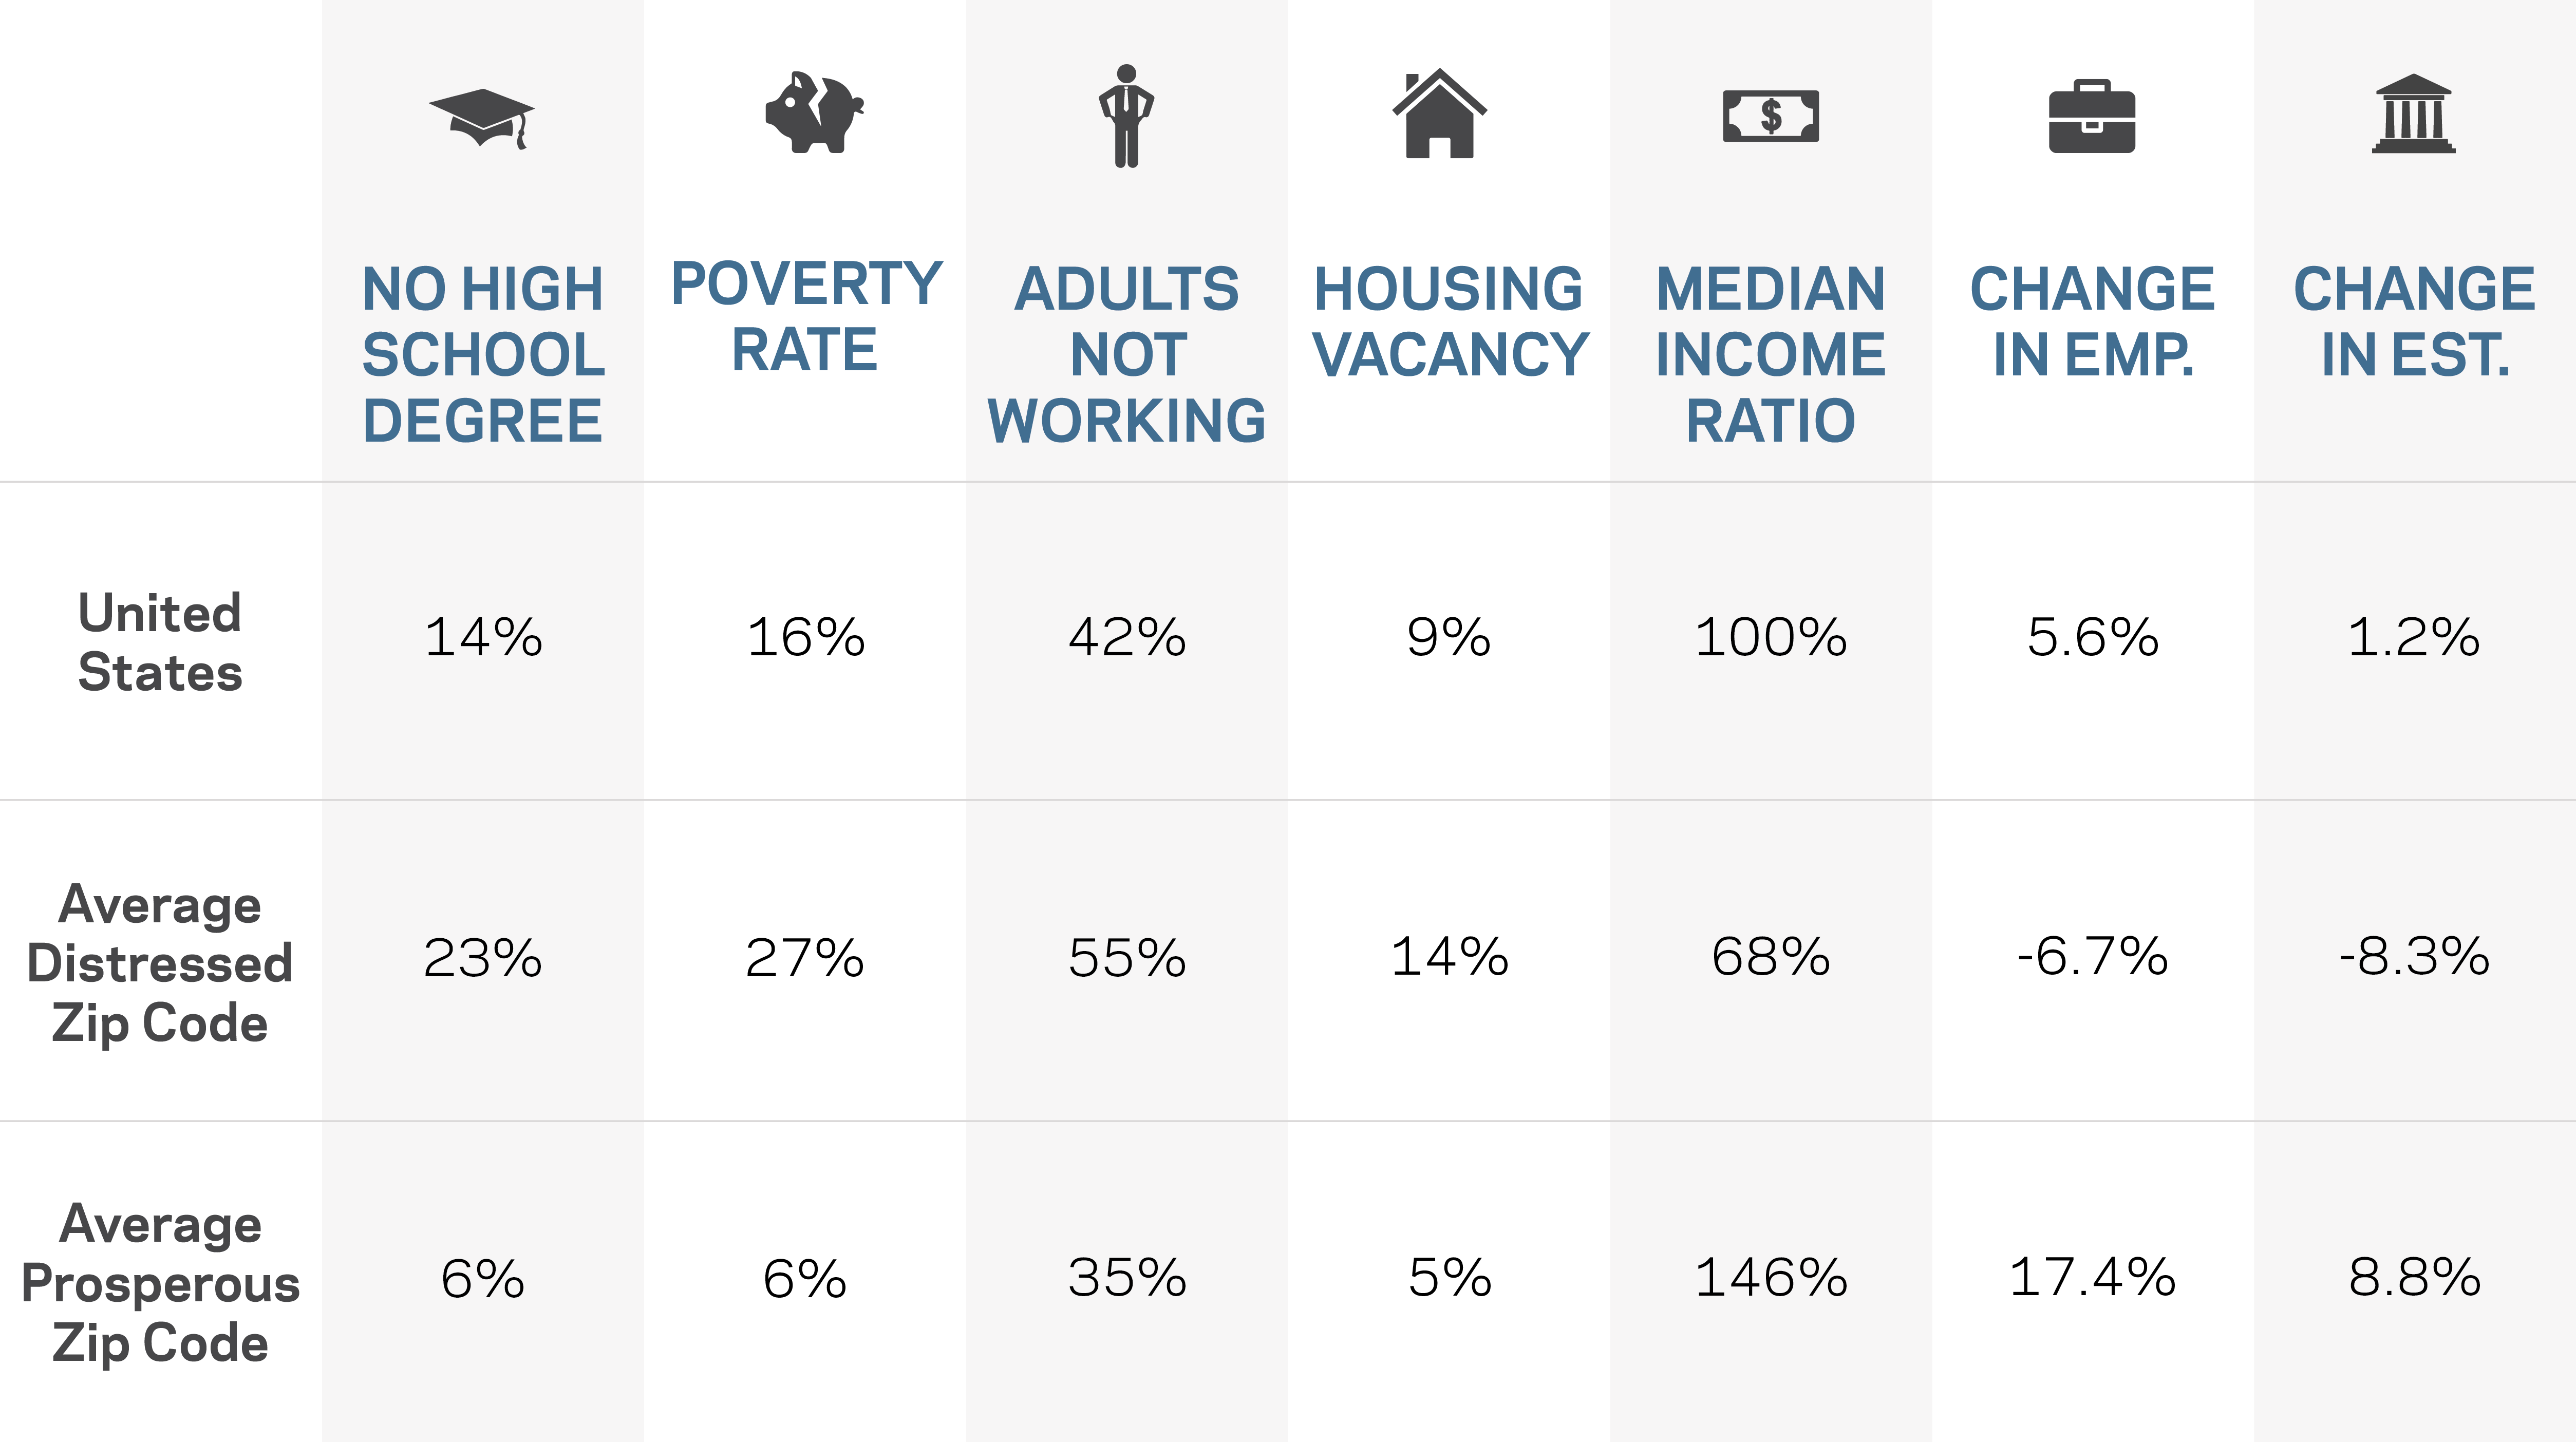
Source: EIG’s Distressed Communities Index, 2016
So how do these dual components of the American Dream relate to one another? Is prosperity a prerequisite for mobility at the local level?
Nationwide, across the 2,869 counties for which we have data, economic prosperity and economic mobility are positively and meaningfully correlated. The correlation is stronger for children from poor backgrounds than it is for children from better-off ones. This means that prosperous locales give poor children a disproportionate boost, on the one hand, but also that growing up in a distressed community disadvantages them relatively more, as well. Kids from wealthier backgrounds, by contrast, appear to have a stronger bulwark against negative effects of place. Poor children are more vulnerable.
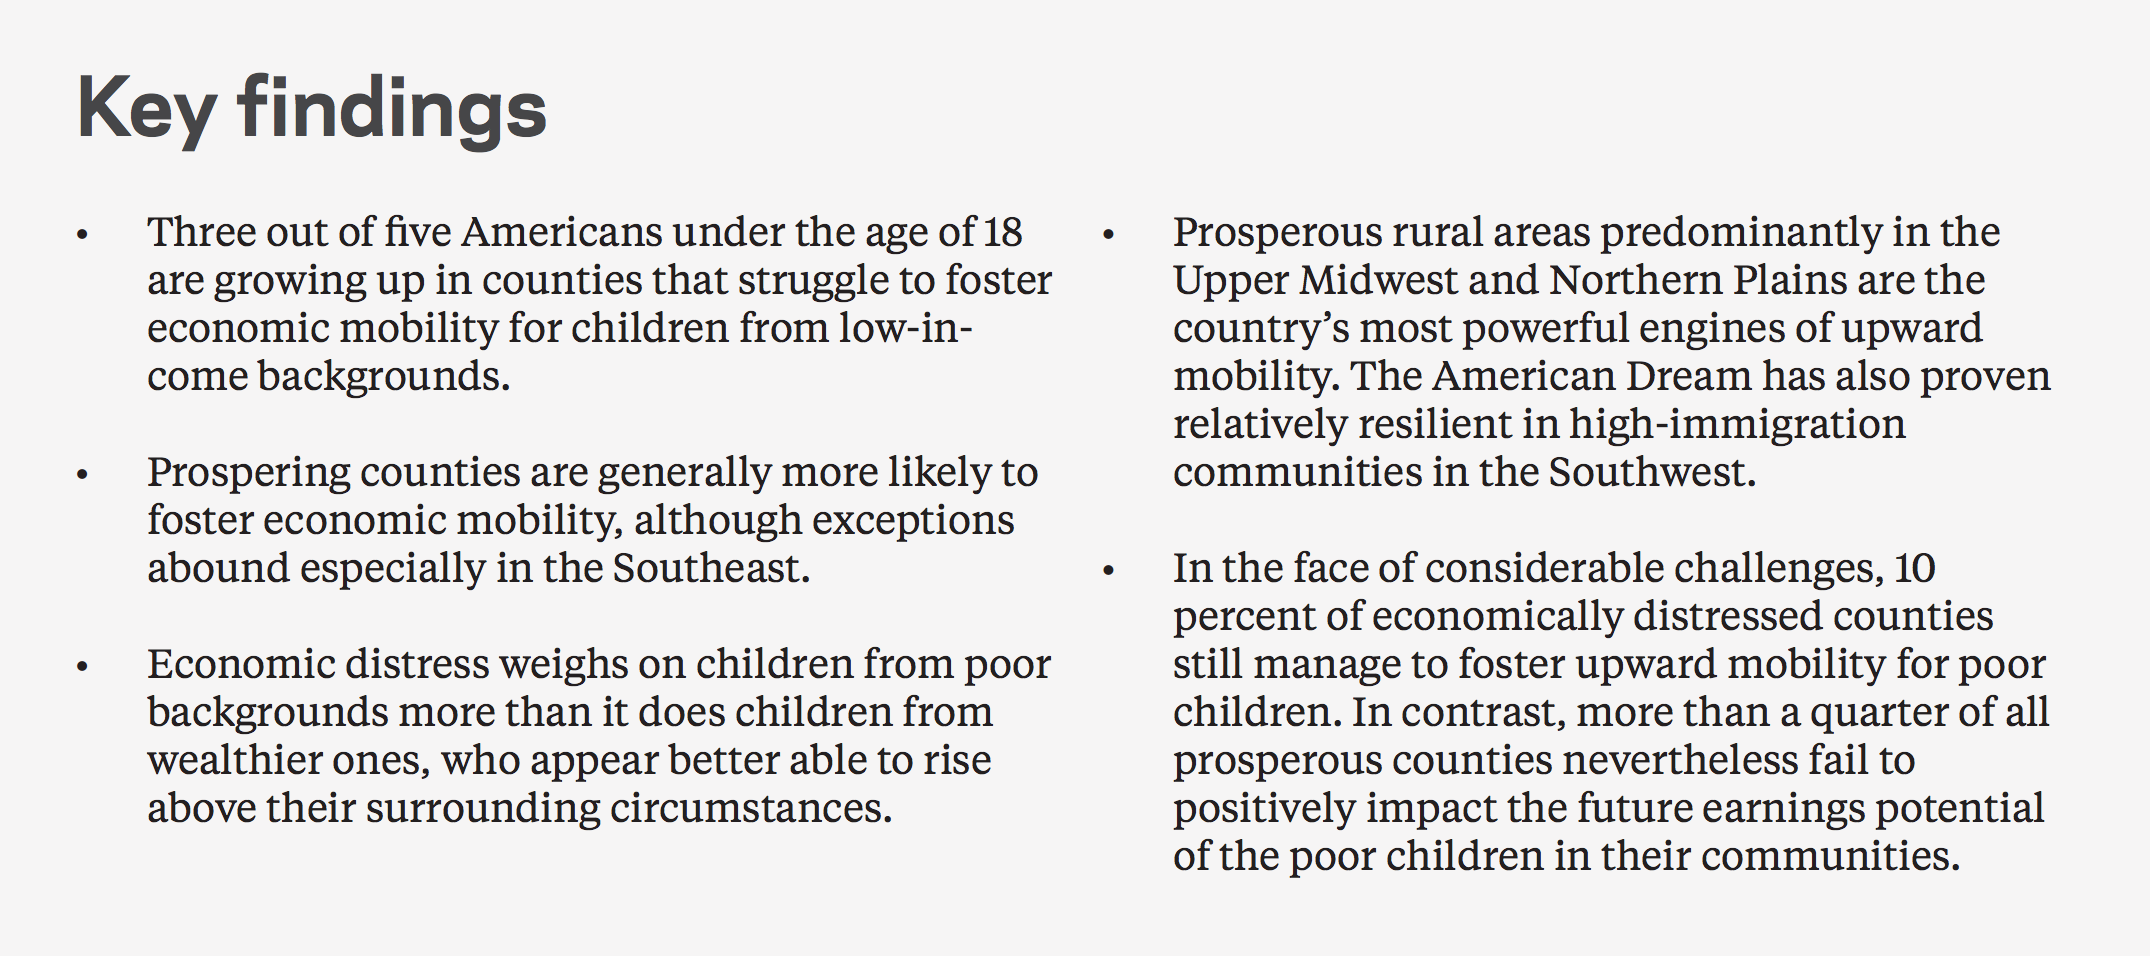
Overall, the majority (51 percent) of counties in the United States exert a negative impact on the economic mobility of low-income children, and these 1,660 counties are home to 60 percent of Americans under the age of 18. Three out of five of today’s children are growing up in a county that has historically failed to provide their most disadvantaged youth a leg up.
Figure 2. County causal effect on income mobility for children from poor backgrounds from the Equality of Opportunity Project
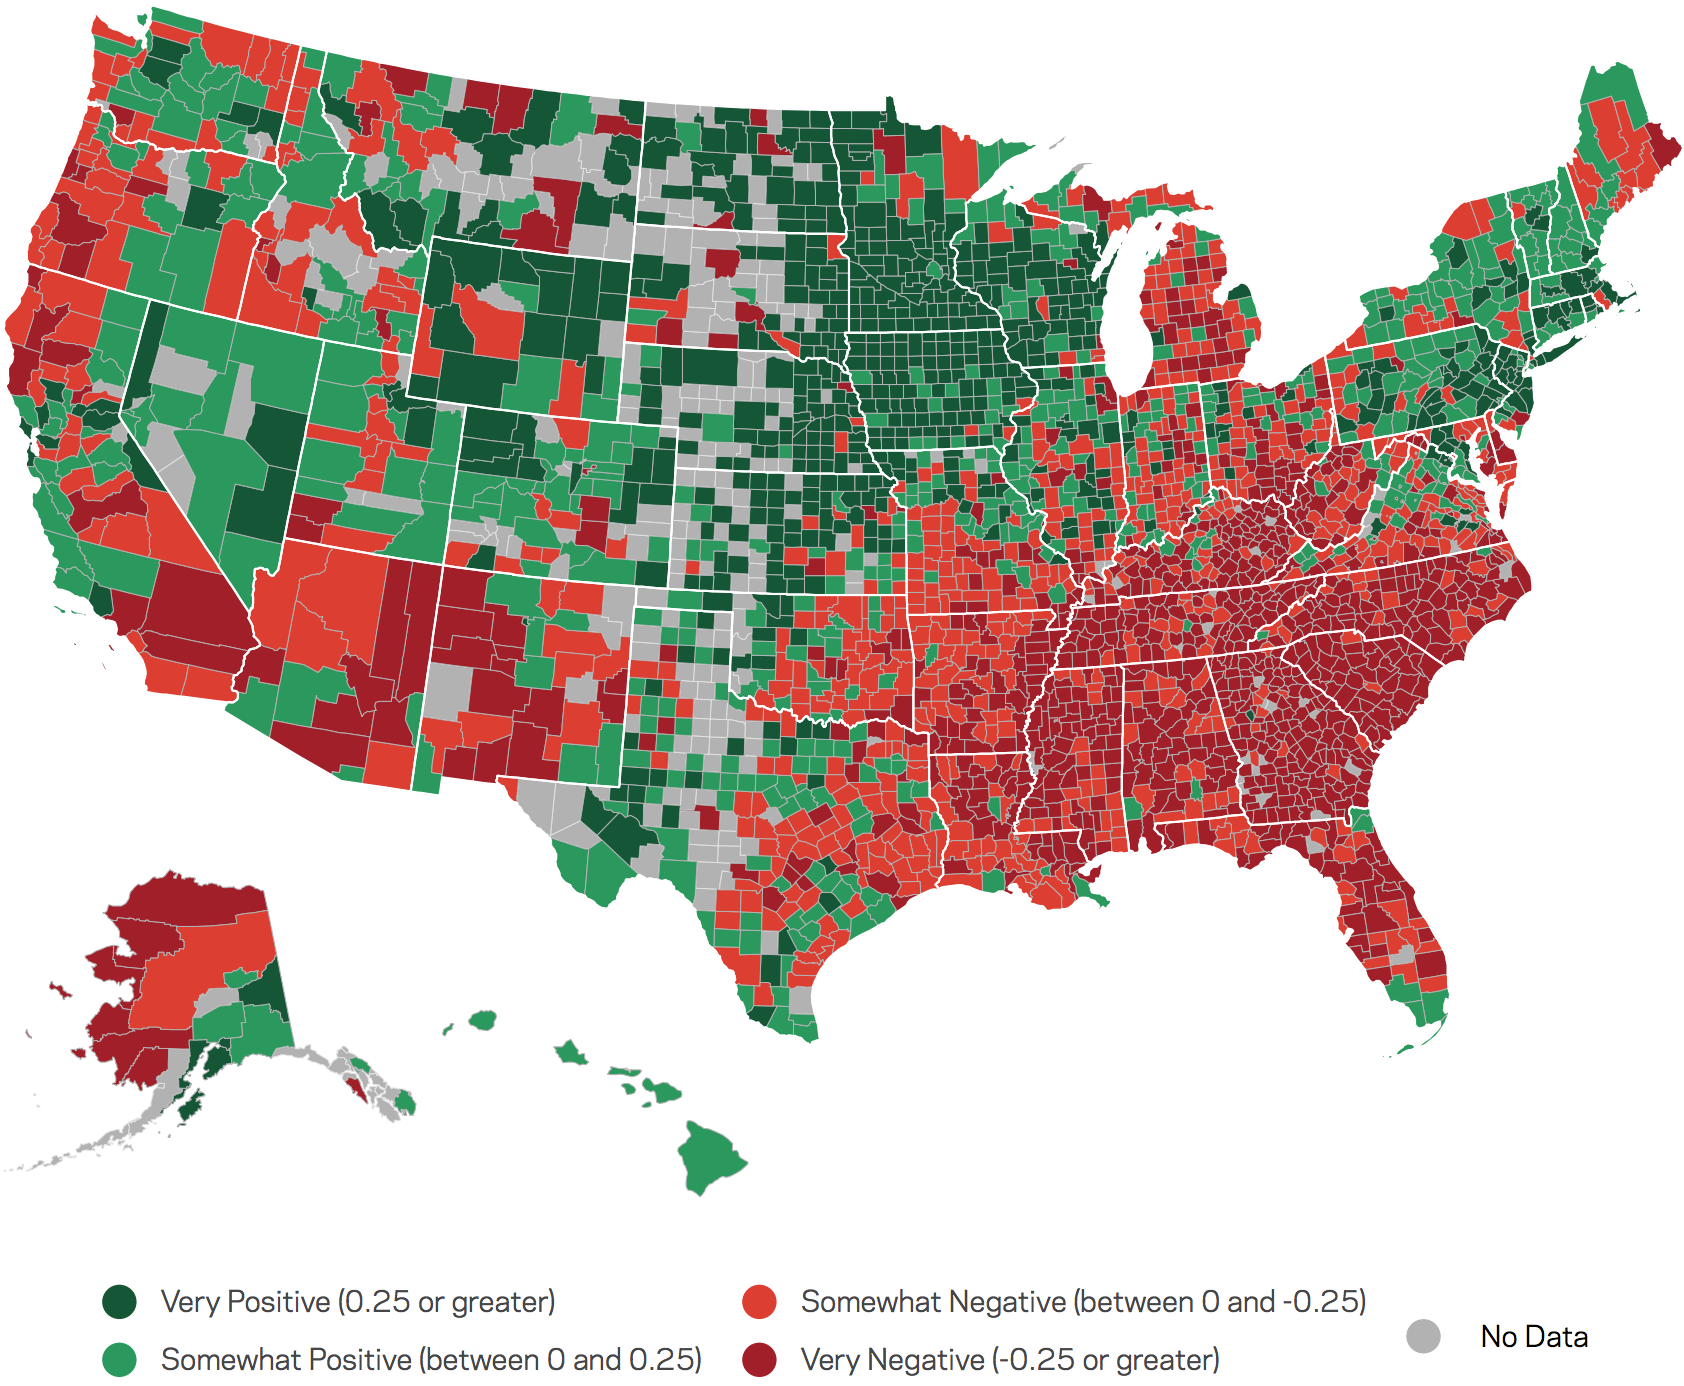
Source: Raj Chetty and Nathaniel Hendren, “The Effects of Neighborhood on Intergenerational Mobility,” 2015. Obtained from the Equality of Opportunity Project website, “Online Data Table 4 County Causal Effects,” in Summer 2016.
Adding population data to EOP’s county estimates, we find that prosperity and mobility (as well as distress and immobility) are most strongly correlated in rural areas—counties with under 100,000 people. Prosperous rural areas can provide a significantly greater boost to children than even prosperous urban areas, suggesting that the quintessential engine of economic mobility may not be the urban melting pots of Horatio Alger-style myth, but rather the small town communities of the Upper Midwest. Cities, however, are more consistent: 50 percent of large urban counties (those with more than 500,000 people) provide an income boost to poor kids, compared to only 43 percent of rural counties for which we have data.
The many different realities of the American Dream
Next we zoom in on the ends of the spectrum of American experiences by examining economic mobility in the country’s most prosperous and most distressed counties (the top and bottom quintiles of well-being on the DCI). What emerges is a mosaic of places—an American reality in which the dual promises of prosperity and mobility fall into four categories depending on where one looks and where one lives: alive and well, within reach against the odds, fenced off, or a distant prospect. Here we’ll explore each reality in turn:
Places where the American Dream is…
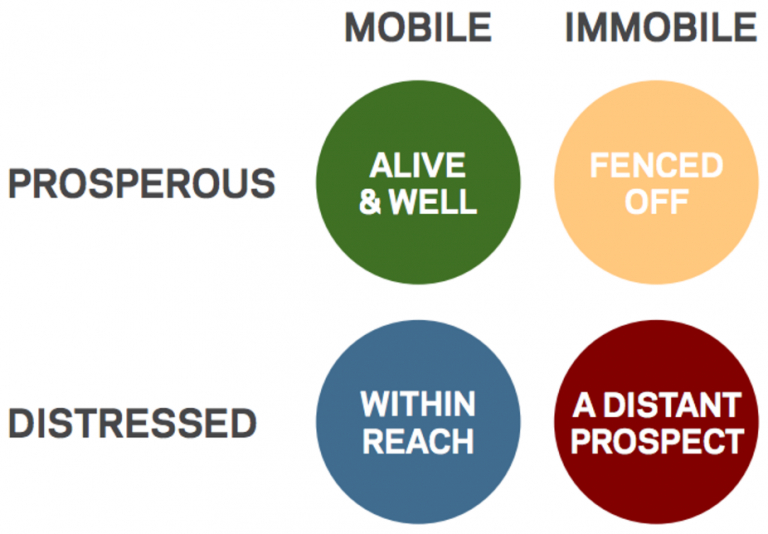
Figure 3. Categorizing the United States’ most prosperous and distressed counties by their impact on the future income mobility of poor children
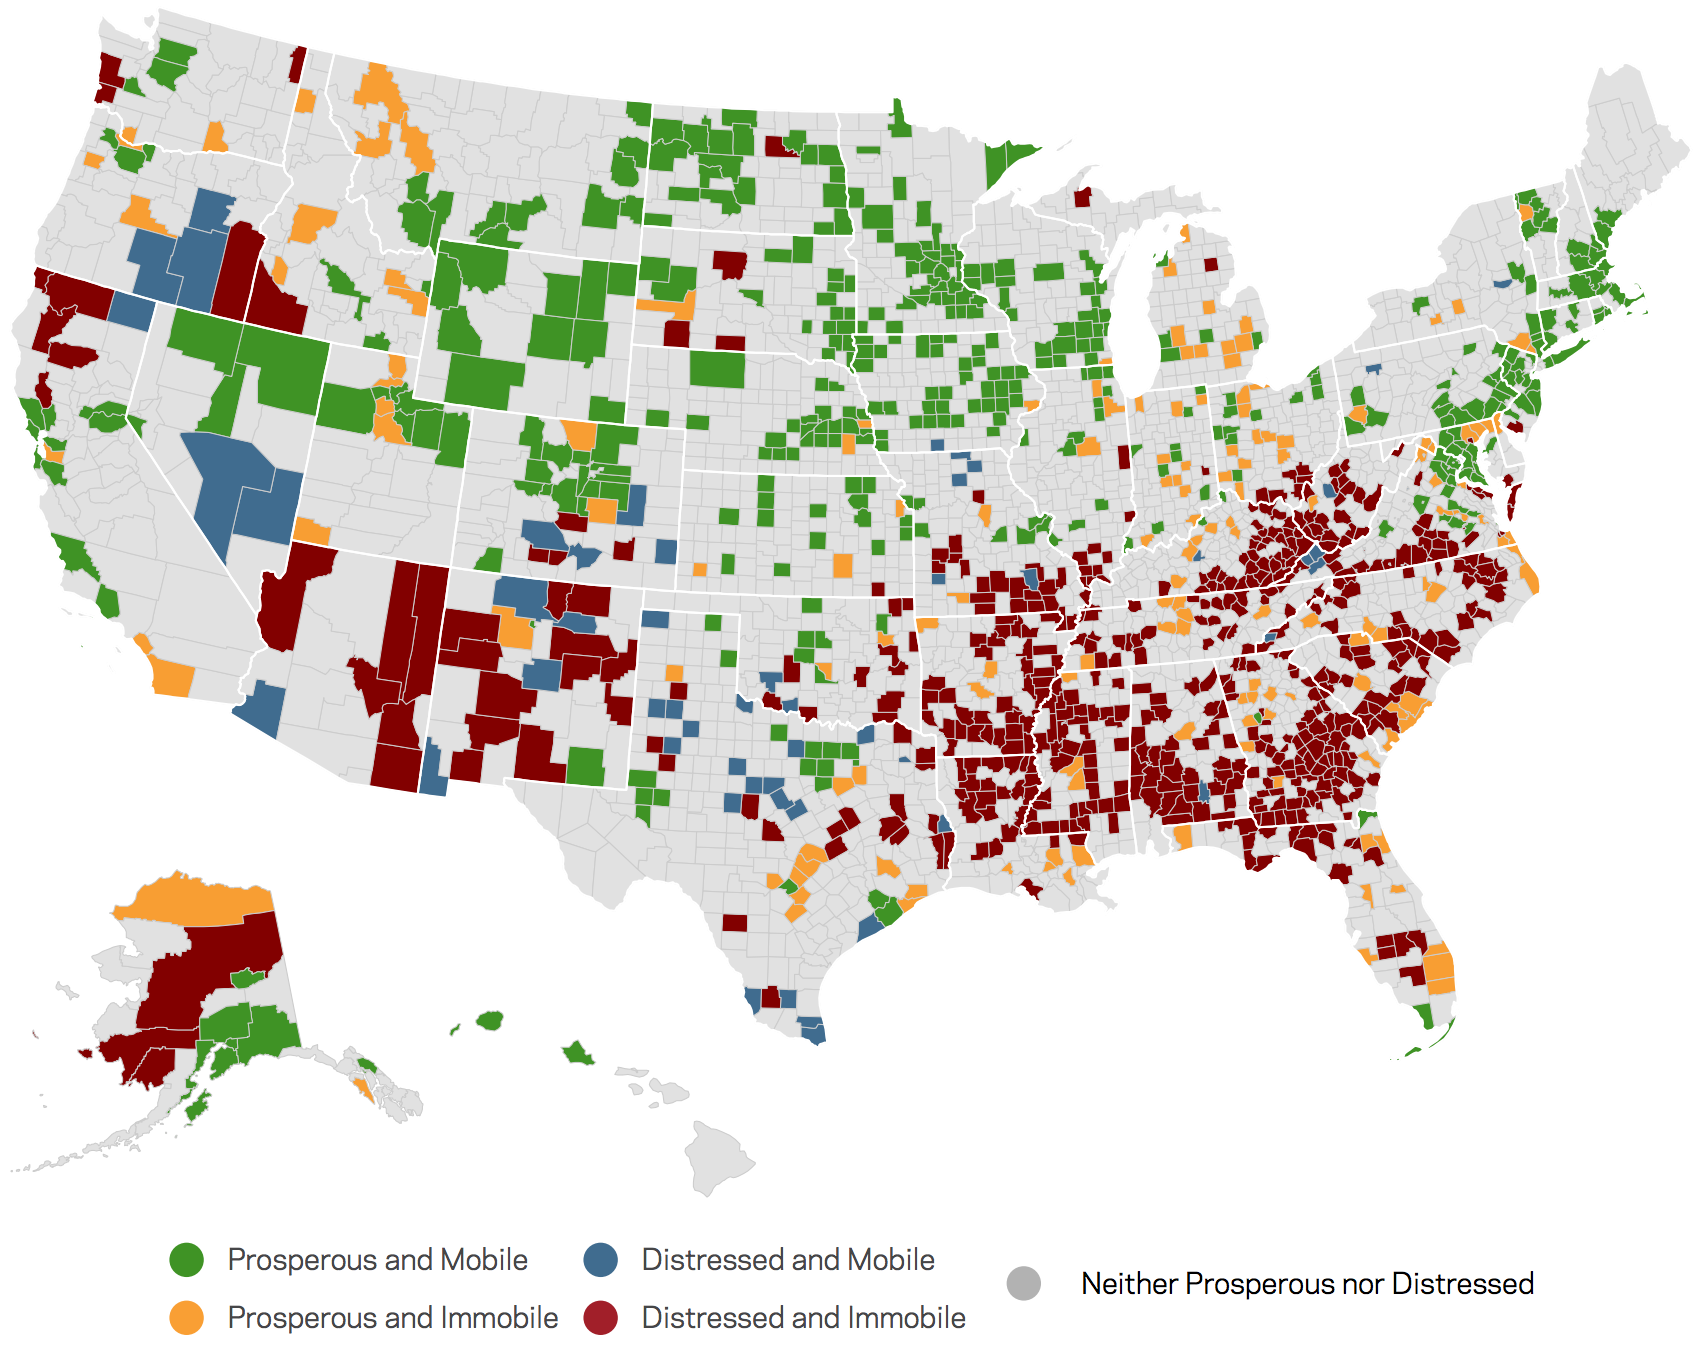
Source: EIG analysis of Distressed Communities Index and Equality of Opportunity Project data
Alive and well
There are 420 counties where the American Dream is alive and well: places that are both prosperous and conducive to upwards economic mobility. Seventy-two percent of the country’s most prosperous counties fall into this category, supporting the correlation between prosperity and mobility. These counties cluster along the Eastern Seaboard, in the upper Midwest, and across the Mountain region, and pockets surround the major metro areas of the West Coast, Texas, and parts of the industrial Midwest, too. Notably absent from the map is the Southeast, not because it lacks in prosperity but rather because southern counties largely fail to foster mobility.
Many Americans have voted with their feet and gravitated towards these idealized locales. The category includes many urban and suburban population centers, and in total 71 million people reside in these places where the American Dream seems to be alive and well. President Trump carried three-quarters of these counties in the 2016 election, but counties that Clinton carried encompassed 57 percent of the population in the group. More than any other category, this opportunity-rich swathe of America bridged the partisan divide in 2016.
Map 1. Counties that are both prosperous and advantageous for poor kids
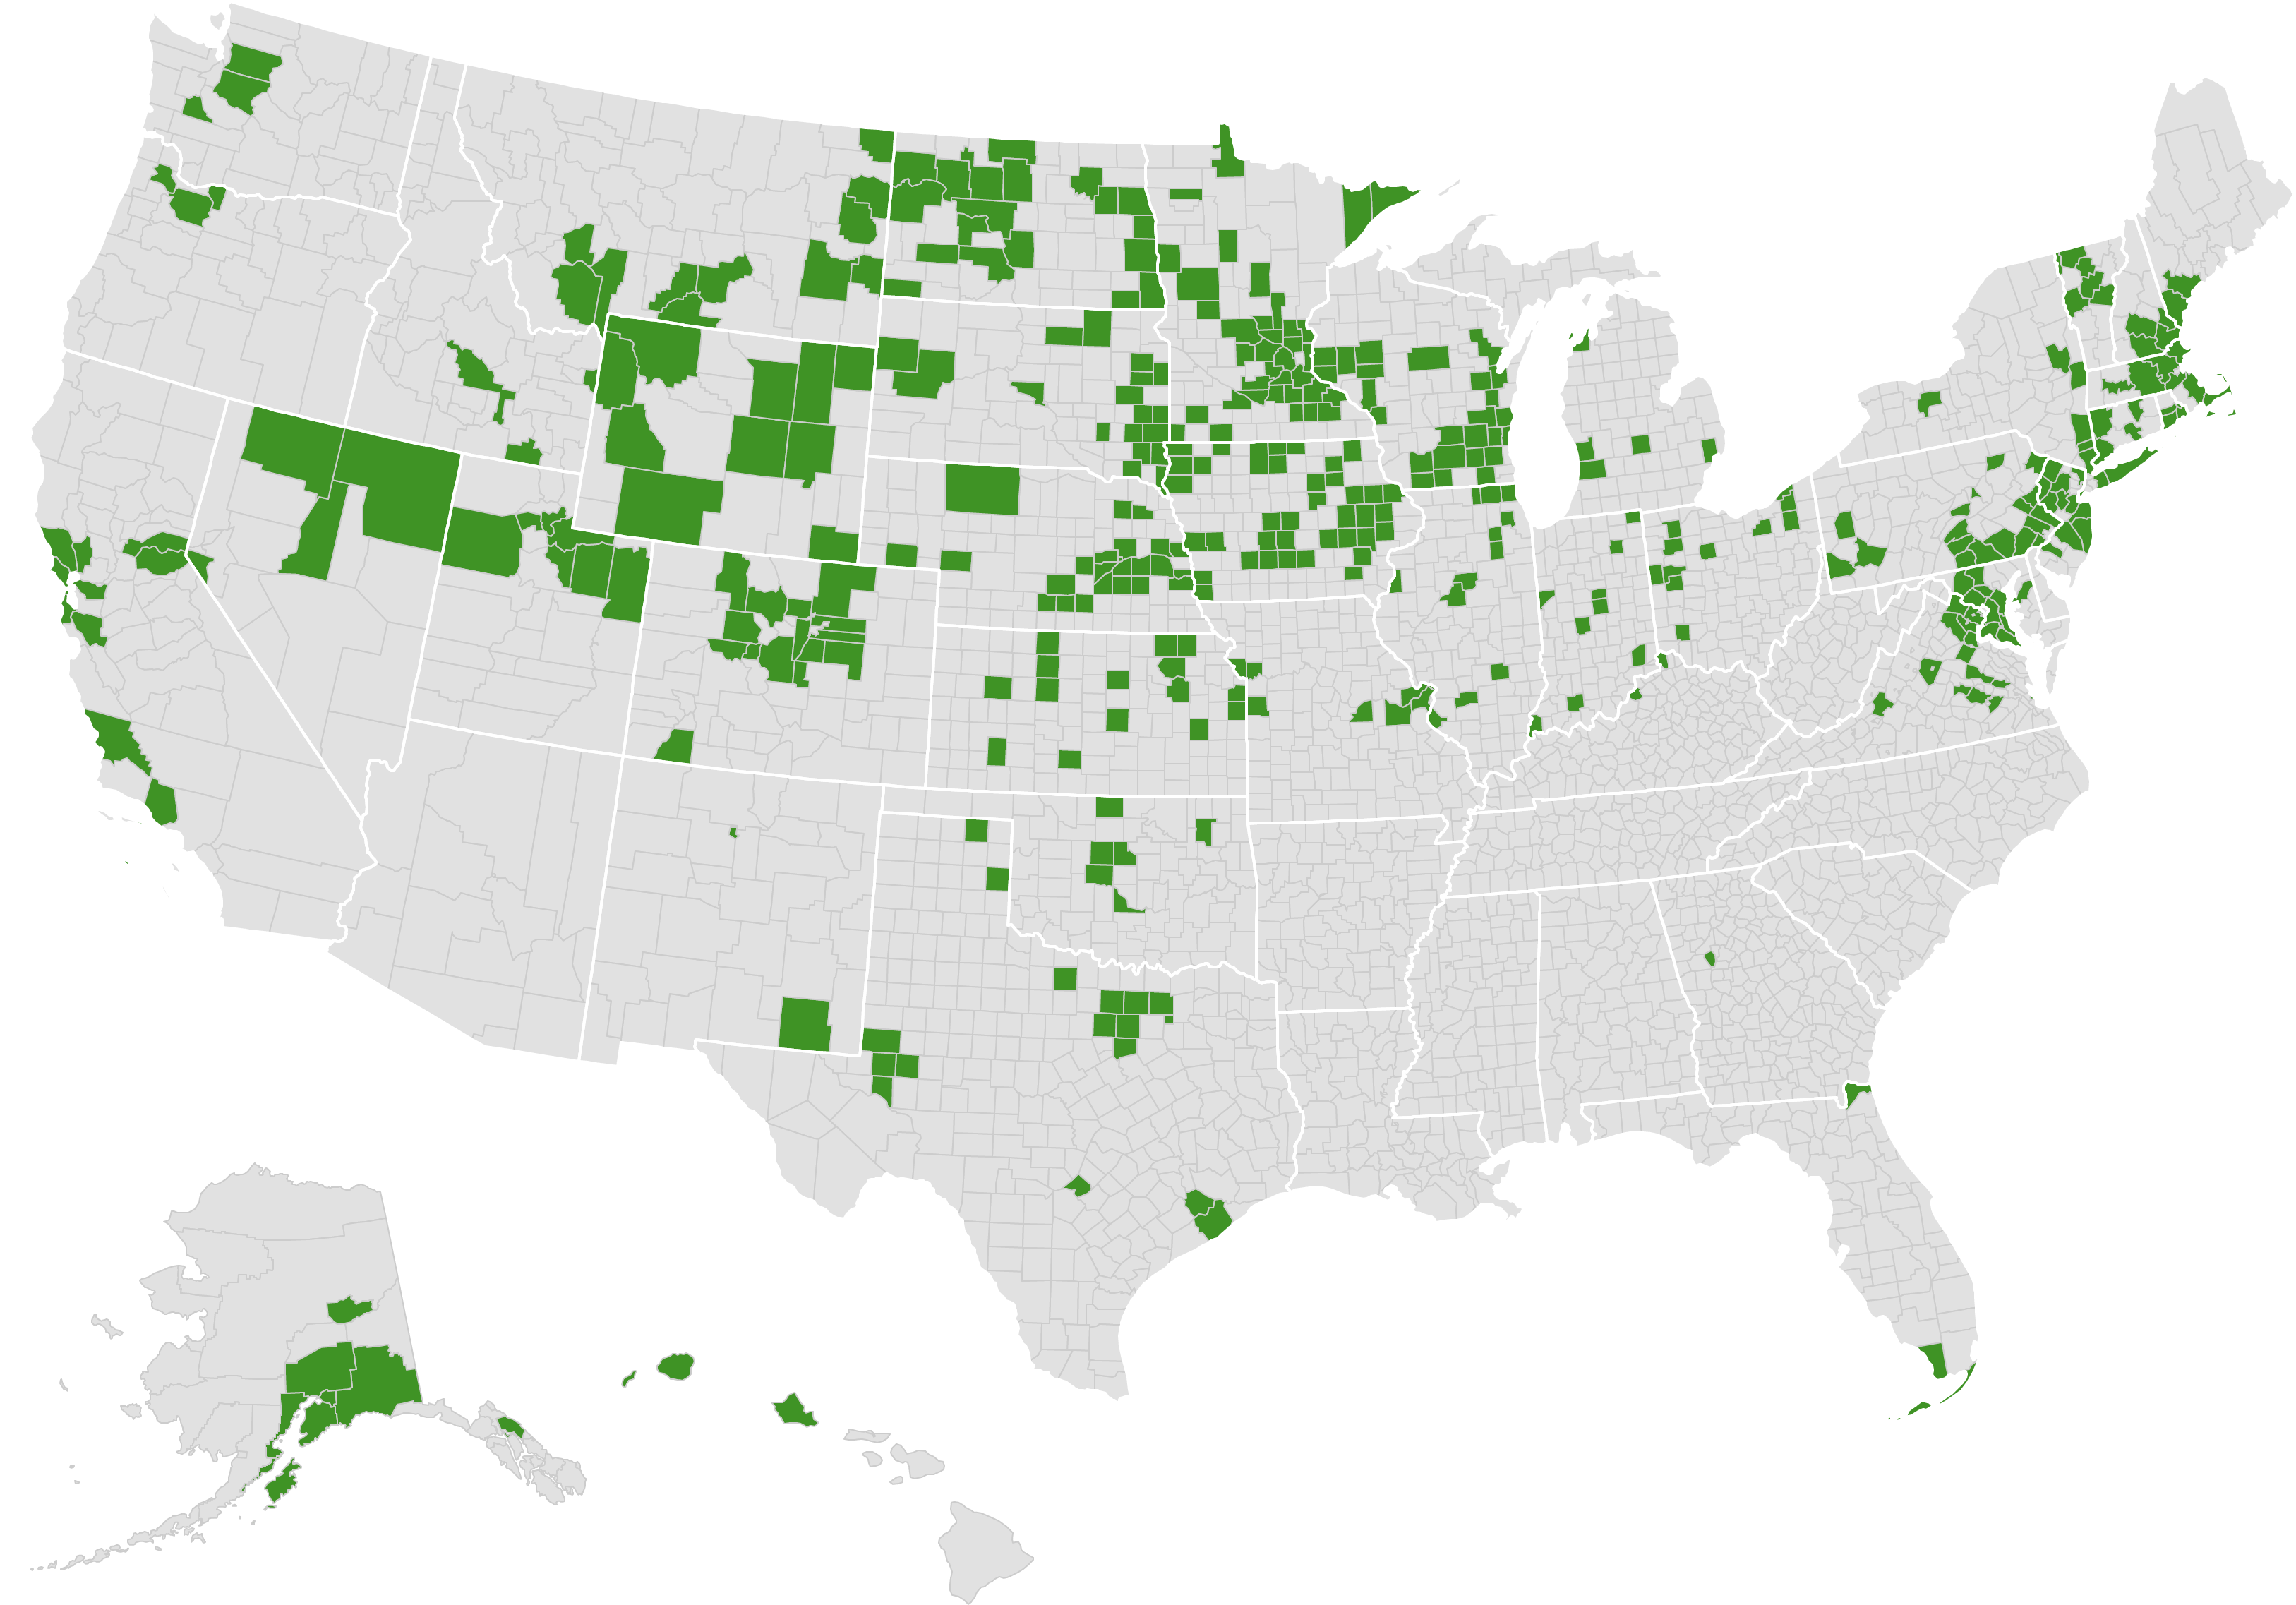
Source: EIG analysis of Distressed Communities Index and Equality of Opportunity Project data
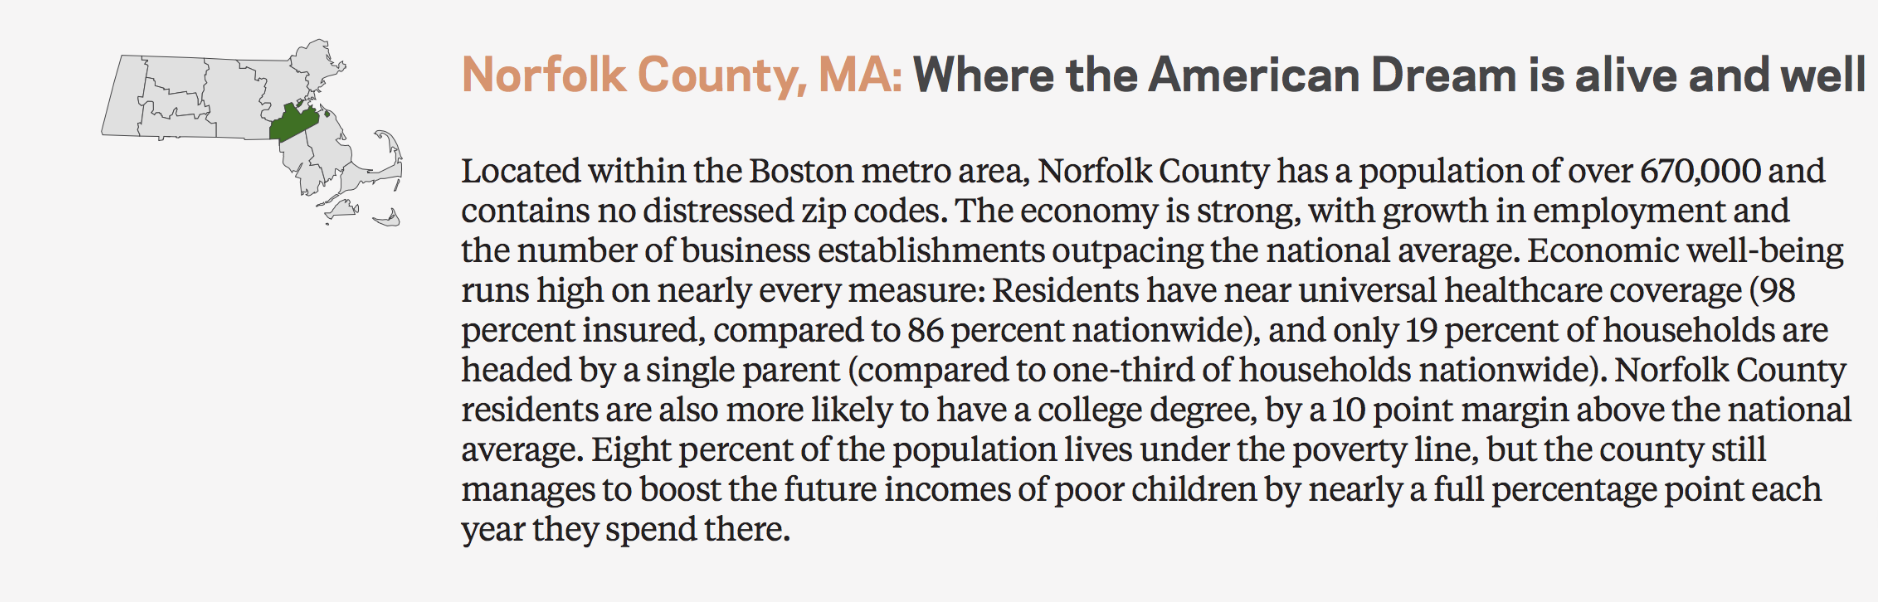
Of course, counties are only imperfect proxies for communities and the neighborhoods where kids grow up. “Spatial inequality” scores included in the DCI provide an even more fine-grained look at within-county dynamics. Spatial inequality is a measure of economic segregation that quantifies the gap in economic well-being across zip codes for counties with at least 100,000 people and composed of at least 5 zip codes. Just over 150 counties where the American Dream appears to be alive and well are large enough to have spatial inequality scores. Nearly three-quarters of those (73 percent) have below-average spatial inequality scores, meaning well-being is broadly shared across zip codes. These places represent the truest manifestations of the American Dream. Thirty-two states have at least one such county, but Wisconsin leads the pack with 10, followed by New Jersey and Virginia with nine each and California with eight.
These prosperous, equal, and mobile counties also tend to exhibit extraordinary economic dynamism: Between 2010 and 2014, 96 percent of these counties experienced job growth, 80 percent saw a net gain in new businesses, and 88 percent increased in population. Where the economy thrives, people thrive, and vice versa. The coincidence of growth, mobility, and prosperity in these locales proves that the American Dream is more than a mirage. Of these prosperous, mobile, and equal places, Norfolk County, MA, exhibits the largest positive childhood exposure effect for kids from low-income backgrounds.
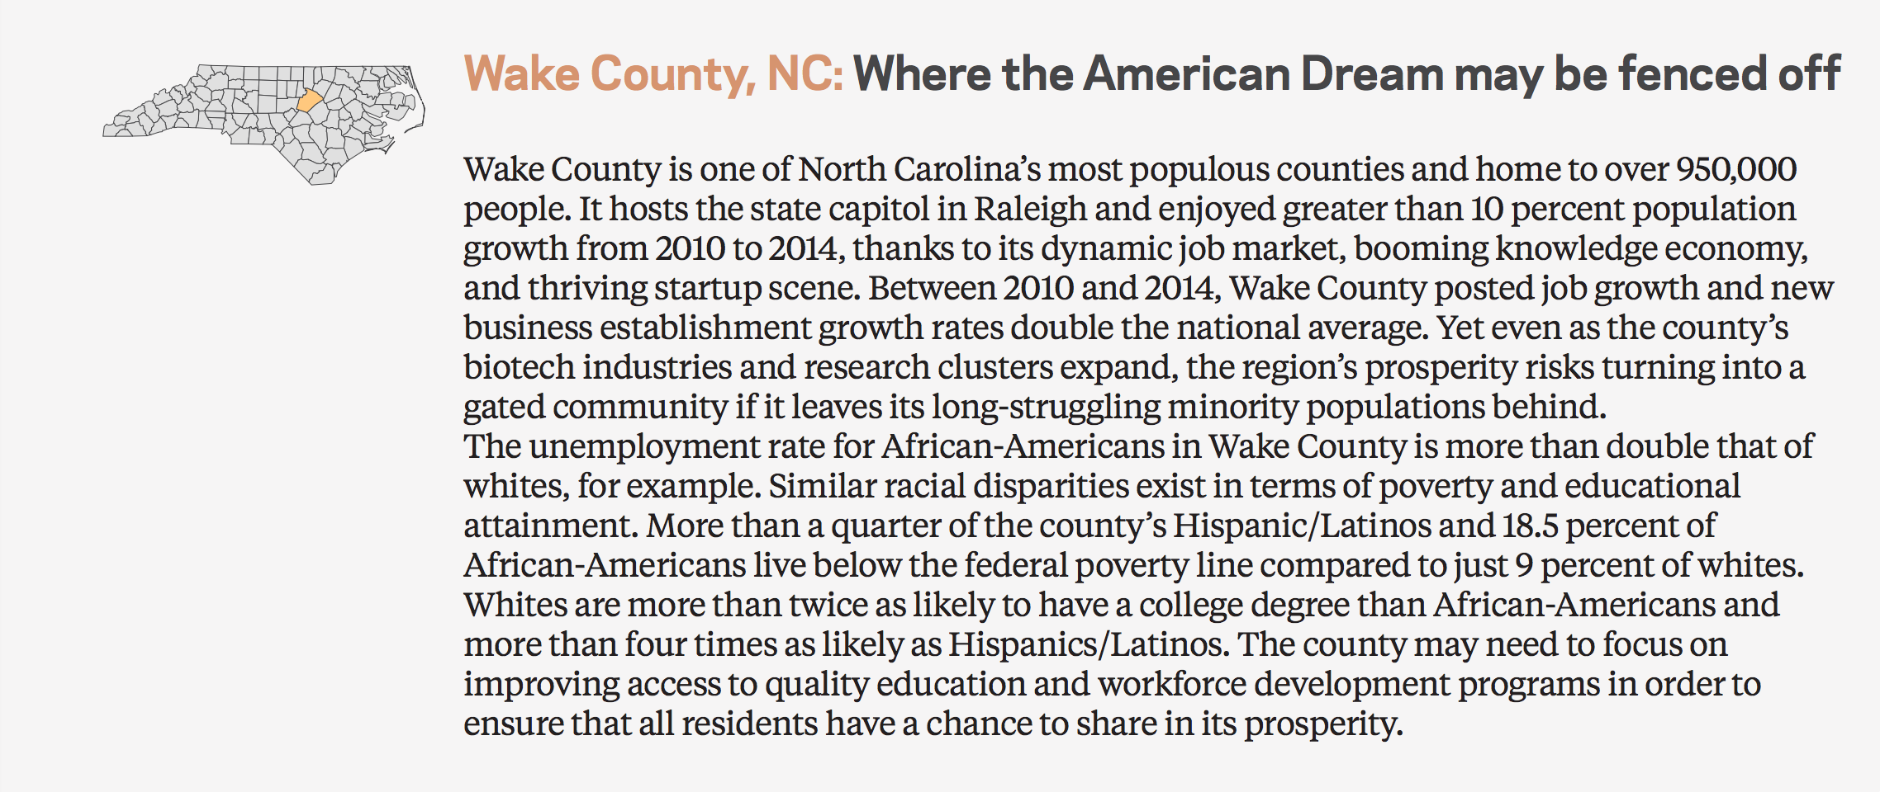
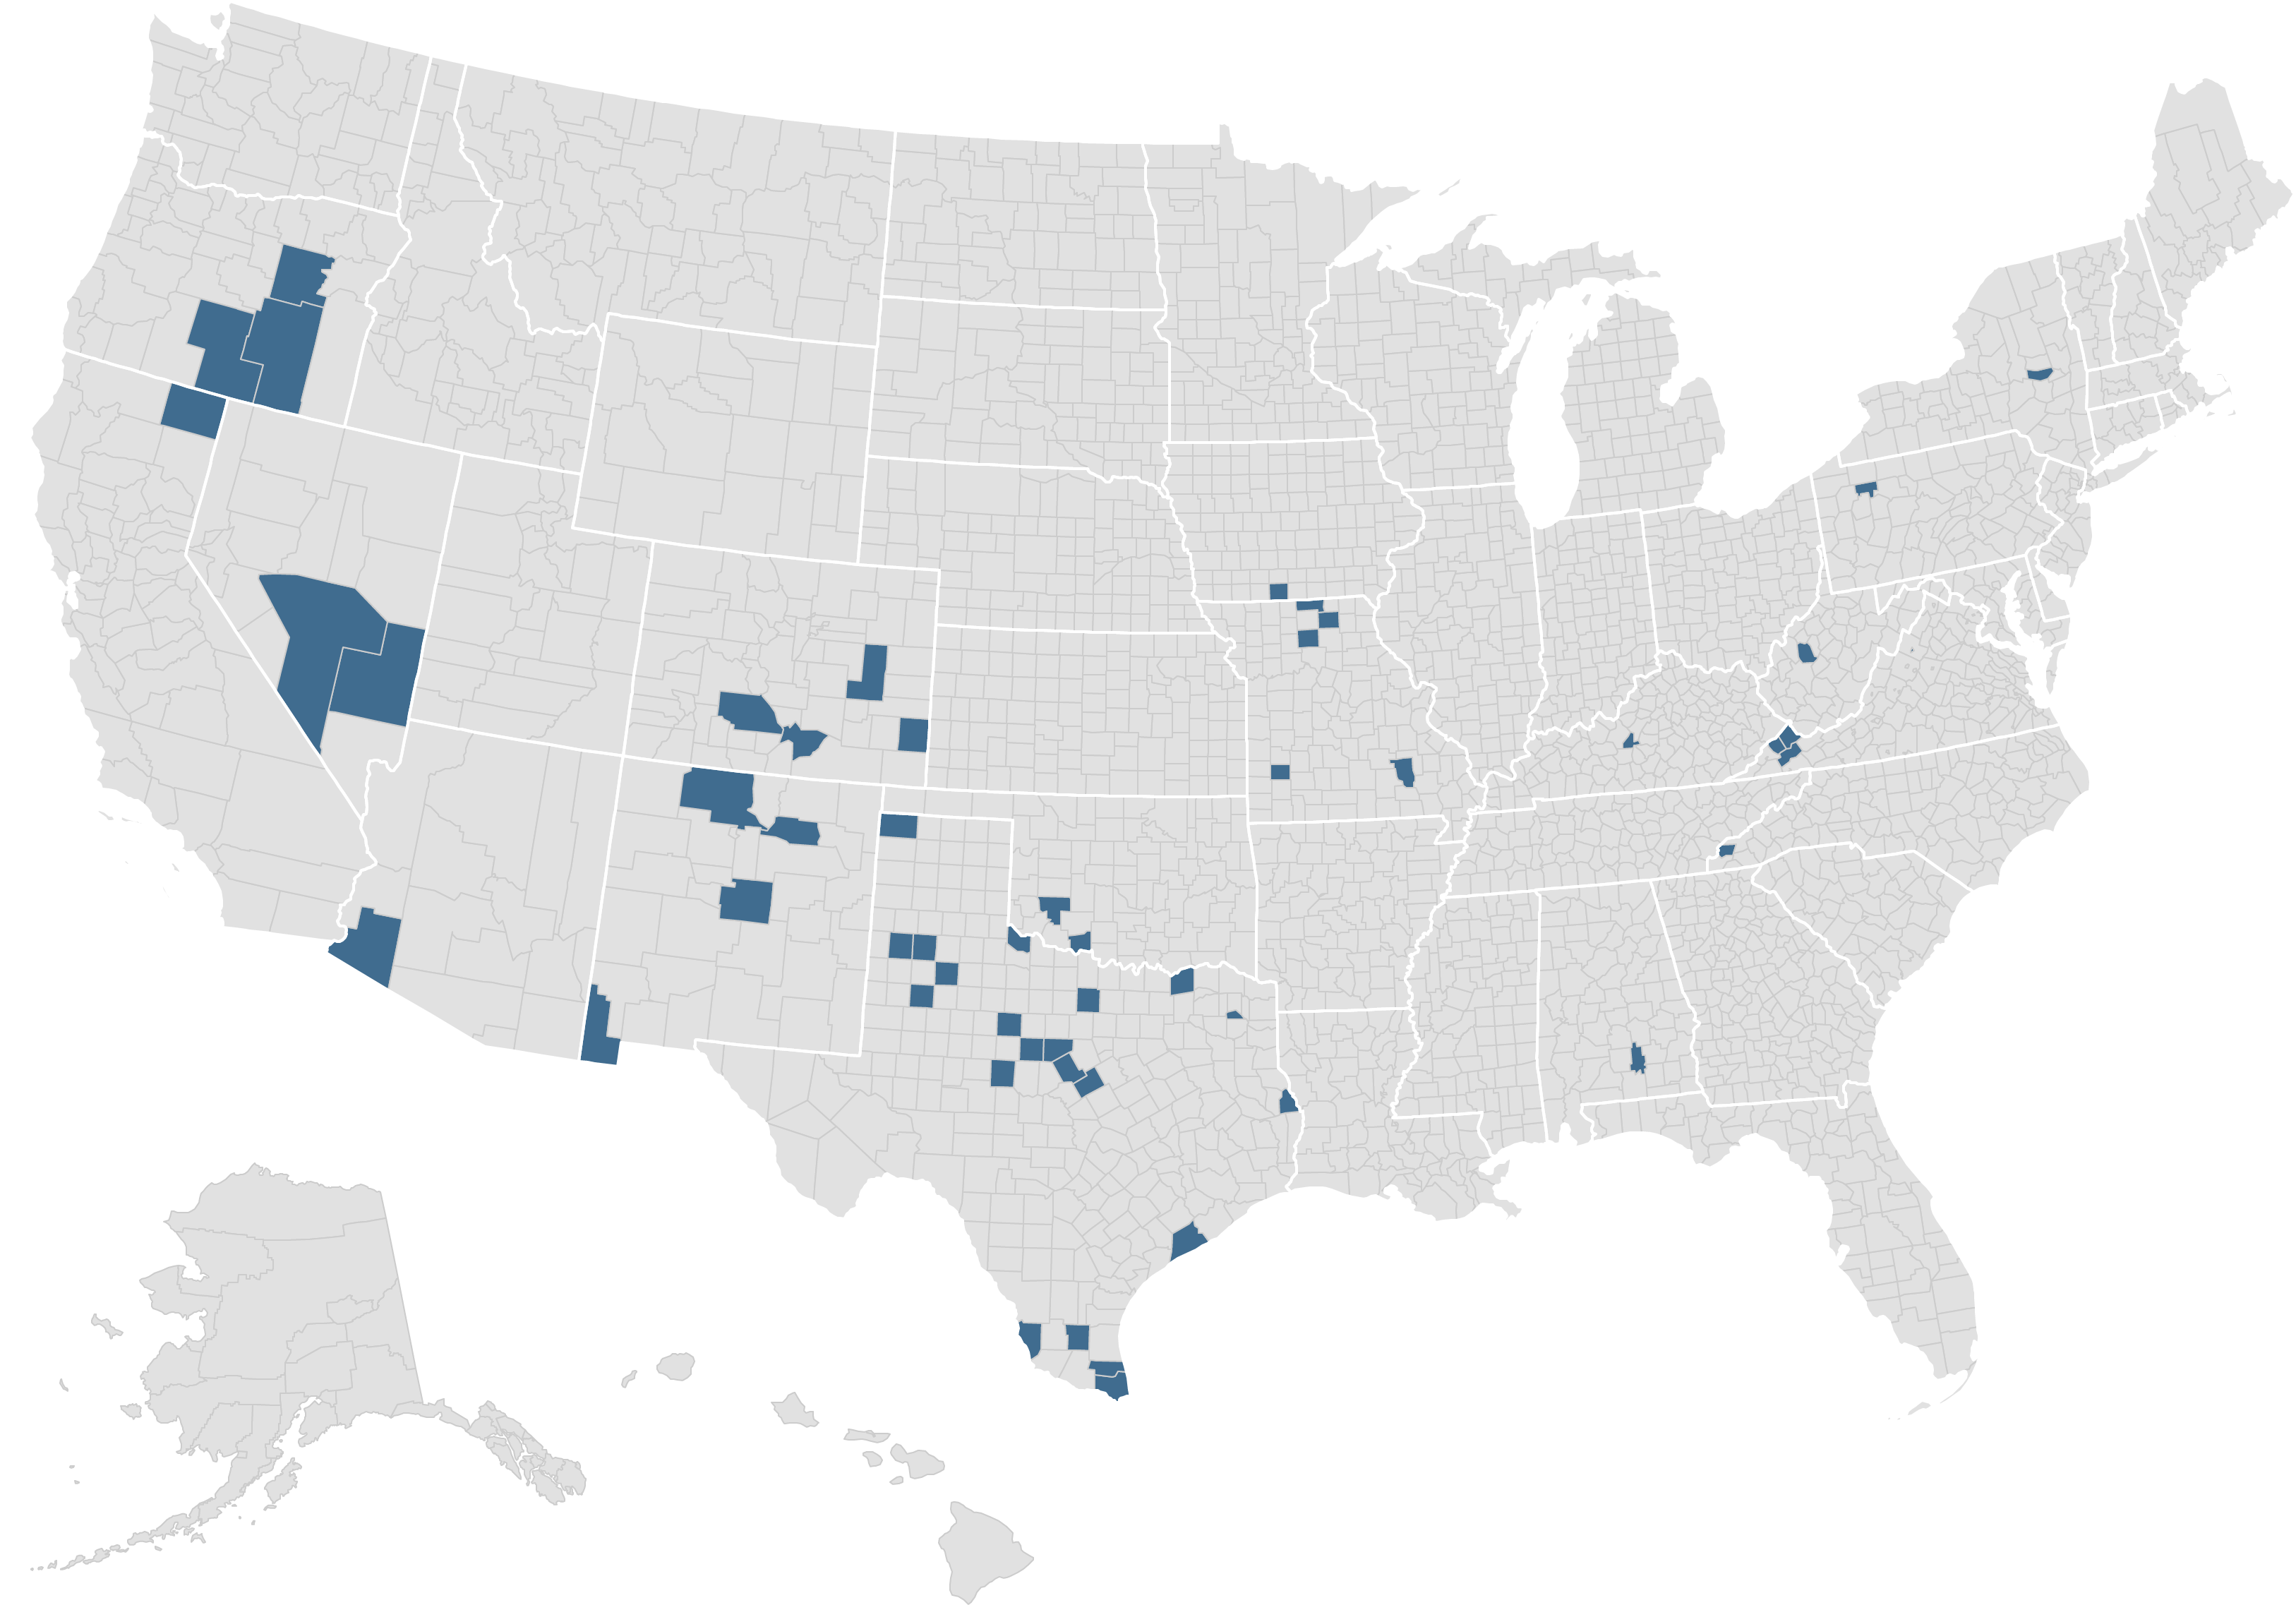
Fenced off
The remaining 28 percent of the country’s prosperous counties exert a negative influence over the future earnings of poor children. Prosperity is sequestered and unevenly shared in these communities, which are home to 47.5 million Americans. They struggle to translate high levels of overall well-being into economic opportunity for their most disadvantaged residents. These counties are strewn all across the country, but they are overrepresented around the major metropolitan hubs of the Midwest and South and scattered across the West. Southern counties in particular seem to struggle to translate prosperity into mobility, at least historically: the American Dream remains fenced off for low-income children in the vast majority of the region’s prosperous counties. In the 2016 election, Clinton won 22 percent of these counties representing 60 percent of the population in the group.
Fully half of the prosperous but immobile counties for which spatial inequality information is available register above-average levels of economic segregation. In many cases, immobility therefore appears to plague places where prosperity at the county level masks wide gaps in economic well-being at the community level. This finding is consistent with the academic literature on the pernicious social and economic effects of segregation in all its forms. Spatial inequality falls short as an explanation for limited economic mobility in the other half of these counties, however, signaling that other barriers limit access to opportunity too.
Map 2. Counties that are prosperous but disadvantageous for poor kids
Source: EIG analysis of Distressed Communities Index and Equality of Opportunity Project data
Inequality and immobility appear to provide little drag on economic growth in these counties. Of the 55 counties classified as prosperous, immobile and spatially unequal, 96 percent saw a gain in jobs, 87 percent saw net business growth, and 100 percent saw population growth. Of these places, fast-growing Wake County, NC, exerted the strongest negative impact on the future earnings of low-income children, highlighting the struggle that many places face in connecting historically disadvantaged populations with broader economic growth and development.
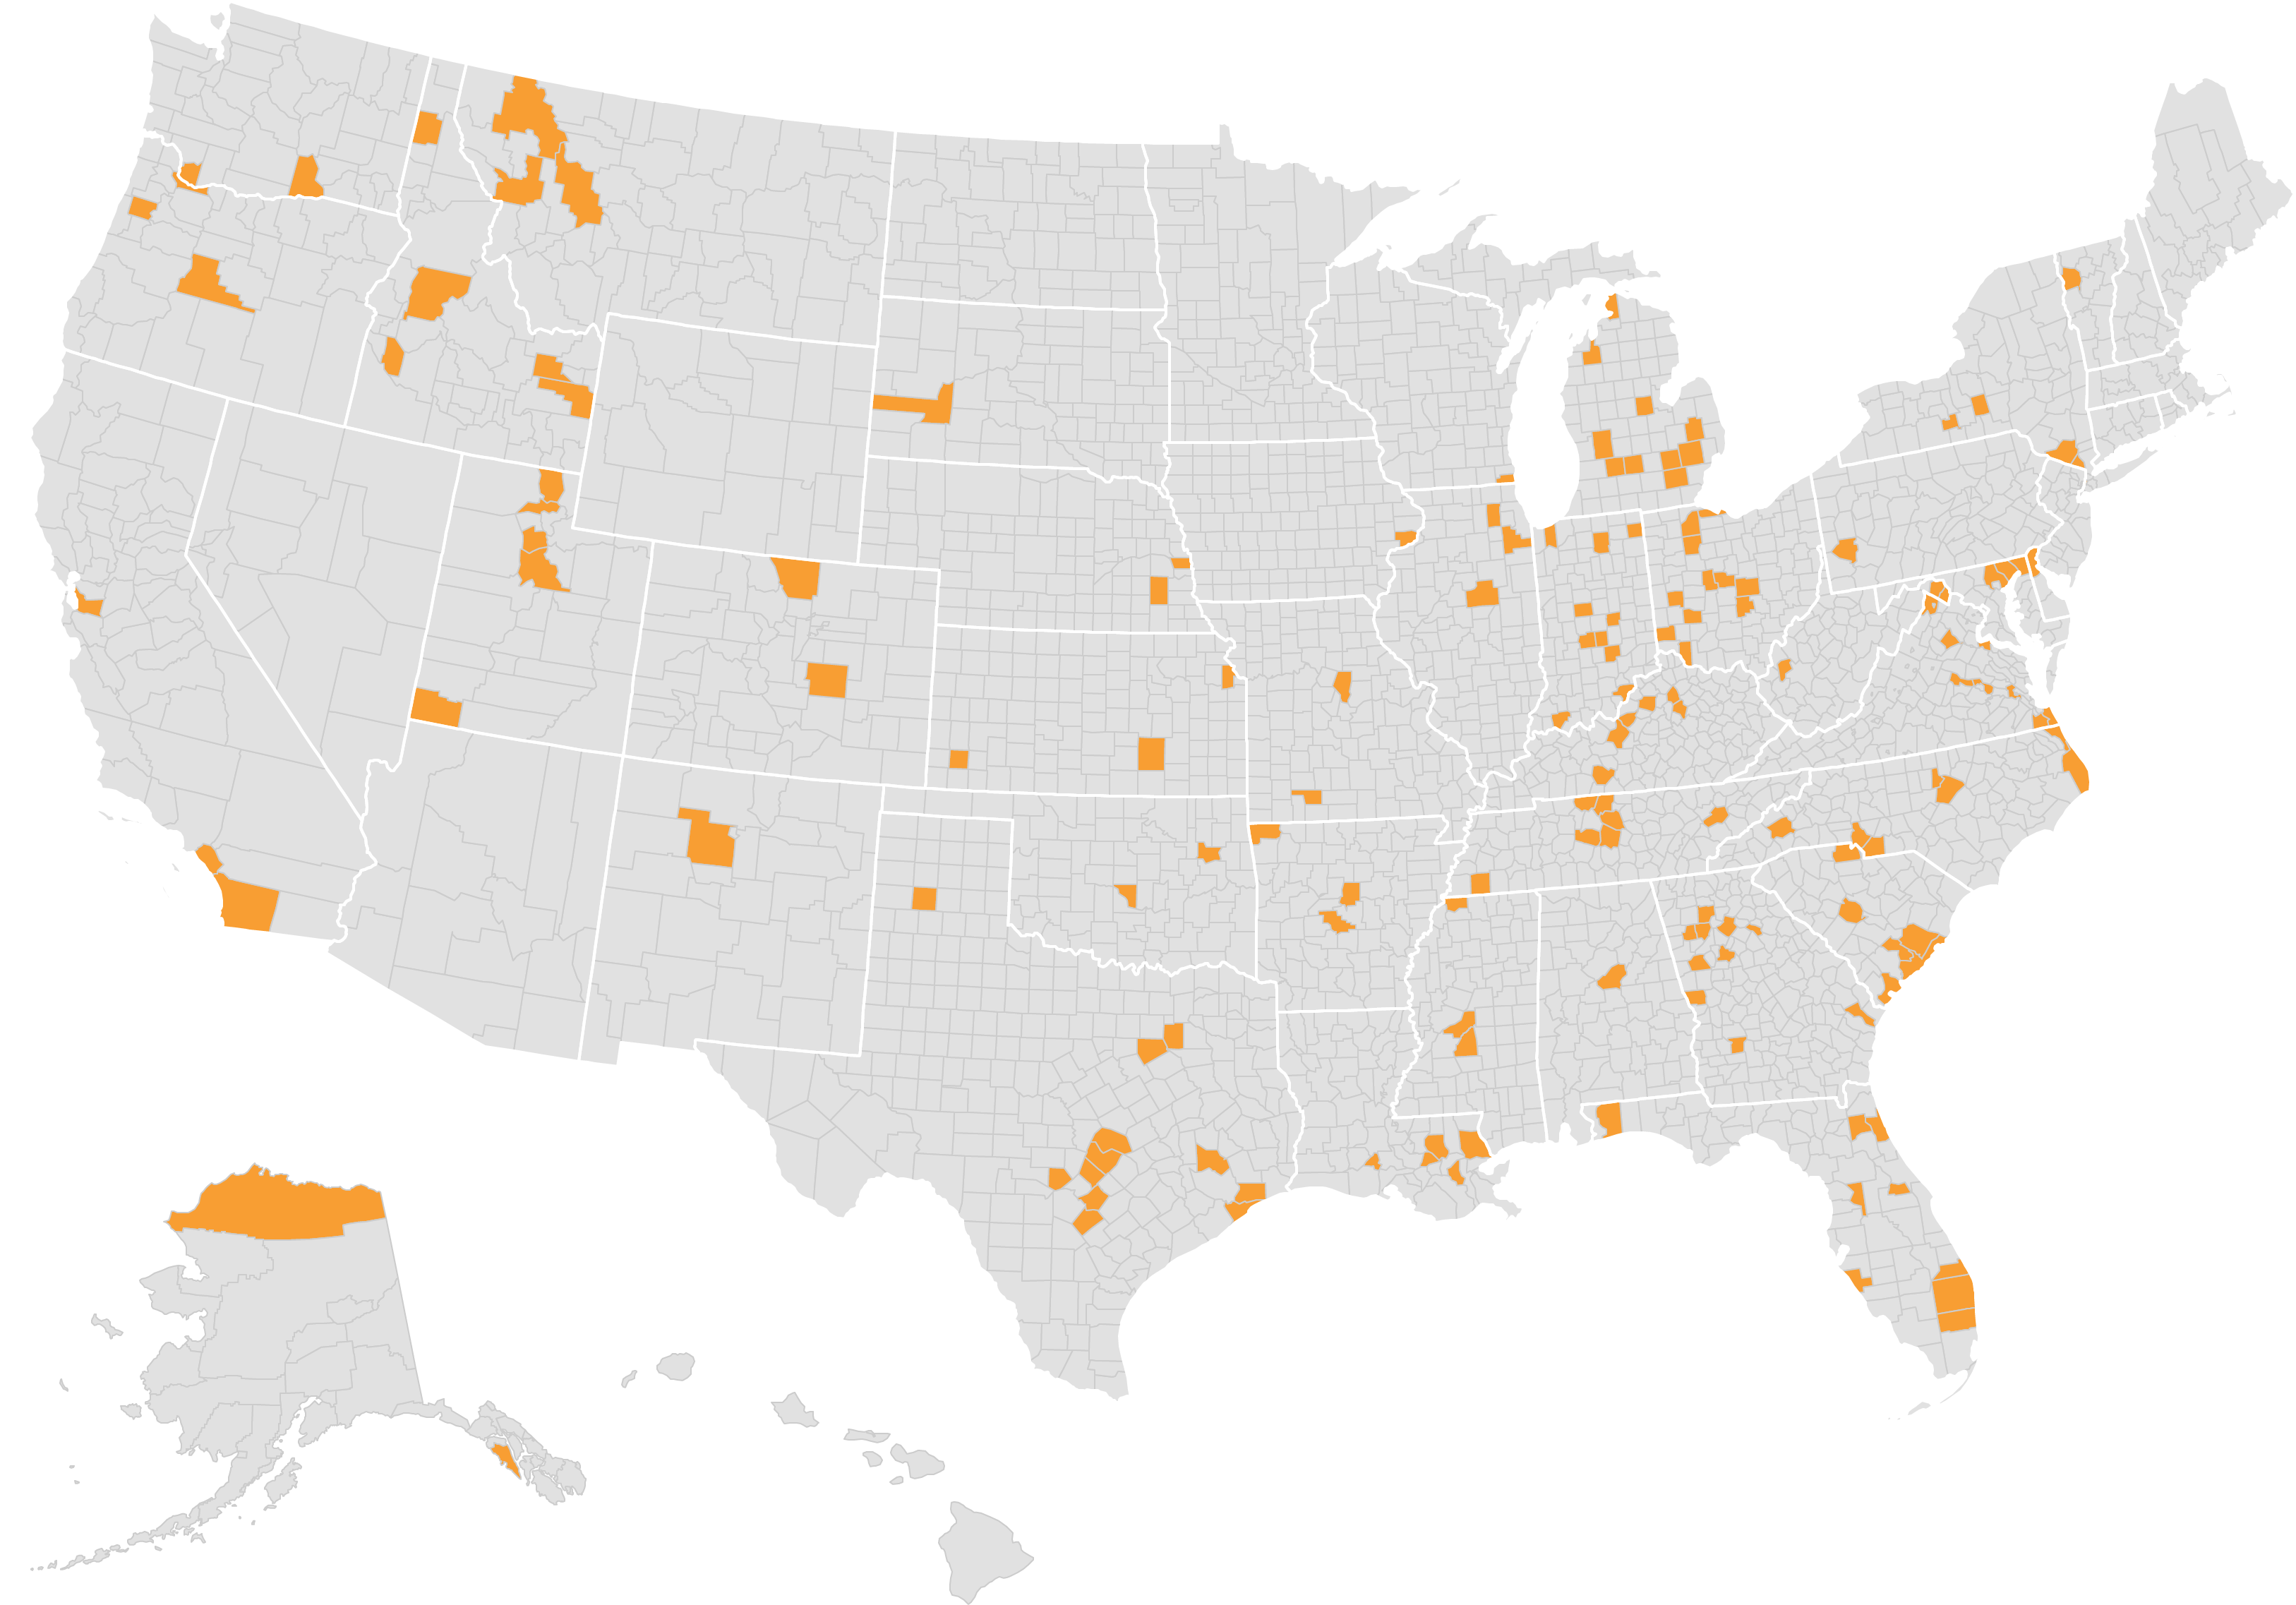
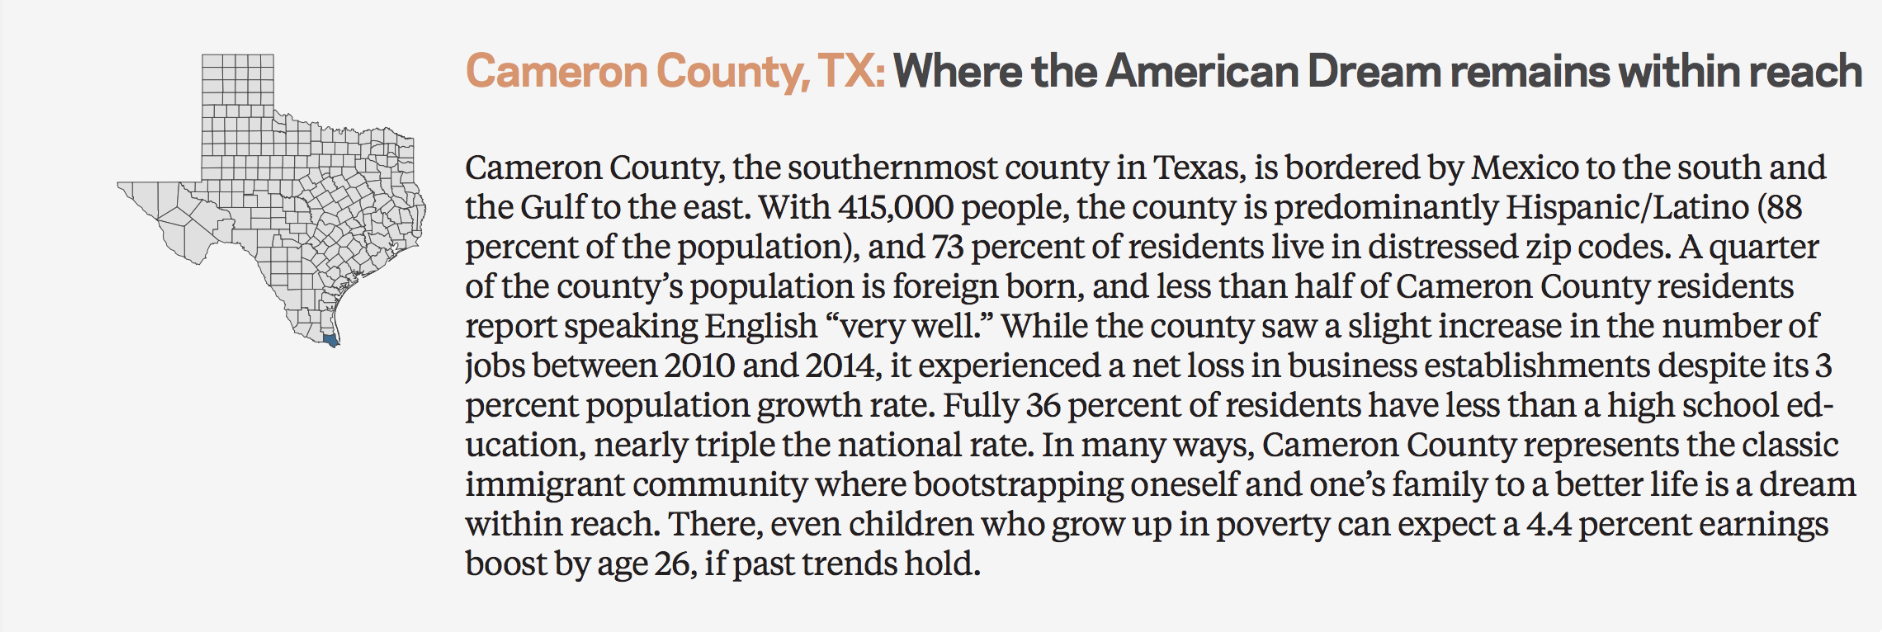
Within reach against the odds
At the other end of the spectrum of American communities lie distressed places that are hopeful outliers, counties that manage to provide low-income children the chance at a better future despite the economic challenges that surround them. These are places where, against all odds, the American Dream remains within reach, and they are overwhelmingly rural and located in the Southwest. President Trump won 84 percent of these counties covering 60 percent of the population in the group.
Without question, economically distressed yet mobility-enhancing counties are a rare species. Fewer than 10 percent of the country’s distressed counties manage to provide disadvantaged children with a ladder to higher incomes in adulthood. They do so in spite of significant headwinds: Between 2010 and 2014, 65 percent of these counties lost jobs, 87 percent saw a net loss in businesses, and 78 percent saw a decline in population. If such trends continue, the American Dream may already be fading from the last hold-outs among the country’s many distressed corners. Only 1.4 million people live in these few counties that are still able to reconcile distress with mobility.
Map 3. Counties that are distressed but still advantageous for poor kids
Source: EIG analysis of Distressed Communities Index and Equality of Opportunity Project data
Only two of these generally small counties are large enough to have spatial inequality scores. Spatial inequality runs above average in Yuma County, AZ, and below average in Cameron County, TX, a mid-sized border county at the mouth of the Rio Grande.
A distant prospect
Counties that manage to foster mobility against the countervailing winds of economic distress remain a rare exception. In most distressed corners of the country, the economic environment weighs heavily on the prospects of poor children. Nine out of 10 distressed counties exert a negative exposure effect on children from disadvantaged backgrounds, meaning low-income children who grow up in them will likely earn less in adulthood than their peers from elsewhere. Instead of offering poor children a ladder to a better life, these counties perpetuate poverty and inequality across generations. President Trump carried 79 percent of these counties representing 72 percent of the population in the group—dominating this category of places more than any other.
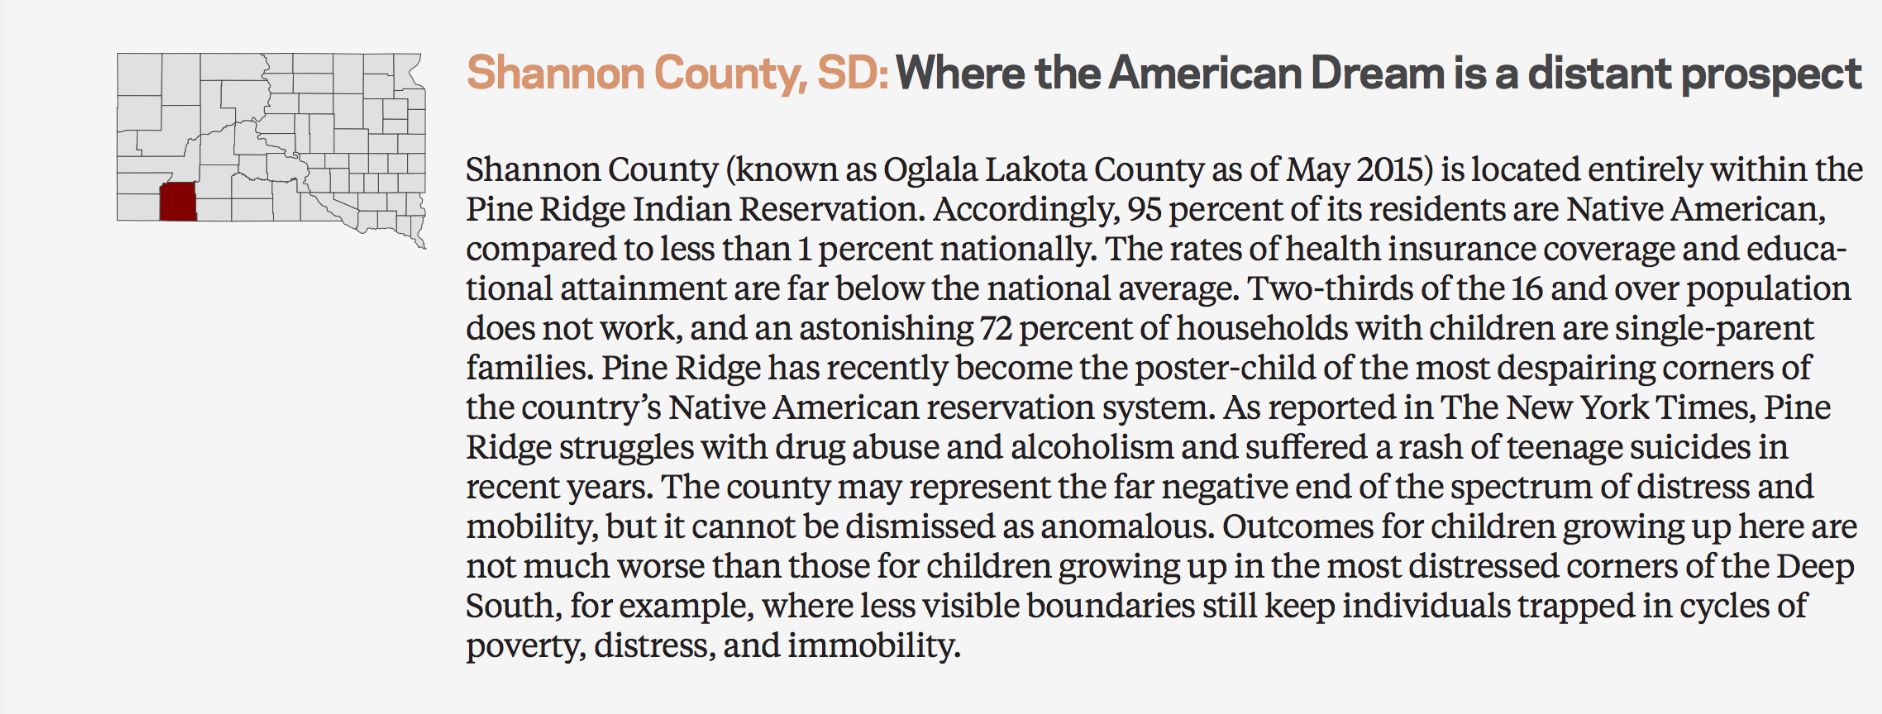
The vast majority (85 percent) of counties where the American Dream remains a distant prospect are rural counties in Appalachia and the South. Most of the rest can be found in the remote desert Southwest, all too often covering Native American territories. Only 11 of these counties have more than 100,000 people (the cities of Baltimore, MD, and Norfolk, VA, are the lone urban counties), but altogether 14.5 million Americans live in these corners effectively vacated by the American Dream. The most despairing case may be that of Shannon County, SD, which provides a shocking—but not rare—bookend to this tour of the American experience.
Map 4. Counties that are both distressed and disadvantageous for poor kids
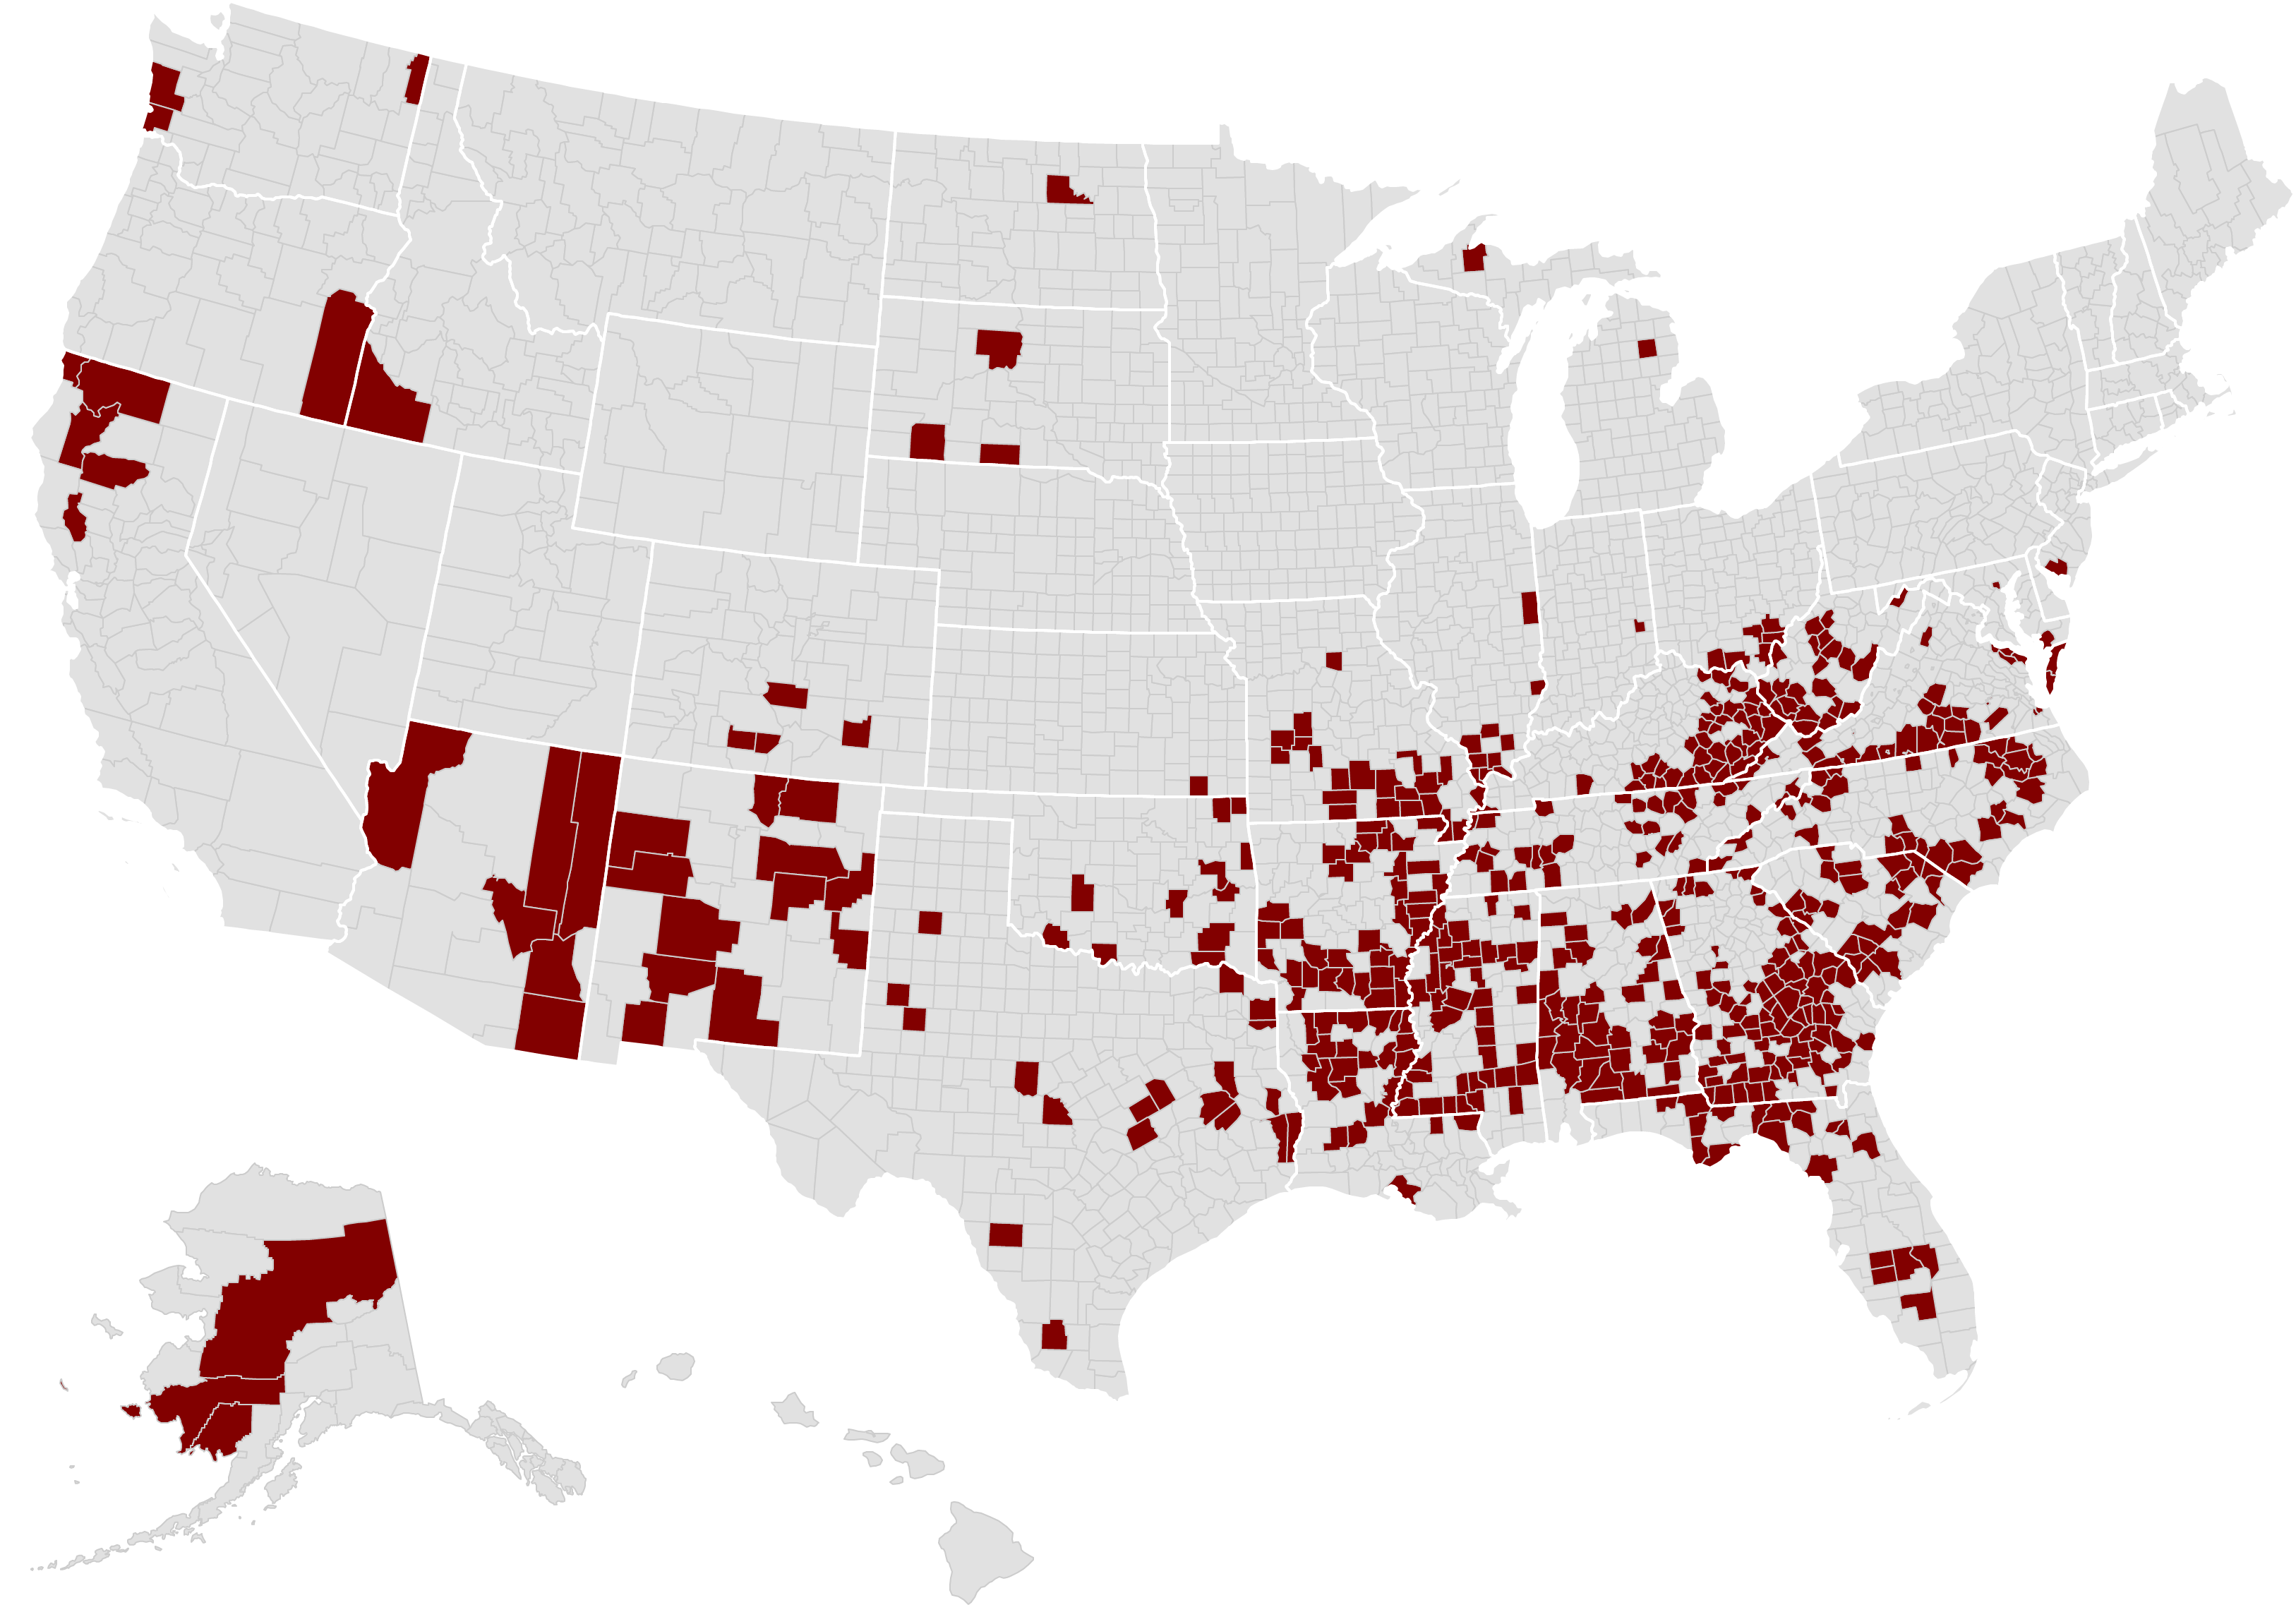
Source: EIG analysis of Distressed Communities Index and Equality of Opportunity Project data
Current patterns of economic growth hold out little promise for these communities, as the nation’s recovery from the Great Recession largely left them behind. Of the 522 counties in this distressed and immobile category, fewer than half experienced positive growth in terms of jobs or population between 2010 and 2014. Over 90 percent saw more business establishments close than open during a nominal nationwide recovery.
Closing discussion
This analysis stitched together snapshots of current economic well-being (from the DCI) with historical data on economic mobility (from the EOP) and found that the vital signs of the American Dream vary significantly depending on where one looks. Most children in the United States are growing up today in counties with a poor record of fostering upward mobility. As the geography of U.S. economic growth narrows, it may become even harder to prevent further retreat of economic mobility.
Even growing up amid robust economic growth cannot secure upward mobility for many disadvantaged children. Economic segregation, failing schools, and other factors can interrupt the translation of regional prosperity into mobility for all. EOP researchers identified five characteristics of places that bolster mobility: low levels of segregation, both in terms of income and race; low income inequality; good schools; low rates of violent crime; and high shares of children living in two-parent households. These values can serve as common grounds for policymakers to come together in the years ahead.
If the American Dream is to become more accessible, the country needs a more geographically inclusive pattern of growth, and it needs to tackle the determinants of mobility at their roots, neighborhood by neighborhood, at the same time. There is growing urgency for advancing novel policy solutions that harness the power of entrepreneurs and the private sector in order to break the cycles of disadvantage that perpetuate inequality at the neighborhood level.
The American Dream does indeed exist; our task is to expand its reach.