A small but meaningful number of census tracts currently designated as Opportunity Zones do not meet the spirit and intent of the law, and the first legislative proposal to remedy the situation was introduced on November 6th by Senator Ron Wyden (D-OR).
All together, the Wyden proposals would sunset a total of 269 Opportunity Zones census tracts home to nearly 1.2 million people and spread across 44 states and DC. Only Alaska, Georgia, Illinois, New Hampshire, North Dakota, and Utah would remain unaffected. The proposals target two sets of Opportunity Zones census tracts: those that have an especially high median family income (MFI) and those that do not meet the U.S. Treasury Department’s definition of a low-income community but still qualified as Opportunity Zones due to their contiguity with a low-income zone.
Opportunity Zone census tracts up for disqualification under the Wyden bill
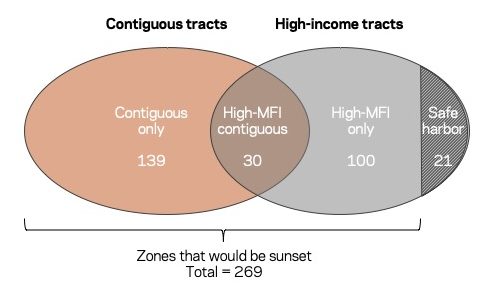
Source: EIG analysis of American Community Survey 2013-2017 Estimates
Critically, as the bill is currently drafted, governors would only be permitted to redesignate the 100 census tracts that face disqualification due to their high MFIs and are not eligible for any safe harbors. The proposal would not allow governors to re-designate any contiguous census tracts, even though contiguous tracts counted toward the total governors were permitted to designate under the law. As a consequence, any state that utilized the contiguity provision would be penalized under the Wyden proposal and would see their total number of zones reduced. We do not know whether this is by design or comes down to a drafting error. Strangely, the proposal would kick off a new 10-year life-cycle for re-designated zones as well, which would introduce new uncertainties and complications into the marketplace by placing them out of sync with the rest of the map.
High median family income tracts
The legislation proposes automatically sunsetting any Opportunity Zone census tract that has an MFI greater than or equal to 120 percent of the national median family income, or $85,020 according to the latest available data (the 2013-2017 American Community Survey at the time of introduction). For context, MFI in the average Opportunity Zone is $44,700, well below the $48,300 average across all low-income census tracts nationally. And roughly 70 percent of all Opportunity Zone census tracts meet Treasury’s definition of “severely distressed”—a far higher standard of need than the law required for Opportunity Zone designation. As the figure below underscores, the vast majority of Opportunity Zone designations were well-targeted towards need, hence Congress’ interest in identifying and eliminating the finite number of outliers.
The MFI measure provides an ideal second screen of LICs because it complements measures of poverty. A census tract with a sizeable assisted living, student dormitory, or public housing complex, for example, may register a high poverty rate even if that complex is embedded in an otherwise well-off community. The median measure provides a gauge of how well off the typical family is in a community, not just how many people fall below the federal poverty line.
Before any safe harbors set in, the proposed MFI rule would sunset 151 Opportunity Zones, including 30 zones designated under the contiguity provision that allowed governors to select a small number of moderate-income census tracts adjacent to qualified and nominated low-income ones. Together the high-MFI zones have an average MFI of $104,510—making them extreme outliers in the national pool of designated communities. Some of the tracts facing rescission include those flagged in media reports from Loudoun County, VA; Chapel Hill, NC; and Long Island City in Queens, NY.
Distribution of Opportunity Zone census tracts by median family income, 2017
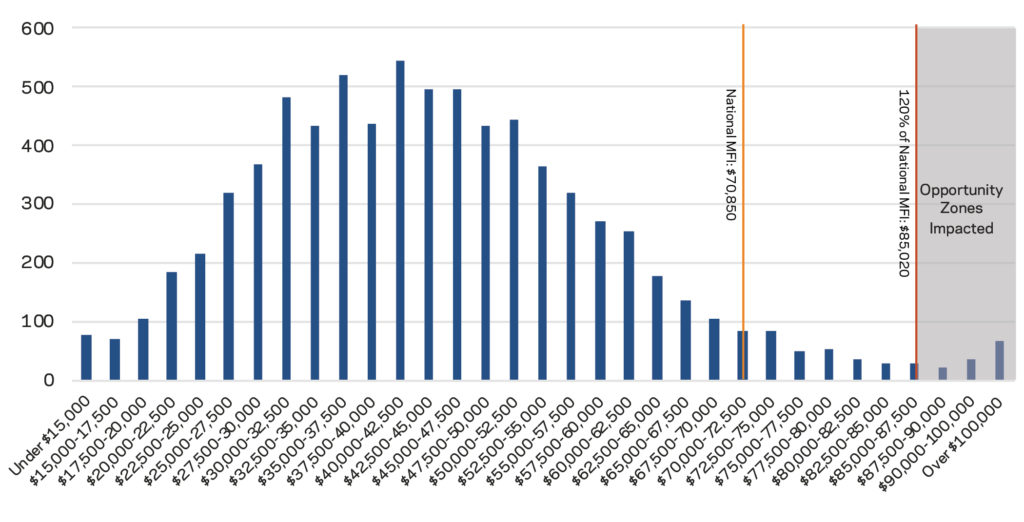
Source: EIG analysis of American Community Survey 2013-2017 Estimates
The Wyden legislation proceeds to offer a safe harbor for some of these zones to retain Opportunity Zones status: those with 1) poverty rates of 20 percent or higher AND 2) under 10 percent of the population enrolled in a college or university. In total, 21 high-MFI non-contiguous tracts would be restored under this safe harbor. What does a high-poverty, high-MFI tract without many college students look like? One example is Census Tract 9 in Hamilton County, Ohio. This tract encompasses the “Over-the-Rhine” neighborhood, which has started to turn around after decades of deterioration thanks to considerable city, civic, and private sector engagement. Recent progress notwithstanding, according to the latest data, 39 percent of homes remain vacant and 43 percent of the adult population remains out of work. The tract’s 43 percent poverty rate comfortably qualifies it as “severely distressed” according to Treasury’s CDFI Fund. Maintaining Opportunity Zone designation for such a tract seems reasonable, especially given the demonstrated public and private commitment to the neighborhood.
Many other high-poverty high-MFI tracts are downtowns—of Buffalo, NY; Dallas, TX, and Montgomery and Mobile, AL—as well as the Warehouse District in New Orleans and part of downtown Portland, OR. In many of these areas, well-off and deeply distressed populations live side-by-side.
Contiguous tracts
Governors designated a total of 169 Opportunity Zones, representing 2.2 percent of total Opportunity Zones (excluding territories), under the contiguity clause. Since governors were permitted to substitute contiguous tracts for up to 5 percent of their total eligible tracts, this figure shows that governors used their authority under this provision less than half as frequently as they could have. The most prolific users of the contiguous tract provision were New York (17 tracts), North Carolina (11), and Pennsylvania (11). Eight states only designated one contiguous tract, and 13 states designated none. Several of the tracts that seem most disconnected from the intent of the Opportunity Zones initiative—including tracts in downtown Portland, Oregon, Storey County, Nevada, and Long Island City, Queens—are contiguous tracts.
Of the 169 zones designated under the contiguity clause, 30 have an MFI greater than 120 percent of national MFI, and by our assessment are clearly too high-income to deserve Opportunity Zones status. The average MFI of these zones is $107,720 and average poverty rate is 10.7 percent. However, outside of those tracts, governors may have had justifiable rationales for nominating the moderate-income contiguous tracts. The remaining 139 contiguous tracts that fall under the 120 percent MFI cutoff have an average MFI of $61,972, well below the national MFI of $70,850. In addition, a total of 736 other (non-contiguous) Opportunity Zones (nearly 10 percent of all zones) meet the standard definition of a low-income community but have an MFI that falls somewhere between that $61,972 figure and 120 percent of the national one. In other words, traditional LICs with comparable MFIs are not in the line of fire. The contiguity provision of the Wyden proposal would therefore revoke Opportunity Zones status based purely on how a tract qualified, not because the tract is necessarily an outlier or exceptionally high income. It is unclear that there is a compelling public policy rationale for sunsetting such zones in particular.
EIG’s provisional assessment of the proposal
Congress should sunset zones that do not meet the spirit and intent of the law as soon as possible, but should do so in a surgical and targeted manner. While effective at capturing the most egregious cases, the Wyden proposal goes too far in removing zones that are not outliers or clearly undeserving of Opportunity Zones status, namely by revoking status for contiguous tracts that do not differ substantially from many other zones that will remain. Regardless of the exact method used, dealing with tracts that distort the Opportunity Zones marketplace and violate the intent of the law should be a centerpiece of any effort to improve or reform the Opportunity Zones statute. The Wyden bill represents a solid first step in need of further refinement.
Distribution of impacted census tracts across states
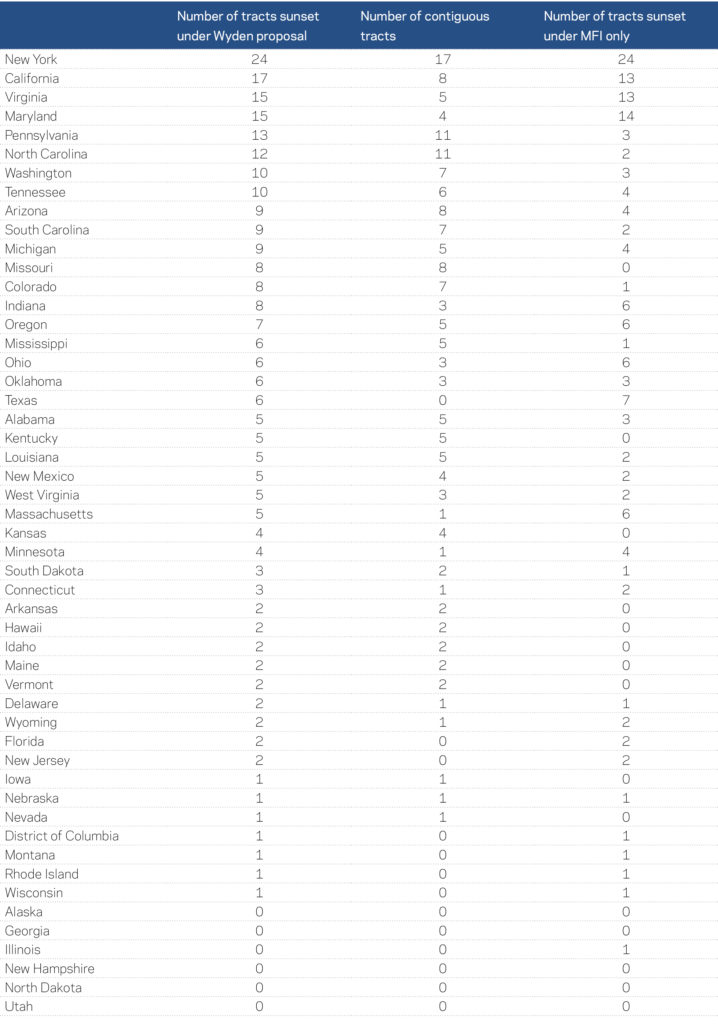
Source: EIG analysis of American Community Survey 2013-2017 Estimates
Correction: An earlier version of this analysis included incorrect counts of contiguous tracts.