
By: Daniel Newman and Kenan Fikri
Key Findings
- The share of the country’s population in the prime working age bracket (age 25 to 54) shrank from 43 percent to 39 percent between 2007 and 2018. More than two-thirds of large cities also recorded a declining share over that time.
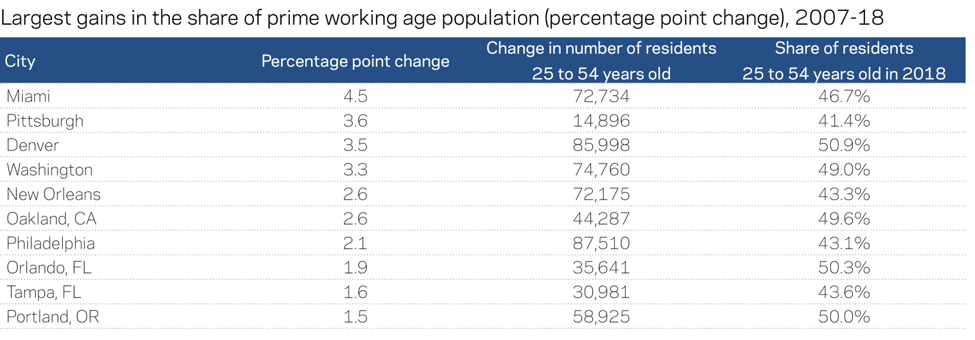
- Among cities that bucked the national trend, the prime age share increased the fastest in Miami, Pittsburgh, Denver, and Washington, DC.
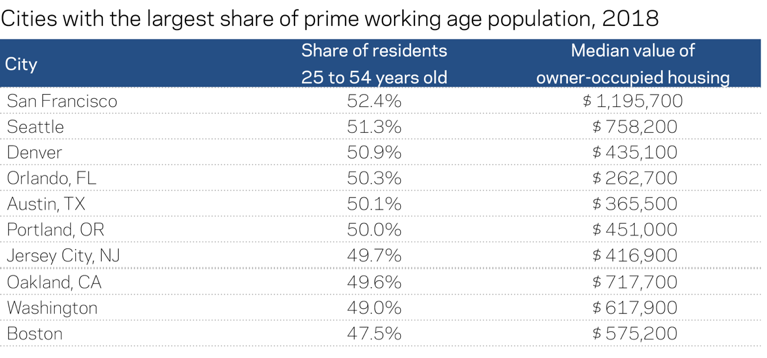
- In only six large cities is the majority of the population prime working age. San Francisco has the largest prime age share, at 52 percent of its population. The remaining five are Austin, Denver, Orlando, Portland, OR, and Seattle.
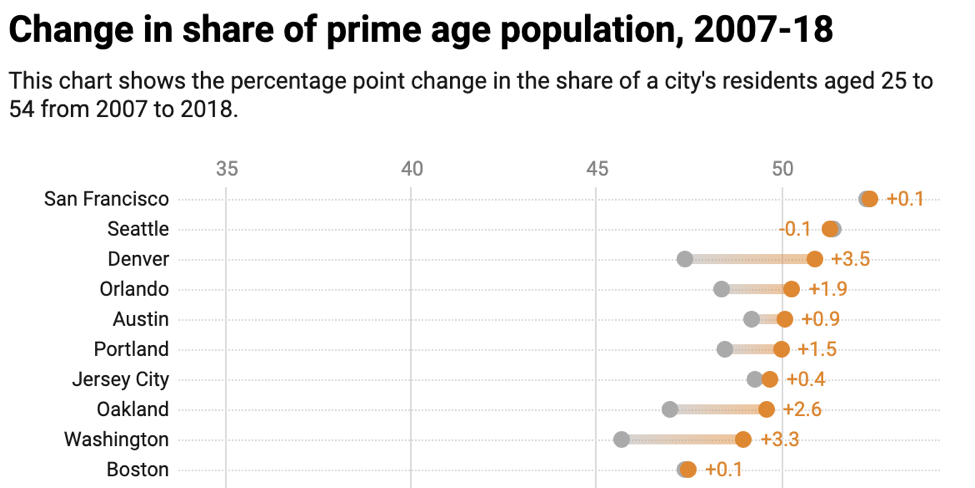
- Six of the 10 cities with the largest prime age shares in 2007 remained among the top in 2018. San Francisco and Seattle ranked first and second in both time periods, respectively.
Introduction
The prime working age population—adults between the ages of 25 and 54—represents the core of the country’s workforce and includes its most economically productive demographic. Four-fifths of this cohort are employed at any given point in time, compared to about half of 16- to 24-year-olds and just two-fifths of the 55 and older crowd.1 Nationally, 39 percent of the population falls into the prime age bracket, but the share tends to run higher in urban areas. In 2018, it comprised about 43 percent of the average large city’s population.2
Where productive residents choose to live and work influences the nature and fates of local economies. Yet as the country ages, a progressively smaller share of the national population falls into this productive cohort. In absolute terms, the number of prime working age Americans was virtually flat from 2007 to 2018, as it ticked up less than 1 percent to around 128 million people. Meanwhile, the population ages 55 and above ballooned by over 34 percent.
In other words, the competition across places for prime age workers is growing more intense. Falling rates of geographic mobility only underscore this point: the fraction of the American population moving each year stands at its lowest point on record. That leaves fewer mobile Americans than ever for places to try to attract. With birth rates near historic lows, immigration falling, and the senior share of the population rising, the United States’ economy and society are undergoing a transformation.
Cities are on the front lines of these changes. This analysis sets out to identify those cities that, amid these competing forces, are evolving against the national grain to become even more specialized in work and production, which we define as having a rising share of the prime working age cohort. Cities are of particular interest because they represent administrative units and tax bases that metropolitan areas do not. They compete for prime age workers not only against their peers on a national basis, but also against their suburban and exurban neighbors. The past decade has been marked by a huge shift in the location preferences of workers, especially young ones, in favor of central cities. Focusing on cities leads to different insights about urban demographic transformation from what a metro-scaled analysis would provide.
Examining changes in the share of city populations age 25 to 54 from 2007, before the onset of the Great Recession, through the latest available data for 2018, we found a general trend of persistence in the rankings amid a handful of dramatic climbs or falls.
Persistence at the top
Among large cities (those with at least 250,000 residents3), six of the 10 with the biggest prime age shares in 2007 also landed in the top 10 in 2018. Boston and Denver were tied at 11th in 2007 before climbing into the top 10 by 2018. This points to persistence at the top—that many cities that started the period disproportionately specialized in work remained so through the recession and recovery years that followed. San Francisco and Seattle represent this most clearly, ranking first and second in both time periods, respectively.
See here for a chart with data for the full list of large cities
Cities with large prime age cohorts share several characteristics (oriented towards technology, knowledge, and high-end services industries, for example), including that they tend to be expensive places to live. Their high costs of living may price out non-working individuals, those with large families, and retirees on fixed incomes, further reinforcing their orientation towards working age demographics. As the table below shows, the median housing values of the top 10 cities are well above the national median of $229,700. Generally speaking, one must be working to be able to afford to live in one of these places. Orlando stands out as the comparatively affordable exception.
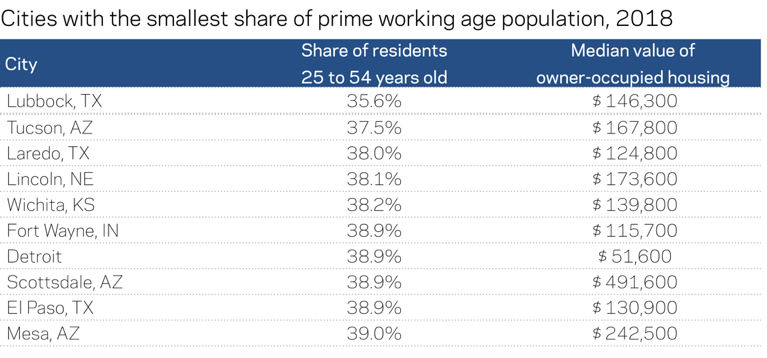
At the other end of the spectrum, the prime working age population’s share is the smallest in a mix of retiree hotspots (Scottsdale), university towns (Lincoln and Lubbock), high-immigration cities with especially large numbers of children (Laredo and El Paso), and economically struggling cities that offer fewer labor market opportunities to earn well (Detroit and Fort Wayne). In all of these cities a plurality of the population still falls into the prime age cohort, but as a rule they are places less defined by work people than many of their peers. With the exception of Scottsdale, median home values reflect the relative affordability of such cities. In all, only 12 large cities in the country register a prime age share below the national average (the other two are Henderson, NV, and Glendale, AZ).
Retiree hubs or student towns may be (and indeed often are) prosperous and comfortable places to live, but they are characteristically different entities than the hubs of production and commerce that are first and foremost defined by people in employment. Their industry structures often differ too—the former defined by consumption (of amenities, of education services, etc.); the latter by traded sector industries.
Dramatic shifts
Mirroring the national decline, the prime age slice of the demographic pie also shrunk in most large cities between 2007 and 2018. Most of these cities still added prime age residents in absolute numbers, but they added residents in other age brackets faster. Only 31 percent notched an increase in the overall share of prime age residents in their population over that time.
While the average large city experienced a 1 percentage point decrease in the prime age share from 2007 to 2018, a small but meaningful number of cities registered extremely rapid increases over the relatively short period. Miami, Pittsburgh, Denver, and Washington, DC, led the pack, experiencing demographic shifts of over 3 percentage points towards more prime age workers. In these cities, the prime working age population is growing faster relative to other age groups. It means that, for instance, one was about 4 percent more likely to choose any random resident of Miami and find that they fell into the 25 to 54 age bracket in 2018 than in 2007. These shifts in composition have real consequences for cities, as prime age workers bring disproportionate amounts of income, spending, and taxes to a city. Local tax revenue in Pittsburgh jumped by about 27 percent over this time period thanks in part to its prime working age population gains, for example.4
Conclusion
The geography of the country’s prime age workforce has shifted considerably over the past decade-plus that began just before the financial crisis. Some cities have enjoyed a renaissance thanks to a confluence of factors including the evolution of the economy in their favor (towards services and knowledge-based activities) and shifts in the locational preferences of the young, mobile, and well-paid. These dynamics have transformed the fortunes of cities such as Denver, Portland, and Washington, DC, but also cities with heavier industrial legacies, including Philadelphia and Pittsburgh. Meanwhile, they give real economic and productivity substance to the booms of Sun Belt cities such as Orlando.
Prime age workers and the value they bring are an increasingly scarce commodity, however. What can cities do to secure their supplies of this critical economic input? Building vibrant and affordable places is a start (and something, at least on the vibrancy front, in which cities have a natural advantage over their suburban competitors). Investing in the pipeline of local human capital is another. In an era of reduced geographic mobility, there is no substitute for growing one’s own talent. Fostering an entrepreneurial ecosystem that ensures local workers can find rewarding employment opportunities in the local labor market is yet another.
Explore the data for all large cities below.
1 U.S. Bureau of Labor Statistics, Current Population Survey
2 U.S. Census Bureau’s 2007 and 2018 American Community Survey 1-year Estimates
3 Note this analysis does not correct for any city-level boundary changes that may have occurred.
4 EIG calculation based on City of Pittsburgh Total General Fund Revenues.