
by Adam Ozimek and Eric Carlson
Key Findings
- Newly released Census data shows that remote work has increased unevenly across the United States.
- The highest rate of remote work is in Washington, DC, where 33.6% of the population worked remotely in 2021. The next highest is San Francisco, CA, and third is Austin, TX.
- While remote work is clustered along coastal areas and superstar cities, it is also prevalent in a variety of places in the interior of the United States and a handful of smaller areas.
- 13.7% of the country lives in a commuting zone where remote work share is greater than 25%.
- Remote work is related to occupation mix, higher education levels, longer commute times, and more expensive housing markets.
Remote work has increased drastically compared to before the pandemic, that much is clear. This rise in telework offers new opportunities for the economic development of communities across the country by loosening the grip that superstar cities have on skilled knowledge workers. Indeed, some cities like Tulsa, OK, and Tucson, AZ, have already developed programs aimed at curbing brain drain by attracting remote workers. But to-date, the geography of the remote work surge–information vital for the creation of smart place-based policies–has remained largely unmeasured in the data. The release of 2021 American Community Survey (ACS) data provides us with the first detailed look at the geographic distribution of remote work and its apparent drivers. What we see is that remote work is not just a superstar city or coastal phenomenon.
We measure remote work using information on commuting habits. The ACS asks respondents how they usually get to work, and the share of workers who say that they "worked from home" acts as a good proxy for the prevalence of remote work. These data show that the remote work share has tripled from 5.6% in 2019 to 17.9% in 2021 at the national level—a big jump following a gradually increasing trend from 2000 to 2019 (Figure 1) [1]. Note while the lack of information about frequency of remote work makes this an imperfect measure of remote work intensity, the ACS allows far more geographic granularity than before.
Figure 1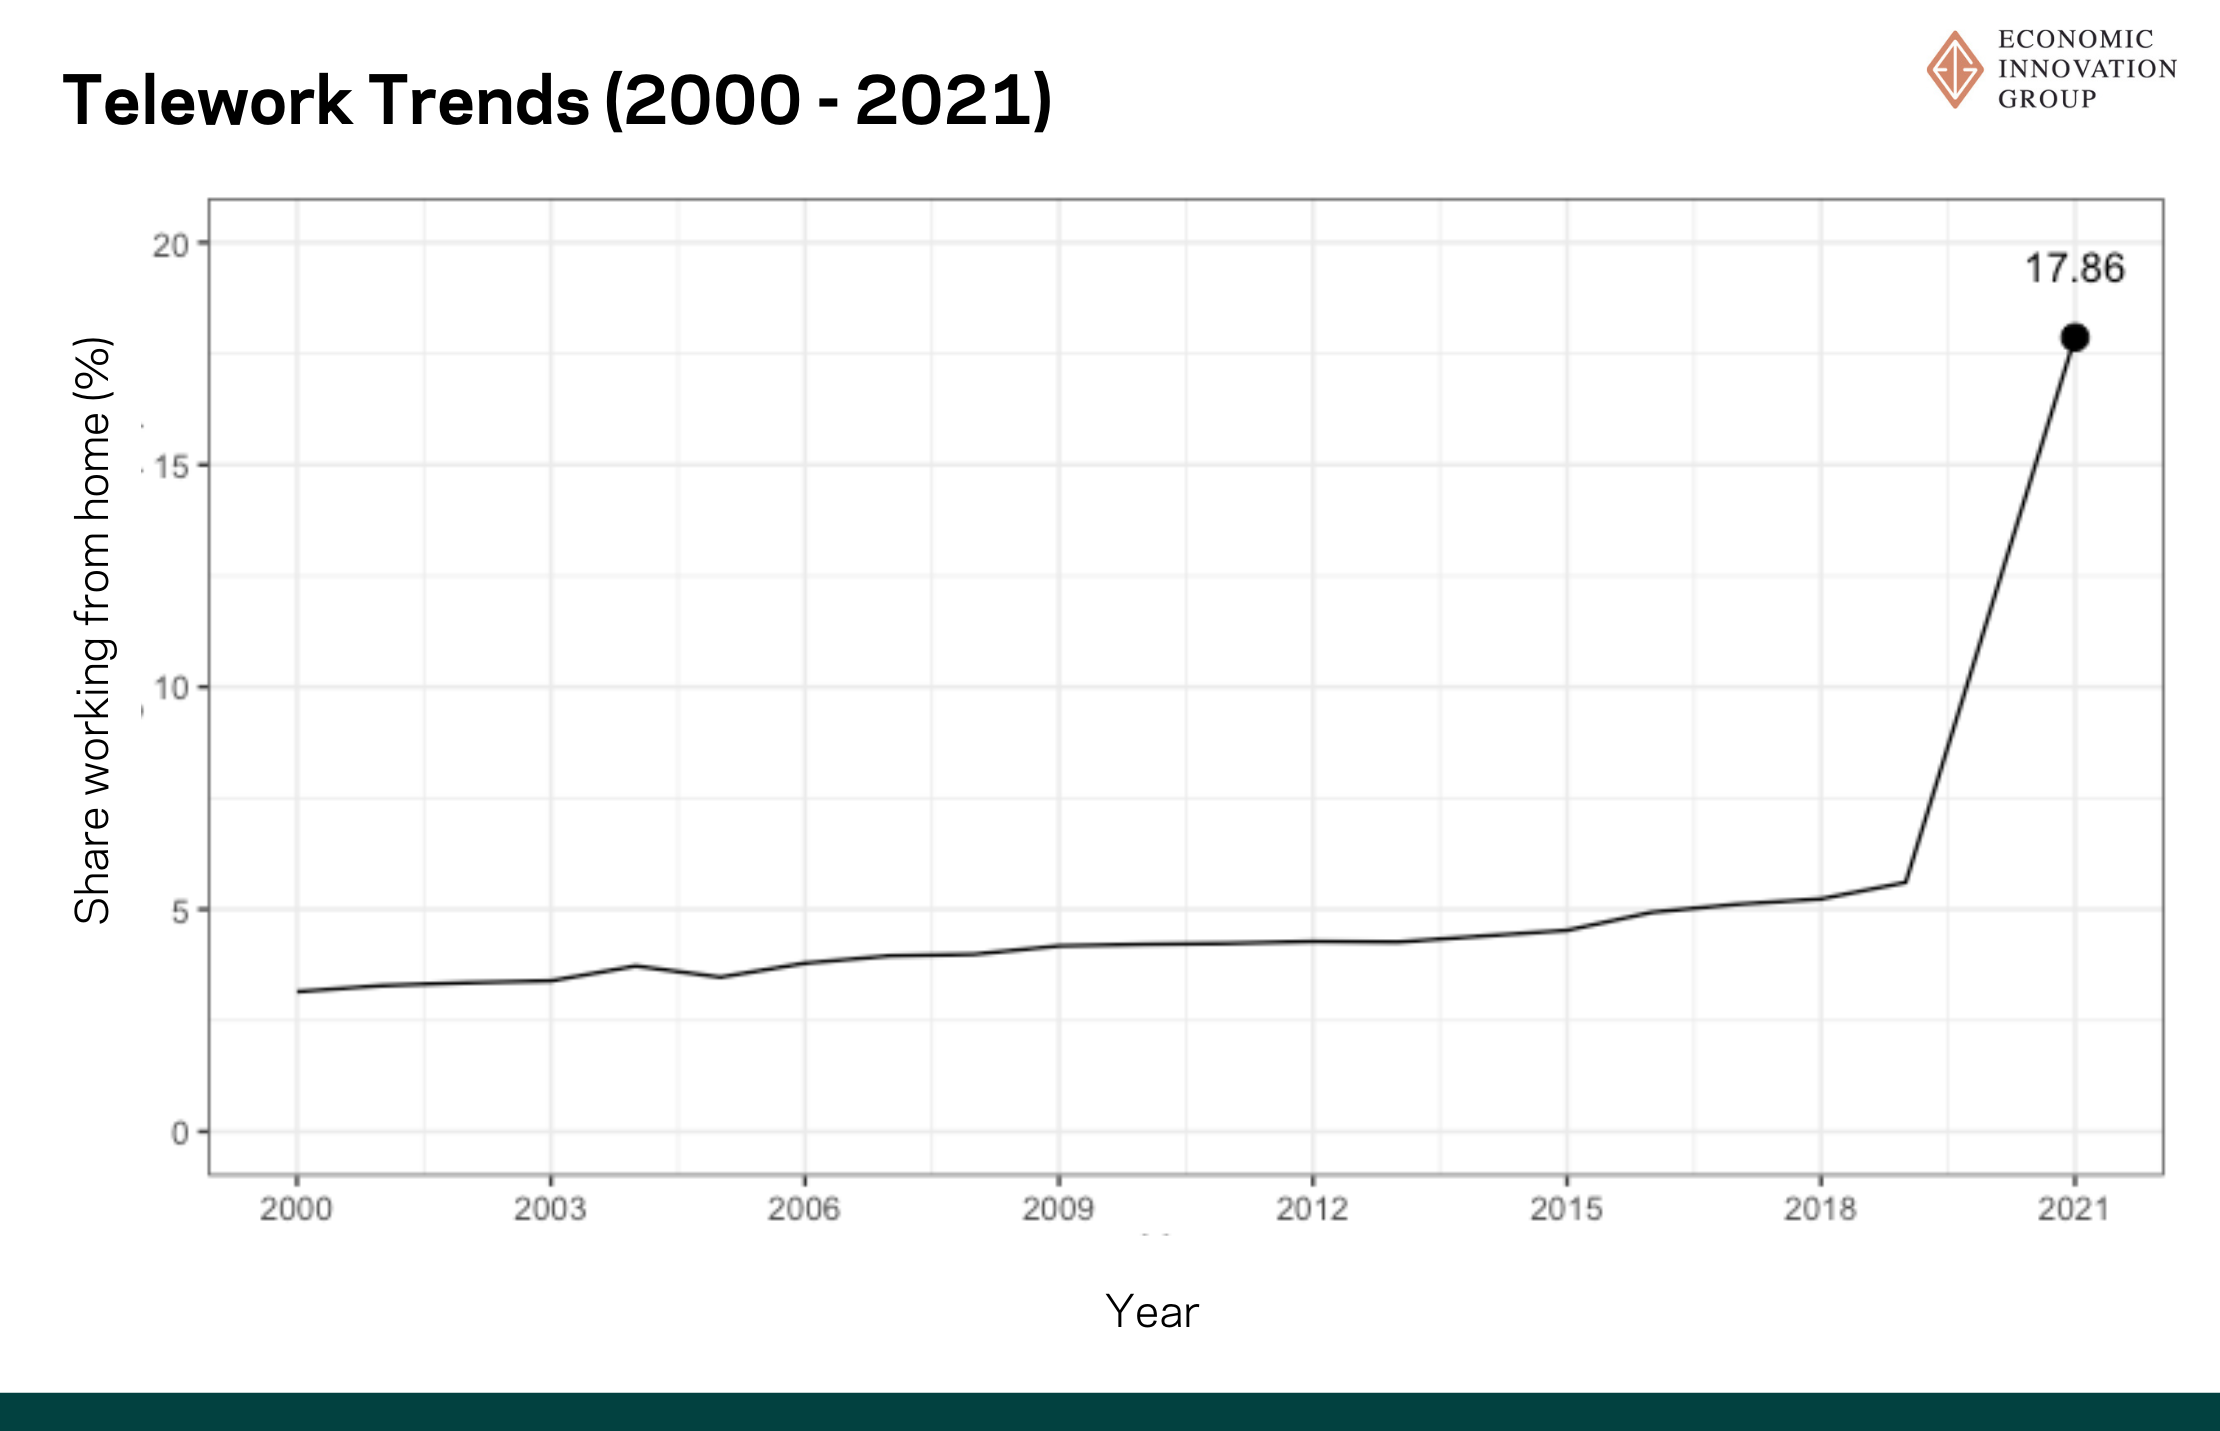
This drastic rise in remote work masks significant regional inequalities. Fortunately, the 2021 ACS has a large enough sample size to examine the uneven geography of remote work. For this analysis, we focus on remote work shares at the commuting zone level. Commuting zones (CZs) are generally clusters of counties that show strong commuting ties within a cluster and weak commuting ties between clusters. As such, CZs represent local labor markets which makes them a useful level of granularity to consider.
As the map below shows, some CZs remain at very low levels of remote work while others now see skyrocketing remote work shares (Figure 2). Overall, 25% of commuting zones have remote work rates below 7.2%, while the top 15 commuting zones average 28.0%. On a population weighted basis, only 1.8% of the country lives in a commuting zone where the remote work share is less than 5% and 13.7% of the country lives in a commuting zone where remote work share is greater than 25%.
Figure 2
The remote work share tends to be highest among CZs along the coasts–especially in the Northeast and the West Coast–and lowest among CZs in the South and the Midwest. However, there are a variety of interior cities that have high rates of remote work as well. This includes Austin, TX, Raleigh, NC, and Denver, CO, in the top 10 with remote work rates at 28% and higher. In the midwest, Chicago, IL, and Columbus, OH, are within the top 25, with remote work rates at 22% and higher.
The highest rate of remote work is in Washington, DC, where 33.6% of the population worked remotely in 2021. The next highest is San Francisco, CA, and third is Austin, TX. In general, the country's largest superstar cities are near the top of the list; however, there are many second tier cities on the list, and even some smaller areas—for example, Portola, CA, is ranked in 10th place despite being a relatively small commuting zone. Wilmington, DE, and Fredericksburg, VA, are two other smaller commuting zones in the top 25. In addition, New York City only comes in at 20th place, just above Columbus, OH.
Table 1
At the CZ level, the data allow us to identify a variety of factors that appear to drive the embrace of remote work. First, the occupational composition of a CZ has a clear effect on its remote work share. As shown in recent work by Jonathan Dingel and Bret Neiman, different occupations have different propensities for working from home. As a result, CZs with more computer programmers and financial analysts, for example, will have larger remote work shares than CZs with more construction workers. We use Dingel and Neiman's occupation-level telework measure combined with data on the local occupational mix from 2015-2019 to measure the percent of jobs that could theoretically be done remotely. The plot in Figure 3 shows a clear positive relationship between remotable jobs and 2021 remote share, suggesting that many of the people who could work from home chose to do so.
Figure 3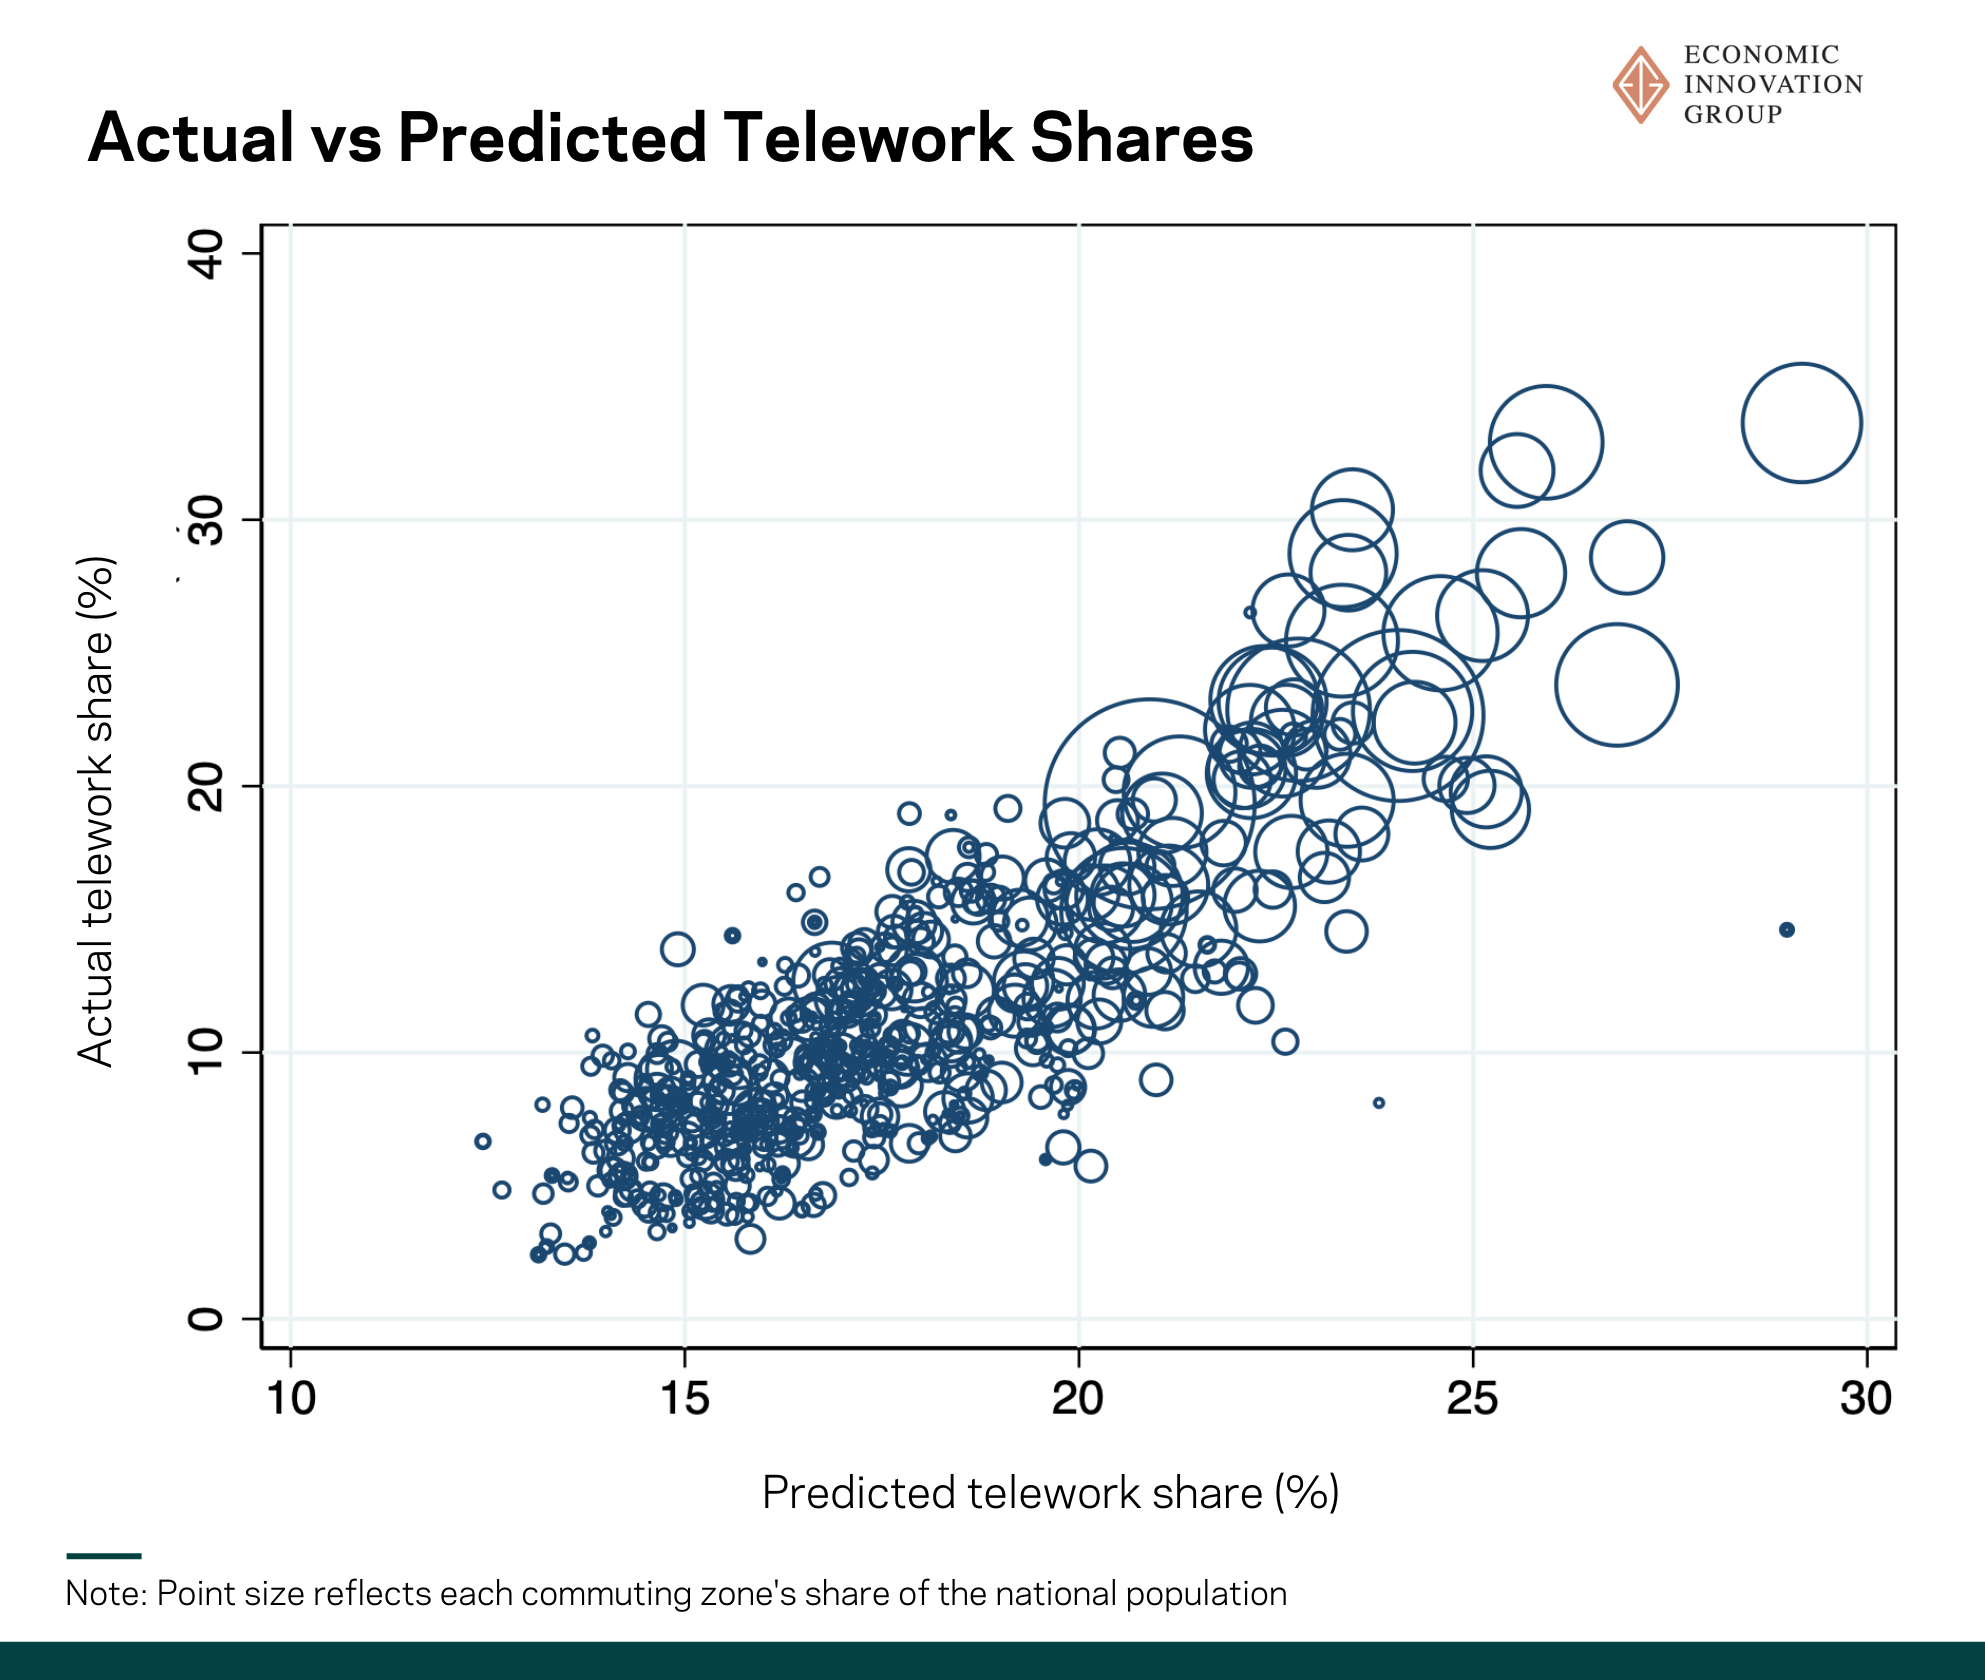
Second, CZs in which a large share of workers had long commute times in 2019 also had large telework shares in 2021. Figure 4 plots the remote work share against the share of workers who had commute times over an hour in 2019. Unsurprisingly, CZs in which workers had burdensome commute times opted to work remotely when given the opportunity.
Figure 4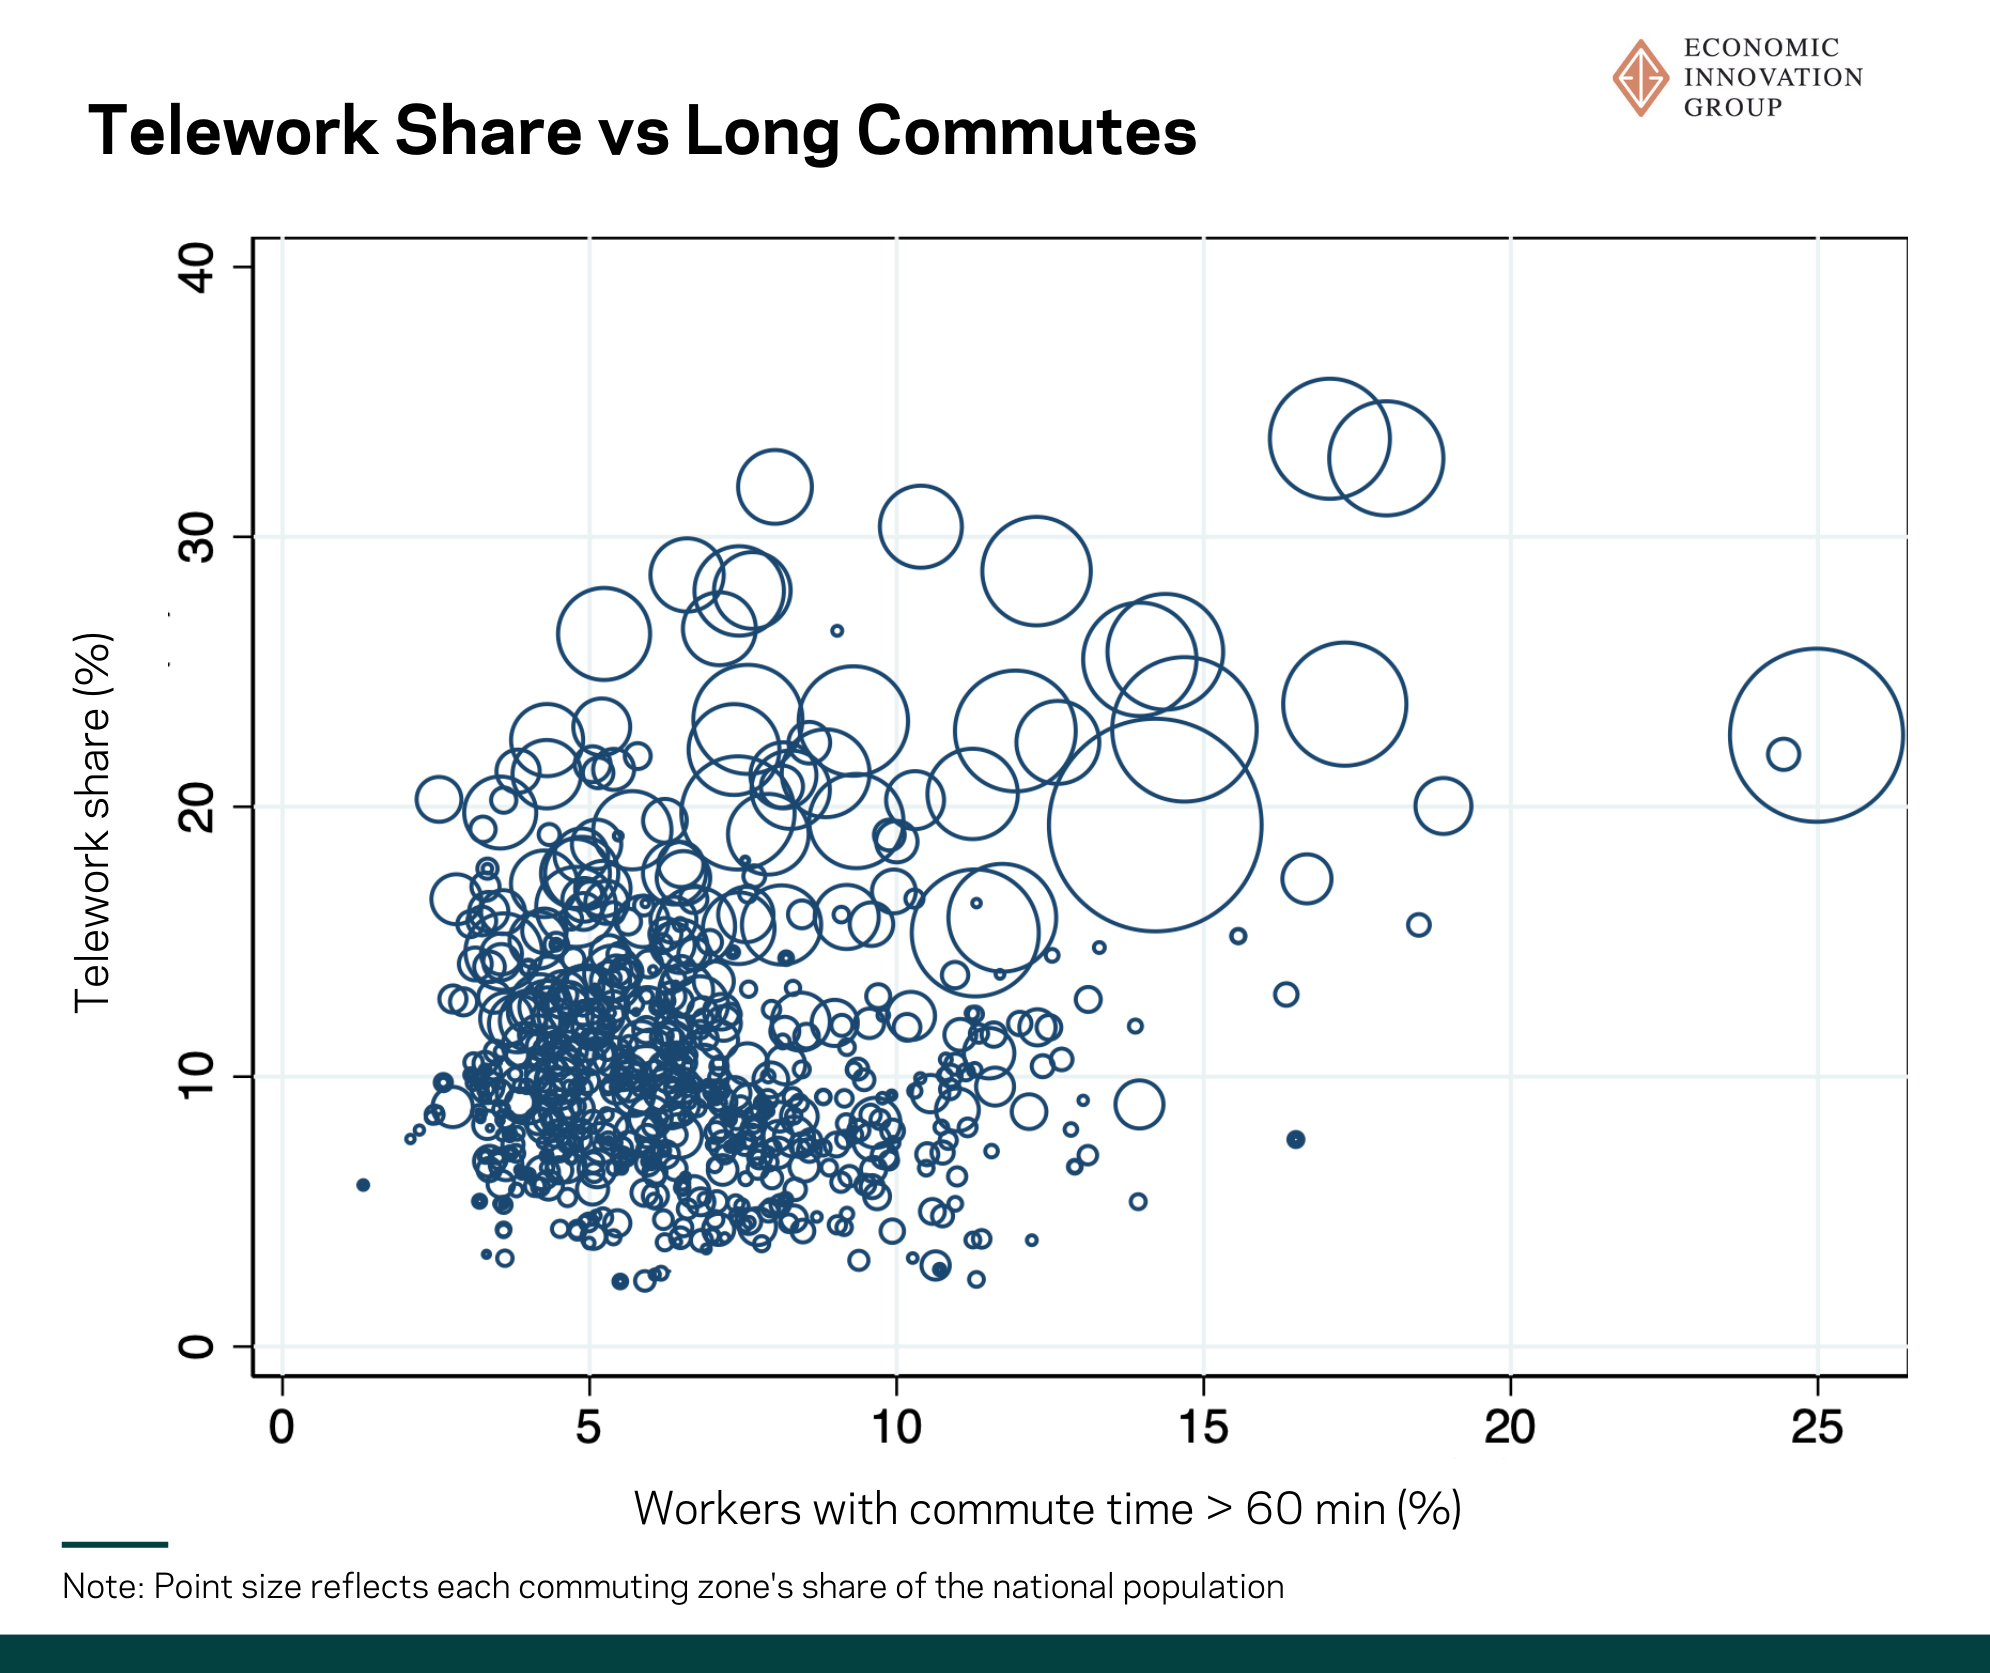
In addition, having more college-educated workers is positively associated with remote work shares. This likely reflects occupation sorting by education in which skilled workers take technology-intensive jobs that can be done remotely while less-educated workers take jobs that require more physical proximity.
Figure 5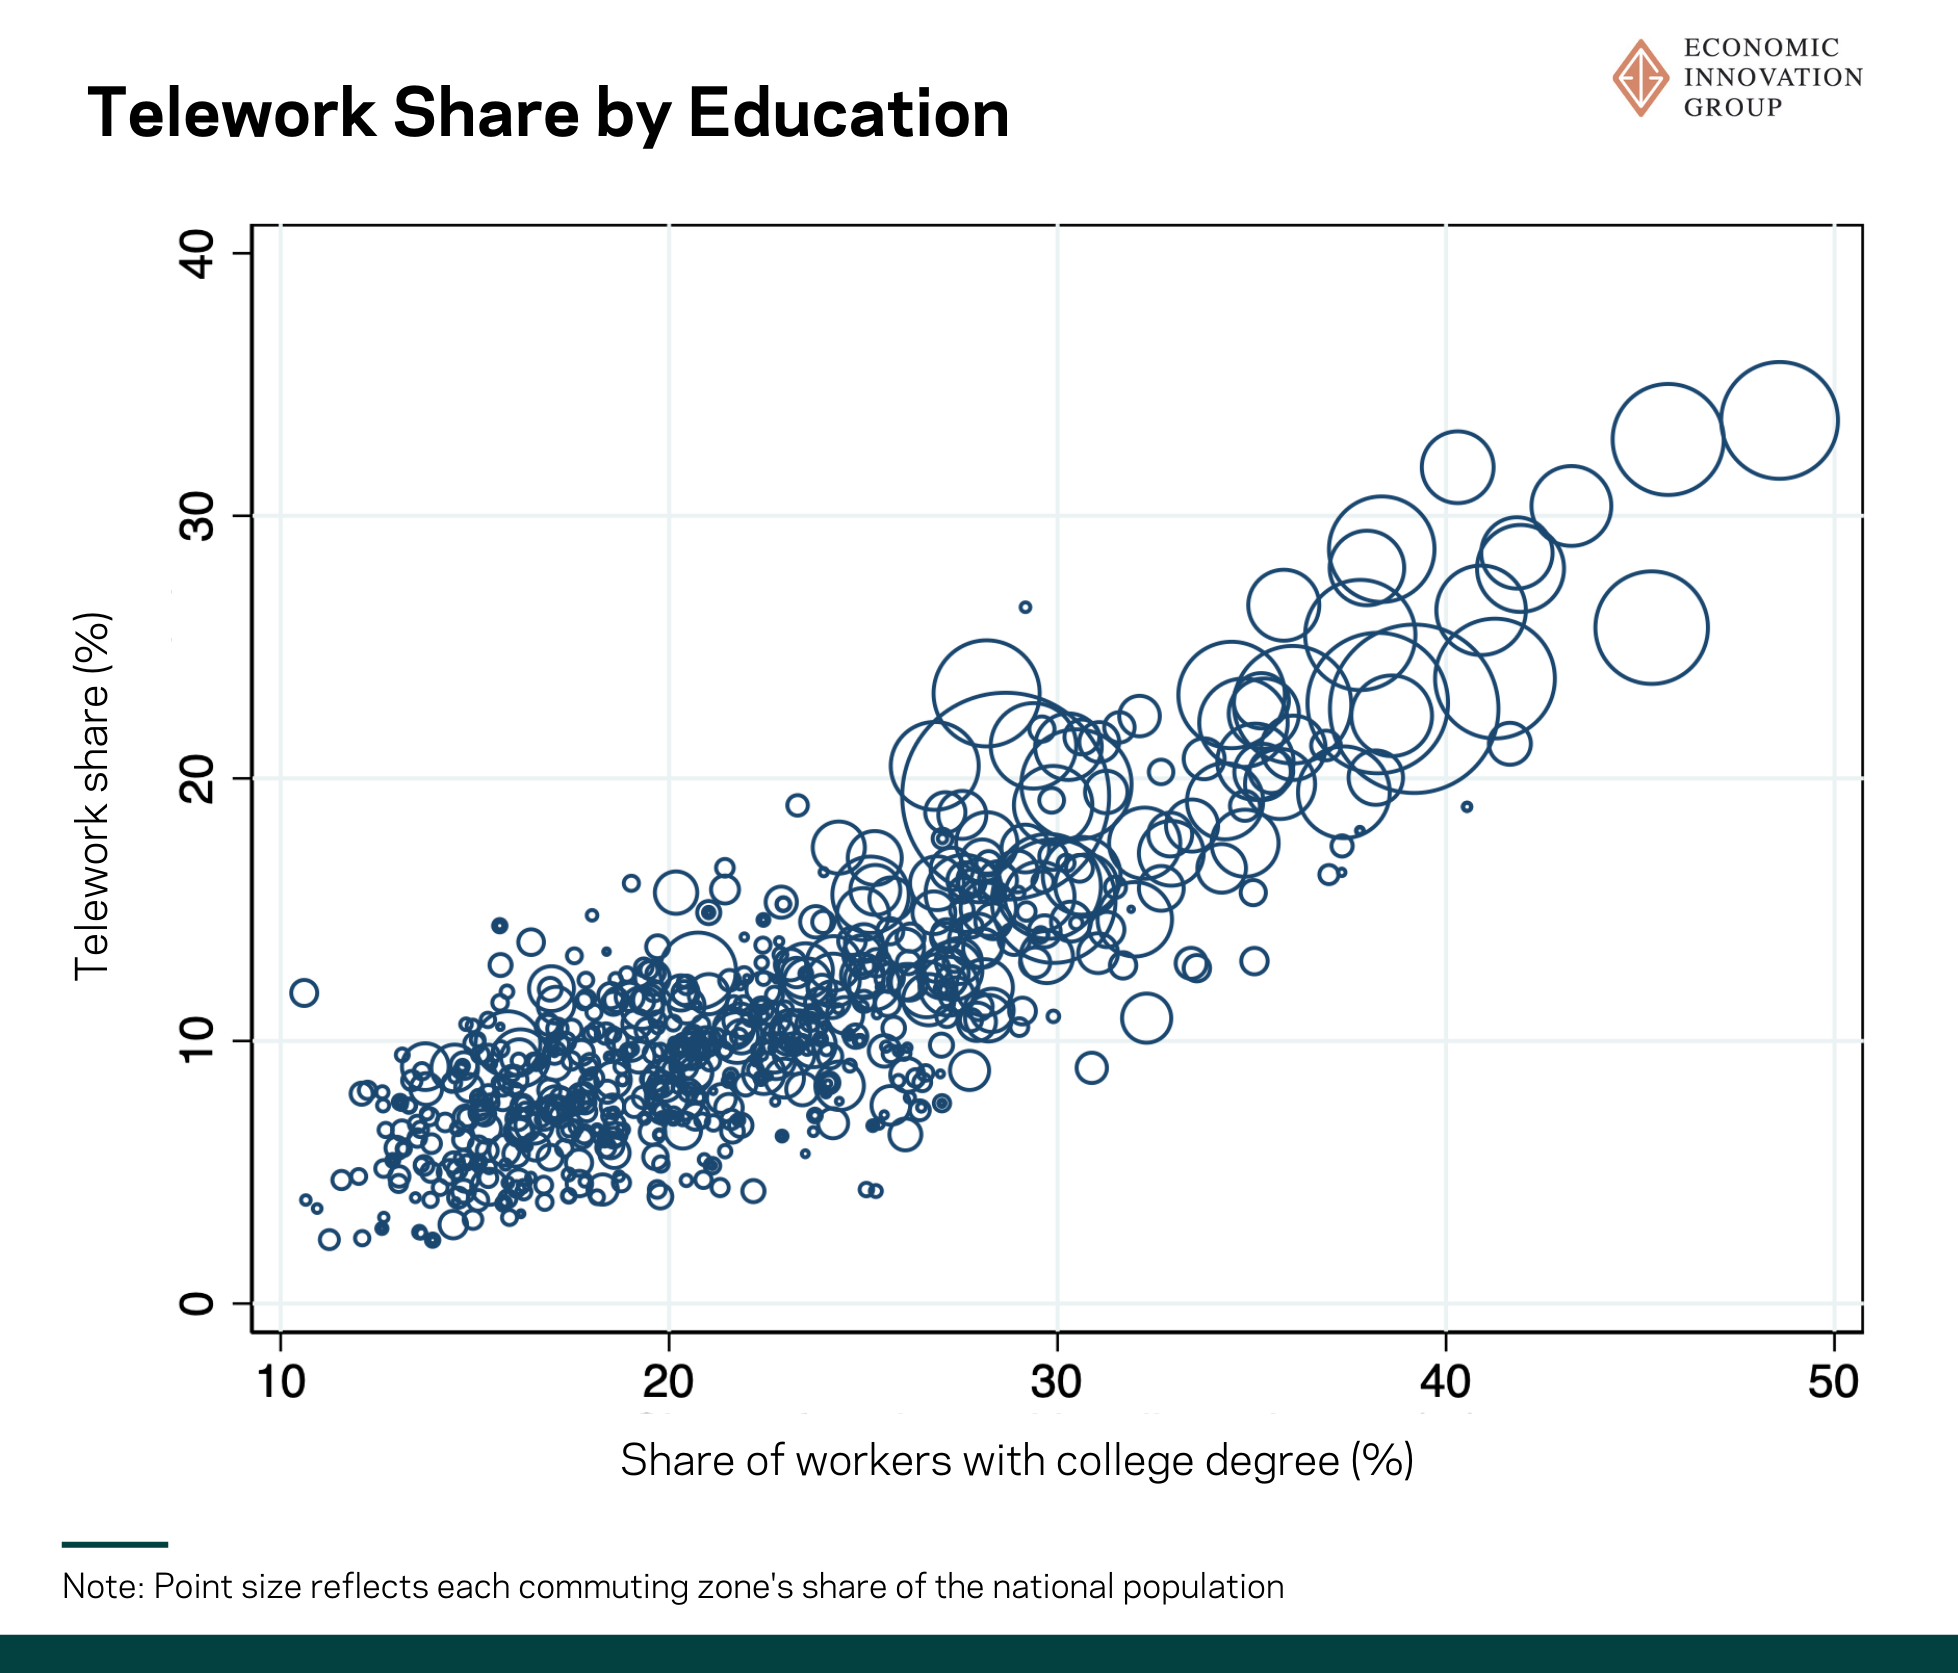
Adding all these factors together, we can use regression analysis to see which seem to be most important. In a CZ level regression, we compare the rates of working from home in 2021 while controlling for a range of labor market characteristics like the share of the foreign born population, the share of older workers, and the prevalence of the manufacturing sector. In addition, we control for spatial correlations between CZs that are geographically close to each other. As a robustness test, we also include a model with state level fixed effects to control for state-level factors.
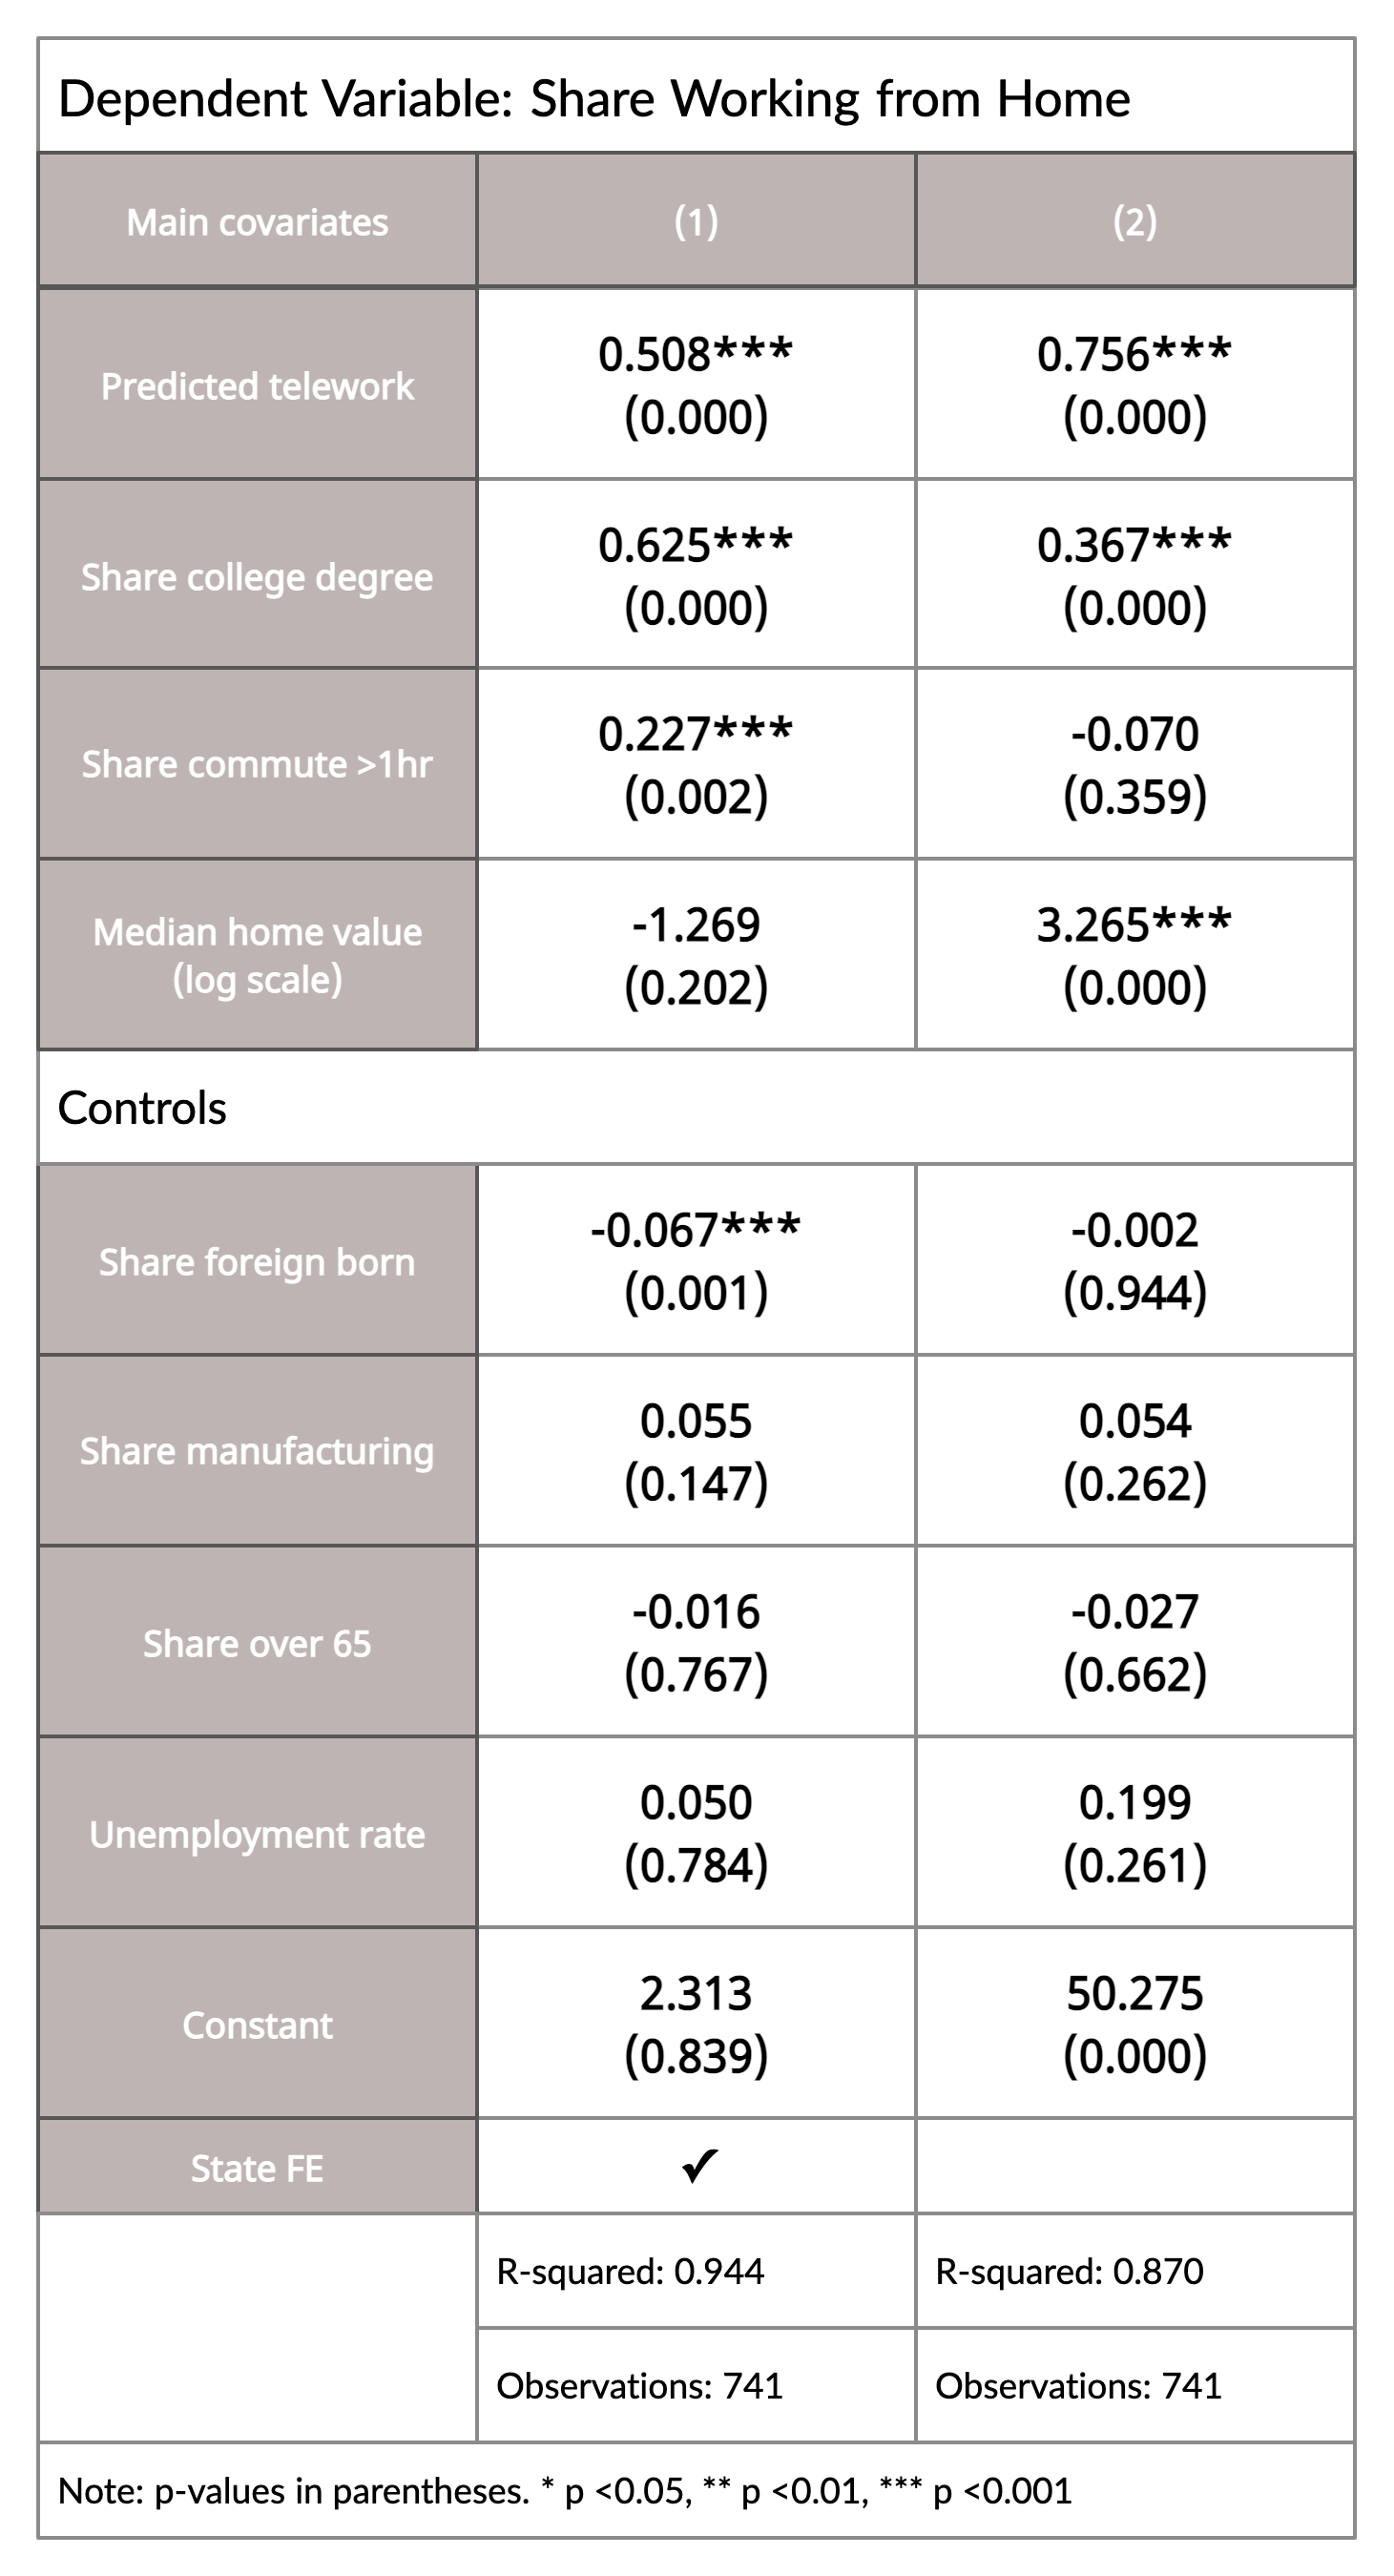
Confirming the relationship shown in Figure 3, we find that the 2019 occupational composition of CZs is a strong predictor of the 2021 remote work share and explains nearly half of the variation in working from home. In a bivariate regression, the relationship between the predicted and the actual remote share is almost two-to-one. This may suggest that the occupation-level measure underestimates the remotability of some jobs. However, the relationship weakens substantially after controlling for education.
Education remains an important predictor of working remotely even after controlling for occupation mix. For example, a 10 percentage point increase in a CZ's share of college graduates roughly leads to a 6.3 percentage point increase in the share of people working from home. These results are in line with other research showing that workers with college degrees are more able to work from home and that workers without college degrees are more likely to have jobs that require physical proximity. It is unclear whether a more educated population increases remote working at an individual level or a place-based level, with more research needed here. For example, a more educated population could lead to different local policies, like tax rates or school quality, that affect remote working. Alternatively, the occupation based measure of remotability may be missing variation in the extent to which jobs can be remote that education level captures.
Having historically long commute times is also a significant predictor of working from home in 2021, however only when state fixed effects are included. Confirming the relationship shown in Figure 4, the regression model reveals that CZs in which more workers traveled over an hour to get to work in 2019 had larger shares of people working from home in 2021. A 10 percentage point increase in a commuting zone's share of workers who worked over an hour away leads to a 2.3 percentage point increase in the share of people working remotely.
In addition, consistent with past work, commuting zones with higher home values have greater incidence of remote work. This result does not hold when state fixed-effects are included, suggesting that it is absolute levels of housing values, and not relative to the region, that predict remote working. More research is needed to understand whether high housing costs are driving within commuting zone moves, which then spur remote work, or some other mechanism is driving this result.
This work represents a preliminary analysis of the geographic trends in remote work, but much remains to be done. In particular, because we use aggregated data, we have to be careful to interpret the results in an ecological context. For example, the positive relationship between the share of college educated workers and the remote work share does not necessarily imply that earning a college degree makes someone more likely to work remotely. Rather, it could be that all workers, regardless of education, are more likely to work remotely if a large share of the community has college degrees.
What we can say is that within the United States there has been significant variation in the extent to which populations have benefitted from remote work. Importantly, while remote work is concentrated along the coasts, we do see that there are places in every region and places outside of superstar cities with high levels of remote work. It should not be considered entirely a coast or superstar city phenomenon.
Notes:
- The Census did not release their standard 2020 due to the impact of COVID on data collection.