By Jimmy O’Donnell, Daniel Newman, and Kenan Fikri
The COVID-19 crisis plunged the U.S. economy into its quickest and deepest economic recession in modern U.S. history. In the near-term, how and when the country gets out of the disaster will primarily be determined by its public health response and the efficacy of rolling out the vaccine.
Yet if history is any indication, the strength of the longer-term recovery will be determined in part by the vitality of American entrepreneurship. New business formation traditionally powers economic recoveries, as entrepreneurs and new growth companies take advantage of new market opportunities and the resources freed up by firms that contracted or failed during recessions. That mechanism broke down somewhat in the wake of the Great Recession, and the depressed startup rates that persisted throughout the 2010s may have contributed to the slow and uneven nature of the recovery that followed.
A new Census Bureau dataset allows us to track early-stage entrepreneurial activity in almost real-time. For the duration of the pandemic, the Bureau’s Business Formation Statistics series has provided a detailed look at the number and character of new business applications on a weekly basis. Its findings suggest that the pandemic delivered a massive shock to American entrepreneurship that has seriously altered established trends in new business formation. Counter to expectations, 2020 shaped up to be the best year for business applications on record.
This post documents five key things we observed in the data during this most unusual year, rounding EIG’s now-retiring weekly tracker.
1. Business applications were the highest on record in 2020—up 24 percent from the previous year.
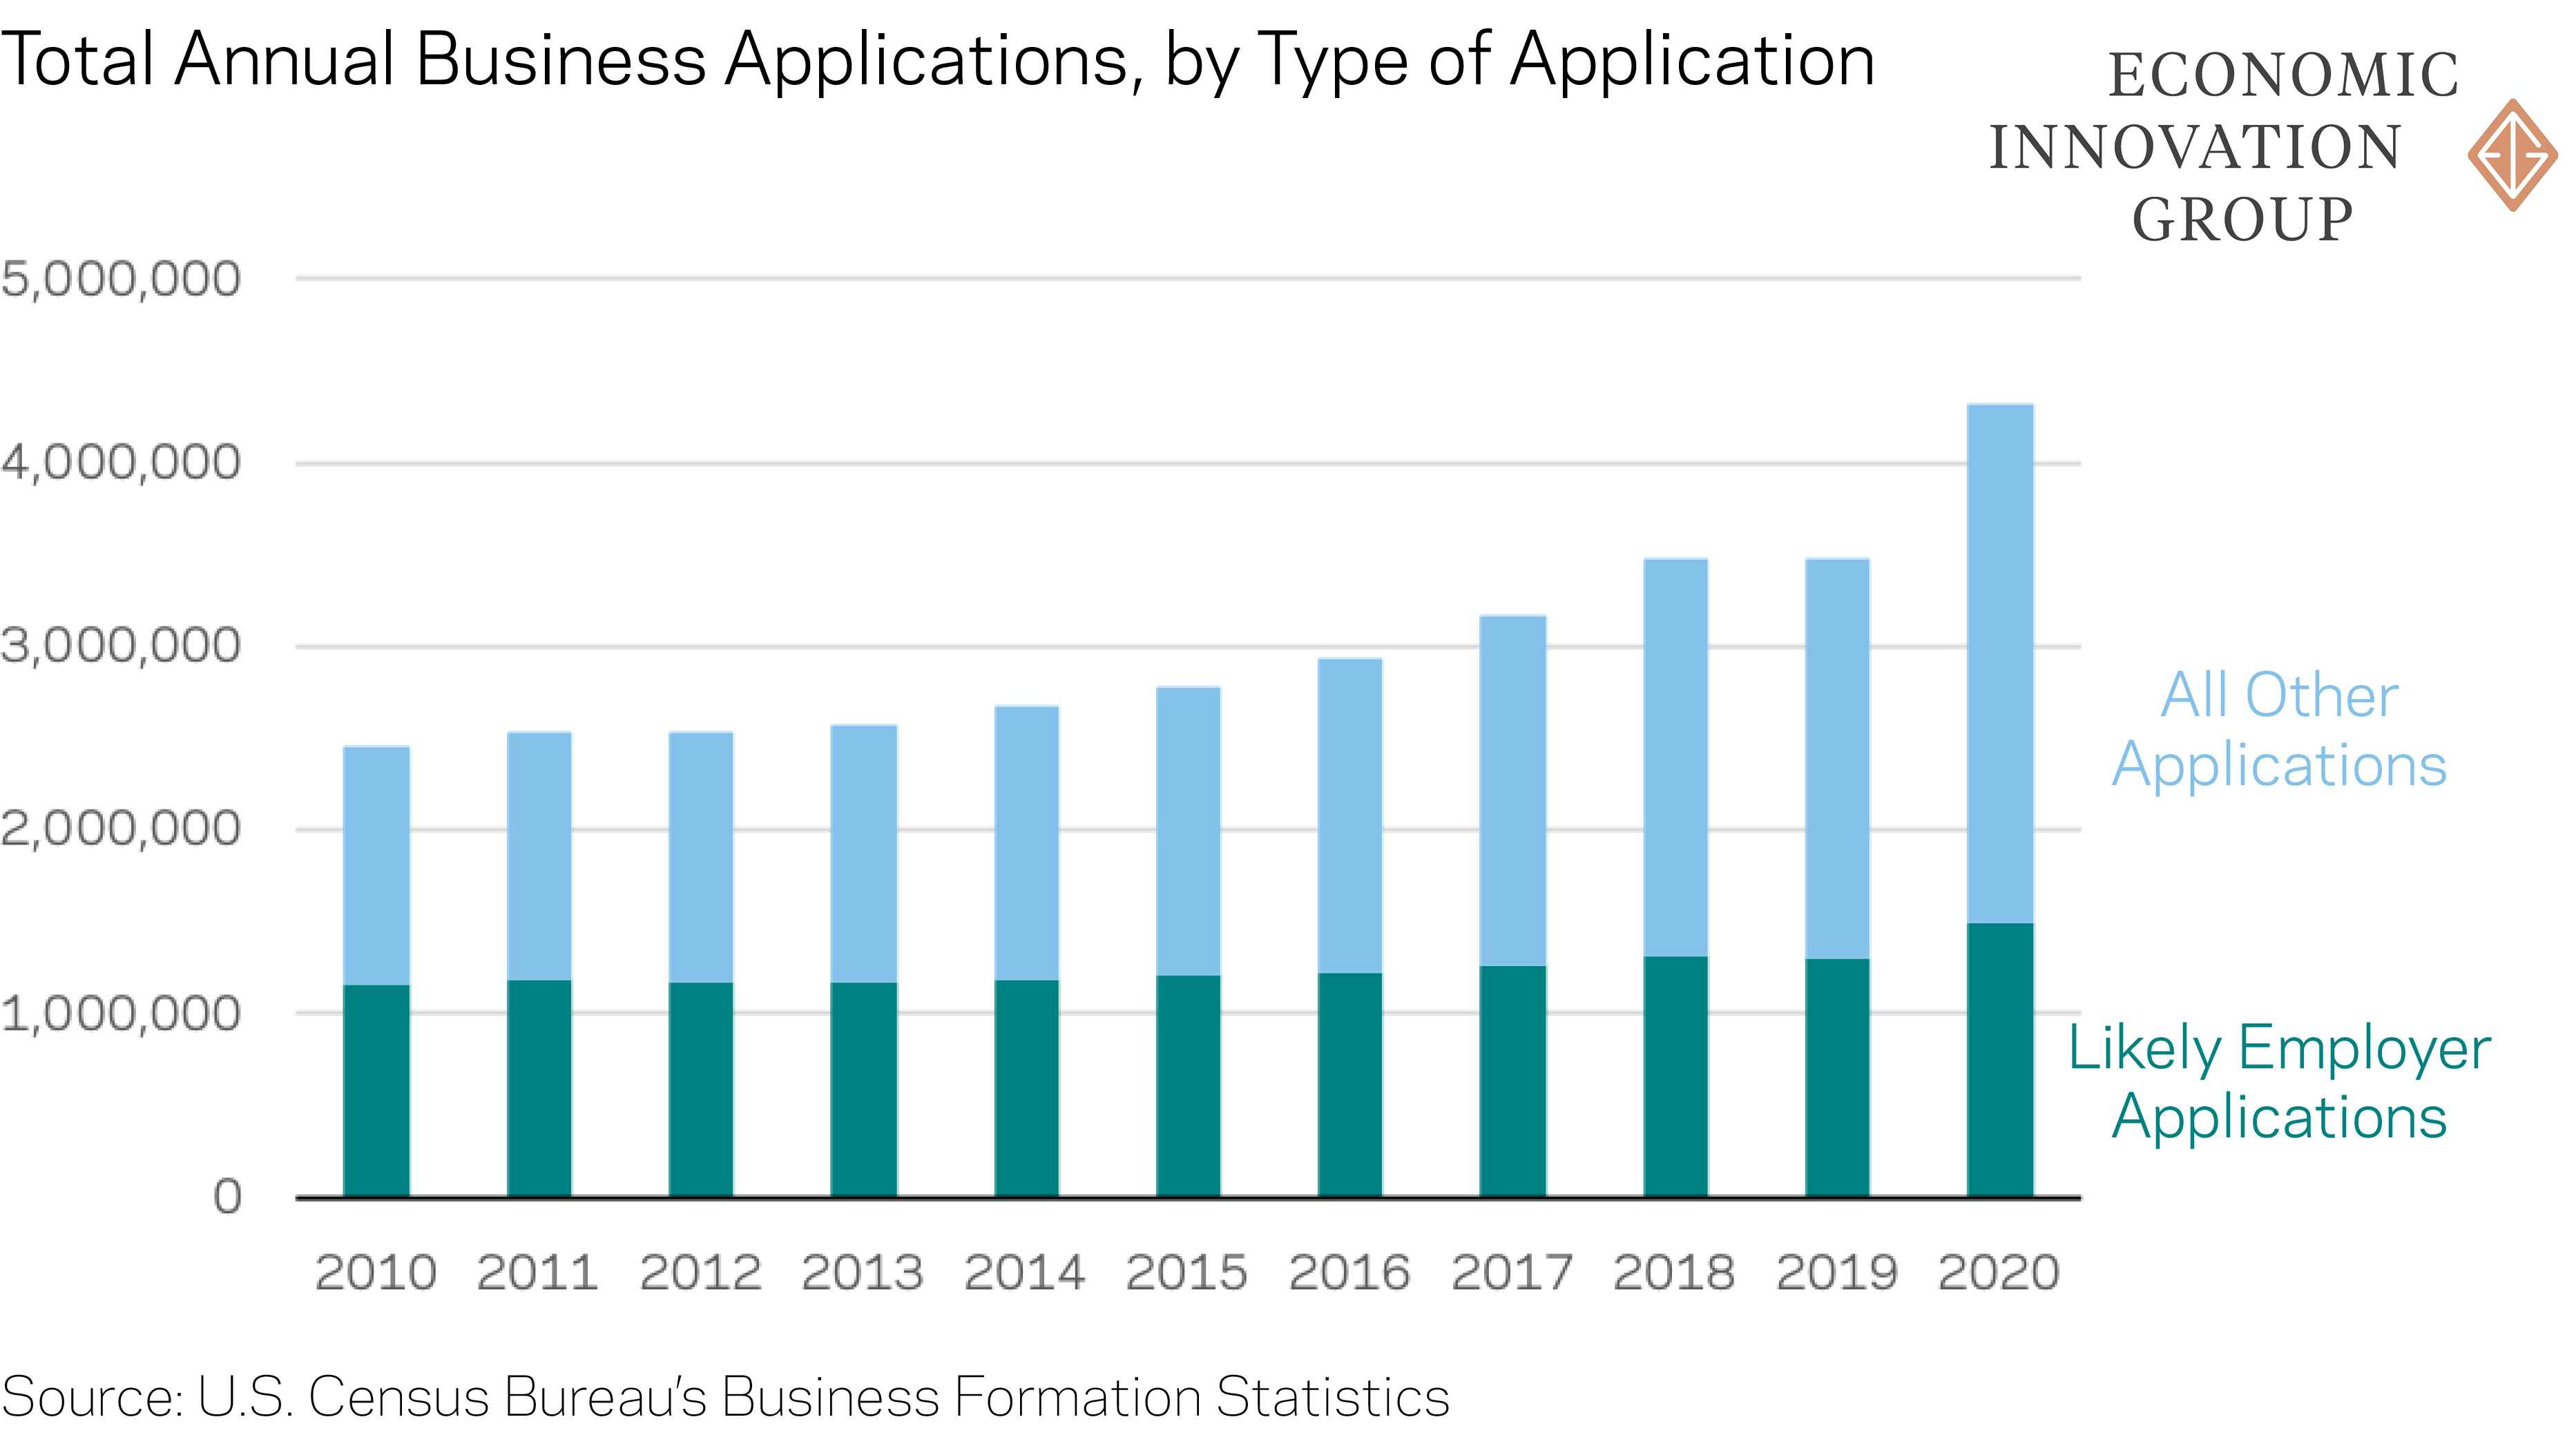
In 2020, there was an explosion in new business applications, reaching nearly 4.5 million by year’s end—a 24.3 percent increase from 2019 and 51.0 percent higher than the 2010-19 average. Between 2005 and 2019, business applications hovered around 2.5 million per year and were roughly evenly split between what Census calls “high-propensity business applications” and all other business applications. High-propensity applications have a strong likelihood of turning into businesses with employees on payroll. Census makes this determination based on a number of factors from the application, such as whether it comes from a corporate entity, indicates it plans to hire employees, or is from a certain industry that is associated with likely employment (e.g., manufacturing, retail stores, or restaurants). For this reason, we often refer to high-propensity businesses as “likely employers.”
Although the majority of the growth was in likely non-employers (perhaps as the laid off turned to self-employment opportunities), there was still a noticeable increase in high-propensity business applications as well. These likely employer applications—up 15.5 percent from 2019 and 22.9 percent above their 2010-19 average—are particularly important because they represent the applications for businesses most likely to lead to lasting job growth and innovation. While the surge in applications is notable, it is important to understand that this is a forward looking indicator—it takes time for an application to actually turn into a new business, and not every application completes the journey. Indeed, the latest evidence from the Census Bureau suggests that the pace at which high-propensity applications are translating into true active firms is slower than after the Great Recession.
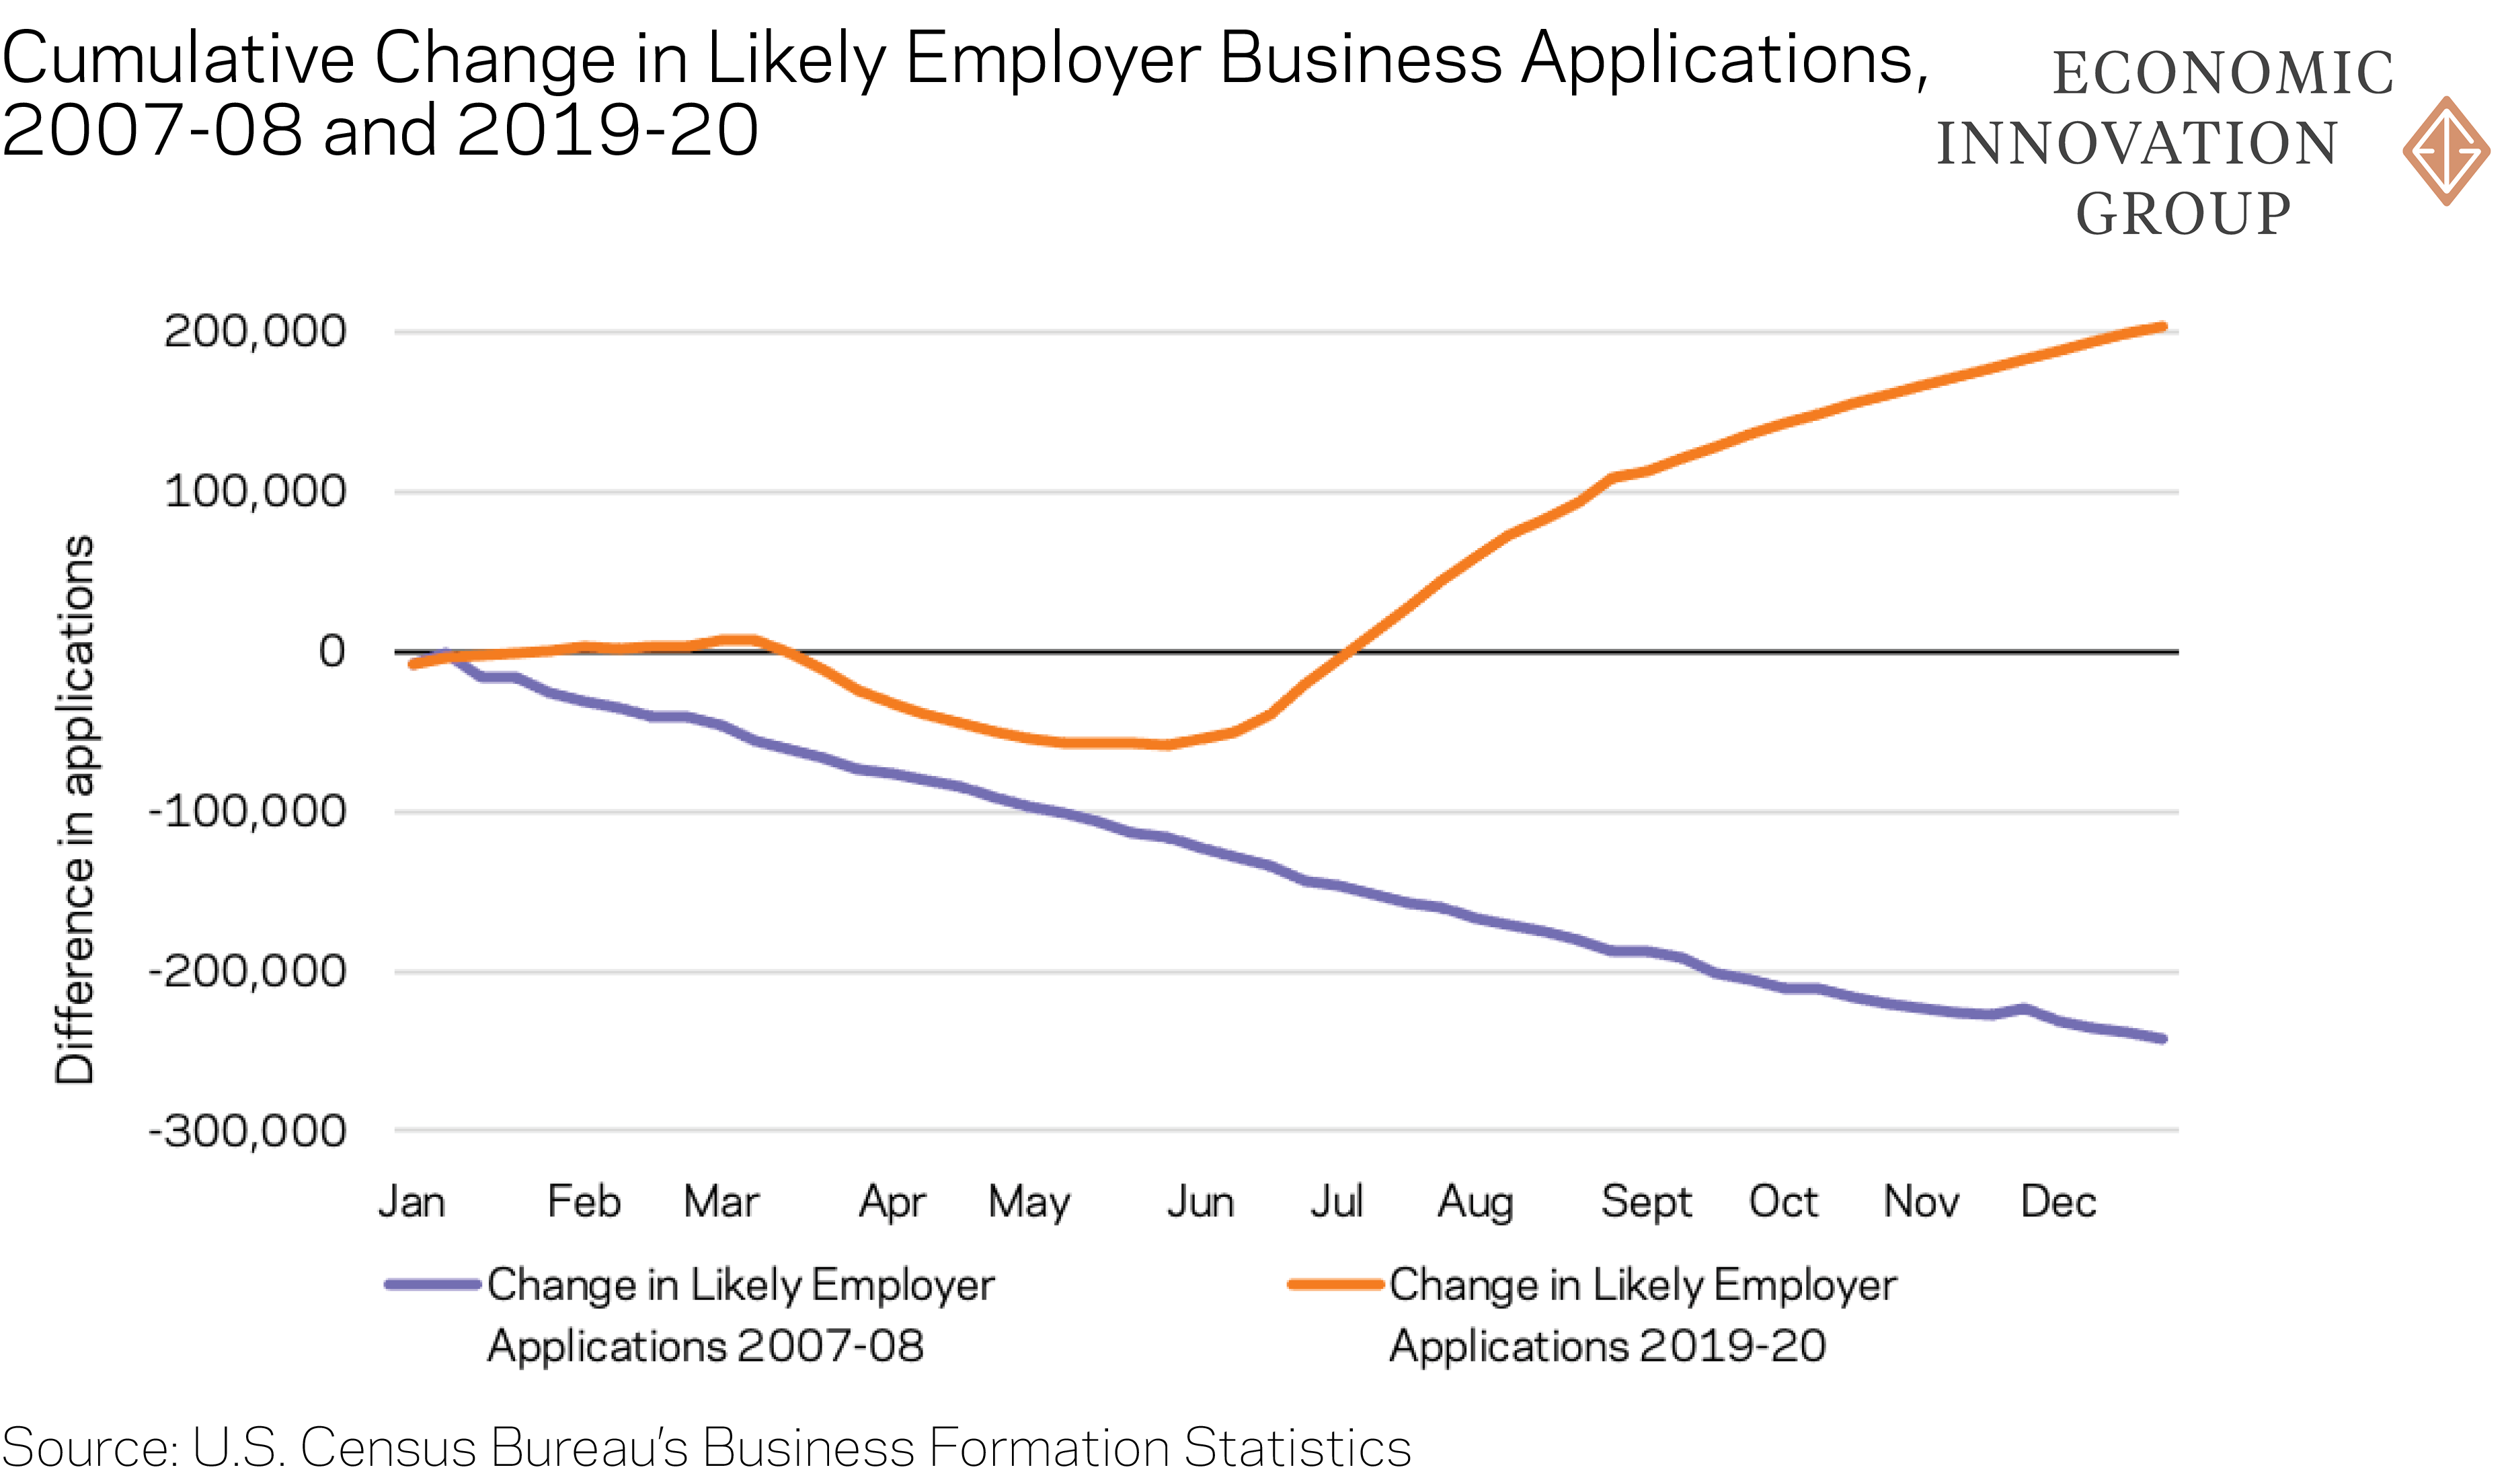
2. Following a drop-off of more than 50,000 early in the pandemic, applications from likely employers began to skyrocket in the summer months and ended the year with nearly 205,000 more than in 2019.
Although likely employer business applications ended the year up 15.5 percent above their 2019 level, this outcome was far from certain in the early weeks of the COVID-19 pandemic. Business applications suffered a large slump in the spring and early summer as COVID-19 began to shut down the U.S. economy. This sharp decline is the result of both economic and practical causes. The economic uncertainty in March and running through the early summer likely made many would-be entrepreneurs hesitant to launch a new business in such volatile times. On the practical side, many businesses and services shut down in the early days of the lockdown, perhaps preventing applicants from obtaining the necessary items to finish or submit their application. As the economy froze, business planning likely did too.
But beginning in the late summer and lasting through the end of the year, likely employer business applications fully recovered—and kept on climbing. By the end of 2020, the total number of likely employer business applications had outpaced 2019 levels each week for roughly six straight months. By the end of December, Americans filed a total of roughly 1.5 million new applications to start high-propensity businesses, which was nearly 205,000 more than in 2019. As it became clearer that the pandemic was more than a temporary dislocation, entrepreneurs seemed to gain confidence in pursuing new business opportunities.
3. This entrepreneurial boom looks nothing like what occurred after the last economic crisis.
Last year’s surge in business applications is markedly different from what occurred during the financial crisis of 2007-09. By 2008, the end of the first full year of the Great Recession, likely-employer business applications were down nearly 230,000 from their 2007 level.
In many ways, the dropoff in business formation during the Great Recession is more intuitive than what happened in 2020: Most recessions involve individuals being strapped for cash and financial markets being reluctant to provide loans, diminishing the prospects of starting a new business. Typical downturns also involve much more medium- to long-term uncertainty, whereas many expect the pandemic recovery to be relatively swift, even if the goalposts keep moving.
Other unique aspects of the current recession may help explain 2020’s unusual trend in business formation. Since this economic contraction was in response to a public health crisis (unlike the housing crash in 2007-09, for example), economic fundamentals remain strong for many industries and households, particularly those with higher incomes. The financial system has remained healthy, housing and asset prices are buoyant, and credit has continued to flow throughout the pandemic recession. The capital sources that fuel entrepreneurship and the asset bases that cushion the risk involved have been insulated from COVID-19’s economic fallout. Massive amounts of stimulus have surely helped as well.
Additional explanations may lie outside financial markets. The ever-deepening integration of technology throughout our economy and society have lowered some barriers to starting a business or choosing self-employment. COVID-19 was a social, cultural, and emotional shock the likes of which we have not experienced for generations. Becoming an entrepreneur is a deeply personal decision, and the pandemic may have delivered the push for many to embrace it.
Ultimately, though, the likely-employer numbers probably overstate the pandemic bump in entrepreneurship in magnitude, if not direction. Last year’s lower rate of business actualization—the transition of high-propensity applications into true employer businesses—will temper the year’s legacy in the total number of new businesses created.
4. Applications from retail trade businesses saw the largest jump from the prior year: up 54 percent.
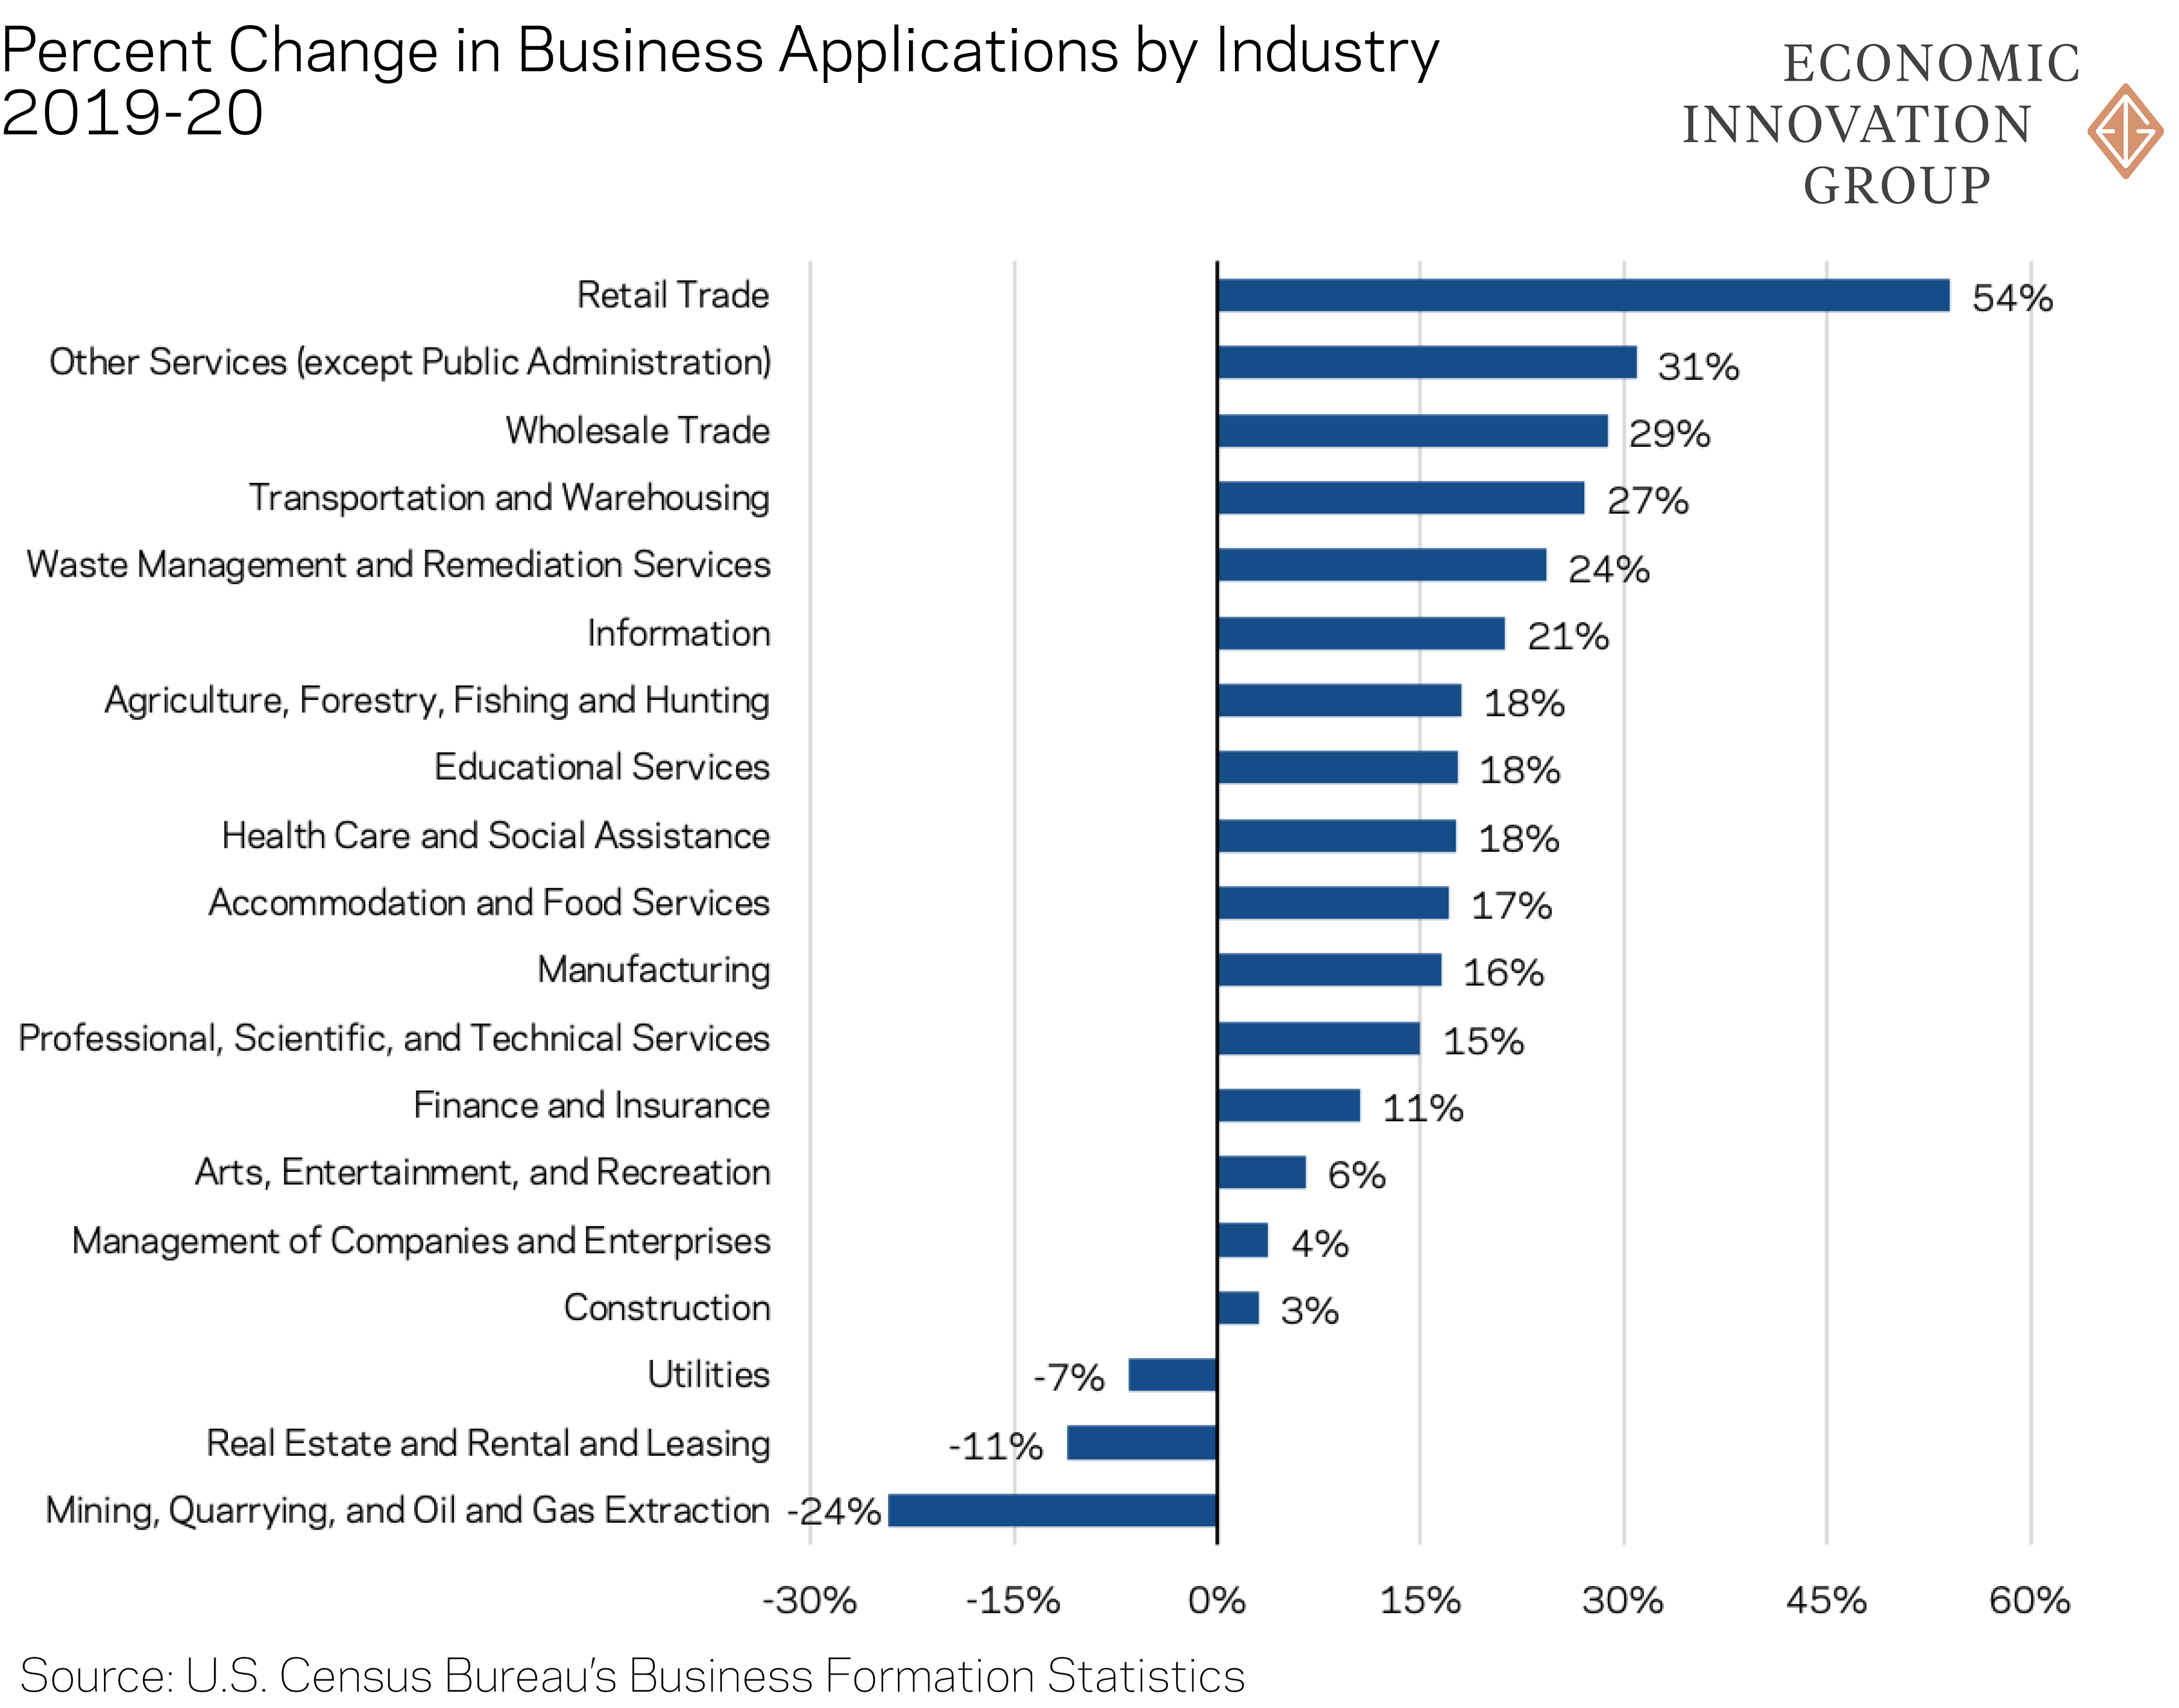
New business applications in the retail sector rose by 54 percent between 2019 and 2020, significantly more than any other industry, according to a one-time Census release of detailed industry-level data through October. This surge in retail trade was primarily driven by the subsector “non-store retail trade,” which was up 77 percent over 2019. Non-store retailers typically sell goods online or deliver them directly to their clients, and a spike in this sector is intuitive given how the pandemic has shifted consumption patterns. However, non-store retailers are overwhelmingly the types of businesses that lack paid employees: In 2018, over 90 percent of non-store retailers were non-employer businesses, according to a Census analysis.
Importantly, this spike extends to many industries beyond just retail trade, some of which may be more likely to hire employees. Of the 19 major industry sectors identified by Census, 16 of them—or 84 percent—experienced net growth in new business applications between 2019 and 2020. Moreover, 13 of the 19 (68 percent) grew by more than 10 percent. Among these other booming sectors were other services (a general category that would include personal care services and laundry services), wholesale trade, as well as transportation and trucking—which grew at 31 percent, 29 percent, and 27 percent, respectively. The growth in these sectors likely represent shifts in behavior and increased demand to service the home-based economy.
Yet the boom in entrepreneurial ferment has not extended to every industry: Business applications in the real estate sector and in the oil and gas extraction industry fell by 11 and 24 percent, respectively. Some potential drivers of these declines could be the disruption to the commercial real estate market (as central business districts emptied out and companies transitioned to remote work) as well as the fall in demand for certain energy sources resulting from reduced travel. Regardless of the precise cause, it is clear that certain sectors seem better positioned to take advantage of the economic realignment of the post-COVID economy than others.
5. Business applications in four Southeastern states grew by more than 30 percent, whereas three Pacific Northwest states experienced a net decline.
Just as the distribution of high-propensity applications was uneven across industries, it was also uneven across states. Business applications from likely employers in four Southeastern states (Alabama, Georgia, Louisiana, and Mississippi) were up the most nationwide, with each state’s growth exceeding 30 percent. Similarly, Rust Belt states—such as Ohio, Michigan, and Indiana—also saw some of the largest surges in new business applications. By contrast, states in the Pacific Northwest (Alaska, Oregon, and Washington) all recorded annual declines.
The map of 2020’s surge in new business applications presents several questions that are difficult to answer with available data (we do not have industry data by state, for example). Some normal explanations for variation, such as high population growth, don’t seem to apply to 2020’s leaders. Several states that were hit hard early by the pandemic and had some of the most stringent lockdown orders have seen a decline in new business applications (e.g., Washington), while others have boomed (e.g., Michigan). The Midwestern and Southeastern states at the crossroads of national distribution patterns could be benefiting from a pandemic boost to logistics businesses, while states with other industry specializations (e.g., Louisiana’s energy sector or Nevada’s reliance on tourism) seem to defy expectations.
Definitional issues could be at play. As mentioned above, there are a variety of factors that Census uses to identify a likely employer business. One such factor is the industry of the proposed business; in particular, all manufacturing applications are labeled as likely employers, and manufacturing is clustered in the Rust Belt and Sun Belt.
Timing effects may also explain much of the regionality of the data. For instance, during the worst of the recession (mid-April to early June), nationwide business applications were down on average by 9 percent. For states in New England and the Mid-Atlantic, the situation was particularly dire: Massachusetts, Rhode Island, New Hampshire, Connecticut, and New York led the country with a reduction in business applications of more than 15 percent during that period. Other states—including those that finished the year with the largest annual increases, such as Mississippi, Georgia, and Louisiana—experienced much more mild declines of less than 5 percent in business applications during the worst of the pandemic. Each state’s year-end growth rates must be considered within the context of the relative size of the hole from which they needed to dig out.
While the surge in new business applications is certainly promising, only time will tell how many of these expressions of entrepreneurial intent actually turn into new businesses and how many of them survive. There was almost certainly a bump in jobs-providing startups in 2020, even if the number will likely fall short of the huge surge suggested by application numbers alone due to the apparently slower rate of transition from application to real-world business.
Additional unknowns will affect how the business formation trend plays out. Many of the new entrepreneurs captured by the data may be finding opportunity in crisis, but others may be striking out on their own out of necessity. Such entrepreneurs are less likely to create the employer-firms that will fuel a rapid jobs recovery, and their businesses may disappear once the labor market returns to health and more traditional employment opportunities open up again. Despite these uncertainties in the data, one thing is clear: Sustaining this healthy bump in entrepreneurship into 2021 will be vital for placing the U.S. economy on a path to successfully recover and adapt to whatever new normal lies ahead.


