


By Daniel Newman and Kenan Fikri
Prices nationwide rose by 6.8 percent in November relative to a year earlier, the fastest pace in nearly 40 years. But even inflation — a quintessentially macroeconomic indicator — varies geographically. The cost of goods and services is increasing at different rates depending on which part of the country someone calls home. Generally, prices are rising fastest in areas that were relatively cheaper to live and work in prior to the pandemic, and rising more slowly in the country’s more expensive corners.
The latest regional Consumer Price Index (CPI) figures from the Bureau of Labor Statistics (BLS) show that prices rose the fastest from November 2020 to November 2021 in the East South Central region covering Alabama, Kentucky, Mississippi, and Tennessee (the BLS does not publish inflation figures for individual states). This region registered a 7.8 percent annual inflation rate. At the other end of the spectrum, annual inflation ran comparatively lower in the Middle Atlantic (5.9 percent) and Pacific and New England regions (6.1 percent).
a
a
A look at the recently released Regional Price Parity Index (RPP) data from the Bureau of Economic Analysis for the year 2020 shows that the map of inflation currently resembles an inverse of the map of overall relative price levels. Pacific and most Mid-Atlantic and New England states have much higher price levels than the nation as a whole, while many Southern and Heartland states register much lower price levels. Thus, today’s price increases have been most intense in some states with the lowest cost of living like Mississippi, Iowa, and Idaho, and less intense in more traditionally costly states. A stark illustration of this divergence is that Hawaii, the state with the highest cost of living, recorded among the lowest rates of inflation nationwide. Meanwhile, Mississippi, the state with the lowest relative cost of living, experienced some of the fastest price increases.
a
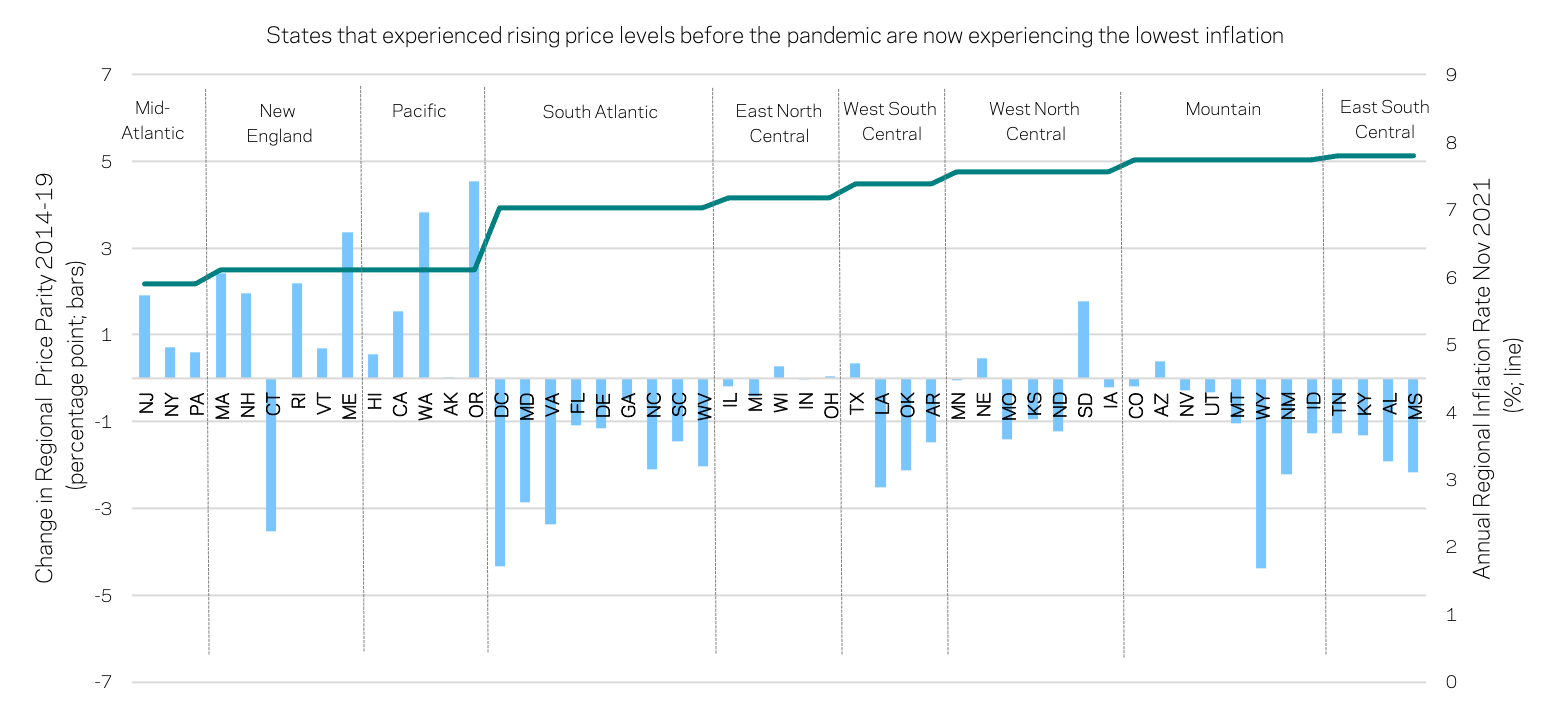
Many of today’s inflation hotspots were actually becoming more affordable relative to the country until the Covid-19 pandemic hit. This pattern might be giving those who live in these states a sense of whiplash and can be seen by comparing changes in pre-pandemic regional price parities from 2014 to 2019 to the prevailing inflation rate in November 2021. Many states in the South and Mountain West that had been growing relatively more affordable with falling RPPs have undergone a swift reversal and are located in regions now experiencing the country’s fastest price increases. Meanwhile, states such as Oregon, California, and Massachusetts, that were becoming more expensive relative to the country overall prior to the pandemic are located in regions experiencing some of the country’s lowest inflation rates today.
a
 a
a
To be sure, inflation has accelerated significantly across every region. The surge has been most dramatic in the two South Central regions, spanning Texas to Alabama. Inflation surged almost ten-fold in the East South Central region from 0.7 percent in November 2019 to 7.8 percent in November 2021 (a 7.1 percentage point increase), compared to a much more modest increase of 2.7 percent to 6.1 percent in the Pacific region (a 3.4 percentage point increase). In other words, the experienced bump in inflation has been twice as large in parts of the South as it has been on the West Coast, and inflation has surged fastest in the very regions where it was lowest just two years ago.
a
a
What explains these regional differences, and what might they mean? Many of today’s states with high-inflation experienced strong economic rebounds after the initial pandemic recession — likely due to a combination of industry mix and policy effects, like abbreviated shutdowns — and now boast very tight labor markets. Many are also home to industries disproportionately affected by price increases, such as manufacturing. Some are rural, where gasoline and other hard commodities feature strongly in the local household and business spending baskets. Some states have also seen rapid population increases drive up housing costs, especially in the Mountain West. Conversely, economies in the traditionally more expensive but currently lower inflation regions often have outsized services sectors, which have been slower to recover and still suffer from depressed demand. Their labor markets also appear to have more slack based on unemployment rates.
a
Over time, these differential rates in inflation may serve as a modest force for convergence in price levels if the gaps persist, leading those places that have consistently seen slower price increases to become — at least temporarily — slightly similar to their more expensive peers. The pandemic in general has placed a greater proportion of big city, coastal economies in a state of suspended animation, while more goods-producing, interior economies were quick to shake off the pandemic and resume their growth trajectories. Whether these differential rates of growth and price increases lead to a more lasting convergence across the country’s economic map remains to be seen. But coming hot on the heels of a decade that saw expensive coastal areas pull away from the Heartland, it’s a reversal worth noting–and watching.


