
By August Benzow
A majority of counties lost population from 2010 to 2020, while almost every county became more diverse
Based on recent Census population estimates¹, every region of the country saw slower population growth in the 2010s compared to the previous decade. All together, 54 percent of counties lost population over the 2010s, compared to 35 percent over the 2000s. The number of high population growth counties, those with more than 10 percent growth, declined dramatically from 800 in the 2000s decade to 425 in the 2010s. Although still the leader in percent growth, the Mountain West saw its average rate of population growth fall from 9.8 percent to 4.6 percent. And the Midwest and Northeast saw sluggish population growth pivot to decline: in both regions counties averaged around 1.4 percent loss in population from 2010 to 2020. While the South added more people in total than nearly all other regions combined, it still added 1.2 million fewer people than the previous decade.
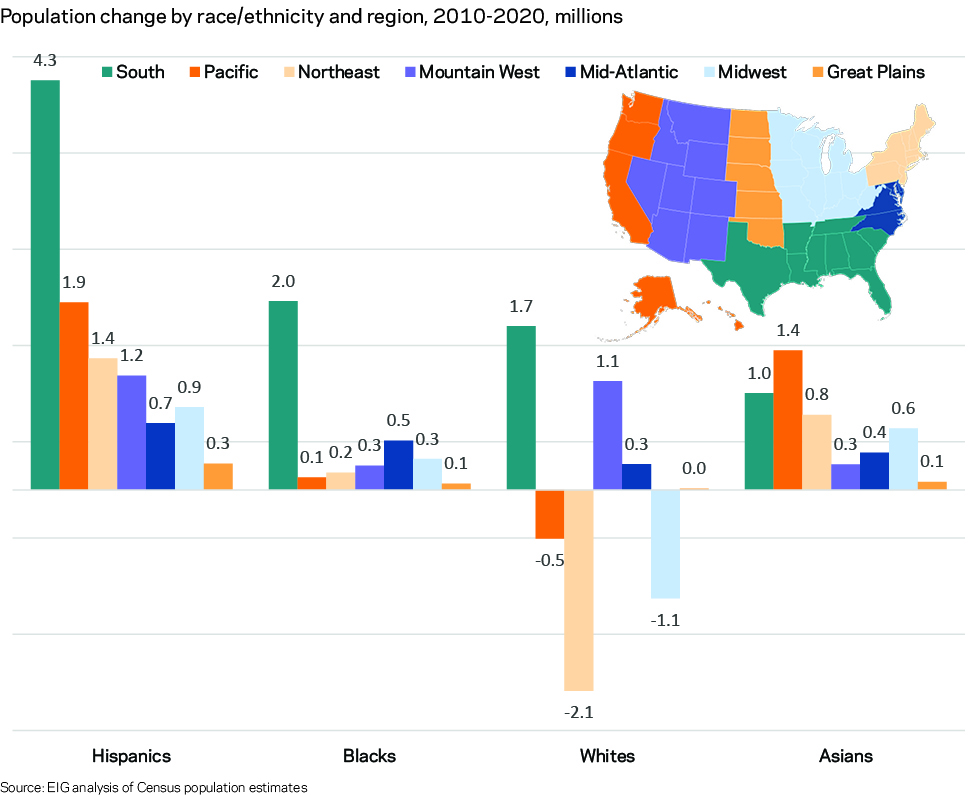
Amidst this slowdown in population growth, almost every county became more diverse, with the non-Hispanic white share of the population rising in only 130 counties, or 4 percent. Only 29 percent of counties gained white residents, while 76 percent gained Black residents and 97 percent gained Hispanic residents. Almost all counties also saw increases in Asian and Native American residents as well. From 2010 to 2020, an overwhelming majority of counties in the Northeast, Great Plains, and Midwest lost white residents, while counties in the South and Mountain West saw relatively large increases in white Americans in aggregate, even as other groups grew faster. Black Americans also flocked to the metropolitan South, but their numbers remained more stable in many of the regions that lost white residents, with notable localized exceptions. Meanwhile, Hispanic residents continued to fill in population gaps everywhere, and played a crucial role in mitigating steep population losses in the Midwest and the Northeast.
White population growth is concentrated in less diverse counties, but a majority of counties lost white residents
Nationally, it is likely that the 2010s will be the first decade with an absolute loss in the country’s white population. This national story explains the slowdown in white population growth everywhere: 46 percent of counties gained white residents in the 2000s and just 29 percent did in the 2010s. These numbers are driven by the accelerated decline in white residents in the Midwest and Northeast. The 2000s saw a 3.7 percent decrease in white residents in the Northeast and a 0.6 percent decrease in the Midwest. In the 2010s those numbers worsened to a 5.5 percent decline in the Northeast and a 2.1 percent decline in the Midwest. Just one-fifth of counties in those two regions saw an increase in white residents. Even in the Mountain West and the South, the country’s regions with the highest growth rates, a majority of counties lost white residents.
White populations tended to decrease in majority-minority counties and increase in some majority white counties: counties that were majority-minority in 2010 lost 1.7 million white residents in total, while counties that were majority white in 2010 gained 1.2 million white residents. Nonetheless, 69 percent of counties that were majority white in 2010 lost white population in the following decade. For the second decade in a row, Maricopa County, AZ (Phoenix) experienced the largest increase in white residents, its white population increasing by nearly a quarter of a million, which is more than double the next largest increase, Travis County, TX (Austin). Cook County, IL (Chicago) and Los Angeles County, CA lost the most white residents, a combined 323,000 decrease, which is an improvement over the 583,000 white residents lost by those counties in the previous decade. Just 3.3 percent of the country’s largest counties, those with a population above 200,000, saw an increase in the white share of their population.
Black population numbers are declining or stagnating in low-opportunity counties, and expanding rapidly in the suburban South
Over the last decade, Black Americans tended to move out of areas with a high cost of living (with notable exceptions like DC and Boston) or a lack of economic opportunities, both rural and urban, to more affordable areas of greater opportunity. A little more than two-thirds of rural counties in the South and Mid-Atlantic regions lost Black population for a combined population loss of 138,900. In the Midwest and the Northeast large urban counties like Cook County, IL (Chicago), Wayne County, MI (Detroit) and Kings County, NY (Brooklyn) reported the biggest losses of Black residents, their combined Black populations decreasing by nearly a quarter million. Smaller counties in those regions, like Baltimore, MD and St. Louis, MO also saw steep declines in Black residents, the latter county losing 15 percent of its Black population over the decade.
The population of Black Americans surged in metropolitan Southern counties and more prosperous urban areas, like Minneapolis and Indianapolis. The rural population of Black Americans grew the fastest in the Pacific and Mountain West, but the Northeast, Midwest, Great Plains also saw modest increases in the number of Black residents. Among urban counties, Franklin County, OH (Columbus) is a rare example of a county outside the Sunbelt that posted healthy gains in both Black and white residents. Suburban counties outside of urban areas that lost Black population also saw robust growth, such as Delaware County, PA (Philadelphia) and Macomb County, MI (Detroit). In the South, Harris County, TX (Houston) had the highest growth in Black population nationwide, and is poised to pull even with Chicago’s Black population in the next decade, an astonishing transformation for a county that had less than half the Black population of Chicago 20 years ago. The Atlanta metro is another powerhouse for Black population growth. Gwinnett County, GA had five times more white residents than Black residents in 2000 and just 1.2 times more in 2020 with the county on track to have more Black residents than white residents by 2030 if trends persist.
Hispanics are seeing the biggest population increases in the South but are also growing in counties that are seeing steep losses in every other demographic
Across all counties, Hispanics saw a population increase of 10.6 million, notably less than the 15.1 million increase in the previous decade, but more than double the growth of the next fastest growing group, Asian Americans. Nearly half of this growth in Hispanic populations was in Southern counties, but more than 90 percent of counties in every region gained Hispanic residents. An expanding Hispanic population prevented outright population loss in 307 counties nationwide, including large counties like Los Angeles, Miami, and Philadelphia. However, Hispanic population growth slowed significantly from the previous decade for every region. In the South, for example, the Hispanic population growth rate fell from 51.4 percent in the 2000s to 26.9 percent in the 2010s. The county with the highest Hispanic growth, Harris County, TX (Houston), added 396,100 Hispanics in the 2010s compared to 547,100 in the decade prior. Marion County, IN (Indianapolis) saw its Hispanic population growth fall from 50,400 in the 2000s to 21,900 in the 2010s.
Just 92 counties lost Hispanic population in the 2010s decade, notably fewer than the 164 that lost Hispanic residents in the 2000s. Nearly half of all these counties were in New Mexico or Texas. The largest absolute decrease in Hispanic residents was in Kings County, NY (Brooklyn), followed by Santa Clara County and San Mateo County, CA, suggesting a pattern of expensive housing markets driving population shifts. Contrary to this expectation though, New York County, NY (Manhattan) saw its Hispanic population increase by 7,800 after a 16,200 decrease in the 2000s and Arlington County, VA gained 5,400 Hispanic residents, a reversal of a 3,600 loss in the previous decade.
Conclusion
Demographic trends of the last decade show an America that has become more diverse almost everywhere, while also revealing widespread population loss. The trends described here are in many ways a deepening of trends seen in previous decades with a dwindling number of high growth counties capturing the lion’s share of the country’s population growth, while an ever-increasing number of counties see stagnant or declining populations. Growth in Black and Hispanic populations have helped to prevent even greater declines in many counties, but it is abundantly clear that the current combination of low rates of natural population increase and low levels of immigration will not suffice to reverse the broader trends. Even with the growth in remote work practices, which make lower cost and potentially less populated areas more appealing, there is unlikely to be a population resurgence in most counties that are in the red. More impactful policy interventions, such as Heartland Visas, that propose a reimagined immigration pipeline that directly targets these areas and other policies that recognize the unique challenges facing legacy cities and depopulating rural areas are badly needed if the next decade is going to follow a different trajectory.
¹: These estimates are based on the 2010 Census and were created without incorporation or consideration of the 2020 Census results. While these estimates are useful for assessing demographic changes over the decade, they will differ from final 2020 census numbers.