By Kennedy O’Dell
Key Findings
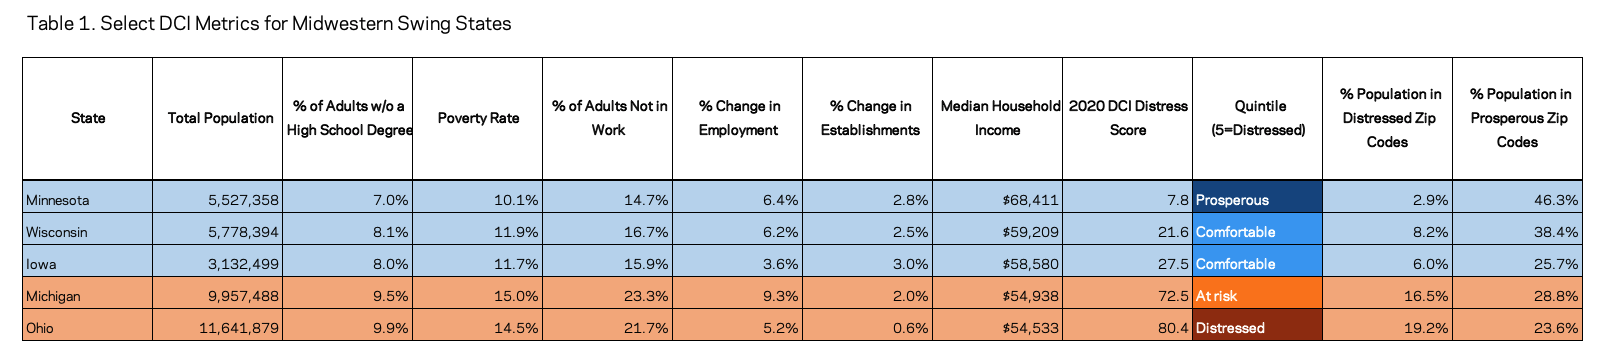
- Stark differences in economic well-being divide Midwestern swing states into two distinct clubs: the largely prosperous trio of Minnesota, Wisconsin, and Iowa and the more distressed duo of Michigan and Ohio.
- The well-off state with the highest share of its population residing in economically distressed zip codes is Wisconsin, at 8.2 percent. That is less than half of the share of residents living in similar zip codes in Michigan (16.5 percent), the better off of the two distressed states, and an 11 percent smaller share than Ohio (19.2 percent).
- The gaps between clubs are evident in median household income (MHI) as well, with a nearly $14,000 deficit between the average MHI in the most distressed state, Ohio, and the average MHI in the most well-off Midwestern swing state, Minnesota.
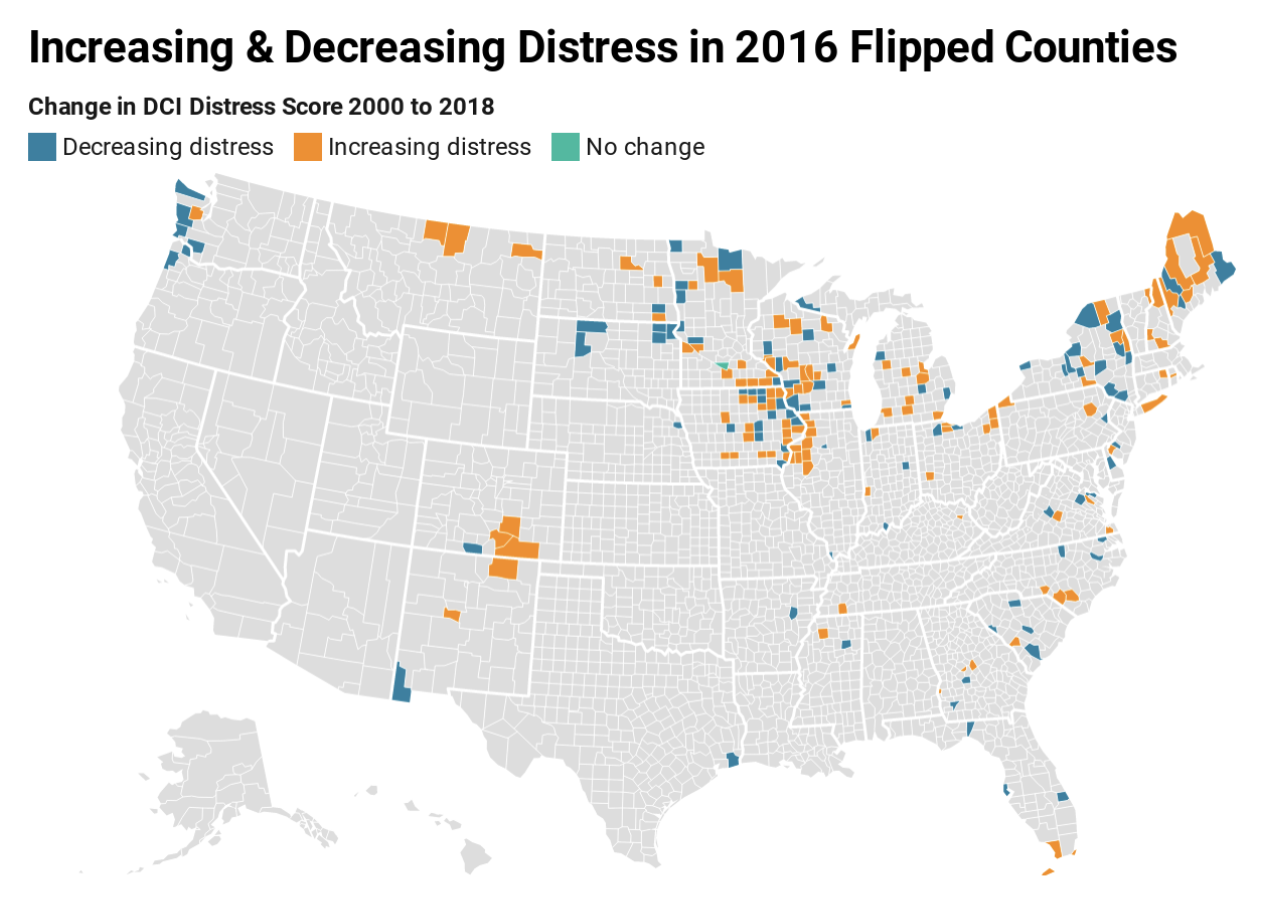
- Among the critical flipped counties in Midwestern swing states that voted for Obama in 2008 and 2012 before going for Trump in 2016, 61 percent are in relative economic decline, while nearly all the rest have increased their economic well-being since 2000.
- Across four of the five states, flipped counties were more likely to experience job growth than the typical county nationally from 2014 to 2018. However, more recently from the first quarter of 2018 to the first quarter of 2020, far fewer flipped counties added jobs than typical nationally across all the region’s swing states except Minnesota. In Iowa, four out of five lost jobs, compared to under half nationally.
- Racial disadvantage cuts across the two clubs—in Wisconsin, Ohio, and Michigan, less than 15 percent of white residents live in distressed zip codes compared with over half of Black residents. Minnesota has the lowest share of Black residents living in a distressed zip code, 12.2 percent.
Introduction
The Great Lakes region, the Rust Belt, the path to victory—the upper Midwest has no shortage of monikers for the final days of an election cycle. Yet, while the swing states of Ohio, Minnesota, Wisconsin, Iowa, and Michigan that comprise the region are geographically and culturally close, they are extremely heterogeneous in terms of economic well-being.
EIG’s Distressed Communities Index (DCI) sheds light on two clubs of Midwestern swing states: the largely affluent trio of Minnesota, Wisconsin, and Iowa and the more distressed duo of Michigan and Ohio. For example, 38.5 percent of Ohioans live in distressed or at risk zip codes while just 12.4 percent of Minnesotans live in similarly performing communities. The “two-club” framework has held up throughout the pandemic, as the initially better off states have outperformed the country and experienced markedly shallower recessions than their regional peers.
This analysis uses the DCI from two time periods, 1996-2000 and 2014-2018, along with more recent data to explain the economic circumstances across Midwestern swing states and, crucially, the swing counties within them that tipped the 2016 election and may very well do the same in 2020. It deliberately takes a step back from the horse race to differentiate between parts of the region that are in long-term decline and parts that enjoy stable or even rising levels of economic well-being compared to the rest of the nation.
The DCI provides a methodology for comparing economic well-being across geographies. Here we apply it to states and counties, respectively, and score them on seven different metrics. We then rank them, place them into percentiles, and group them and their peers into five distinct quintiles, or tiers, of well-being: prosperous, comfortable, mid-tier, at risk, or distressed.
Flipped counties in swing states
Nationally, there are 207 counties that voted for Obama in both 2008 and 2012 and Trump in the 2016, so-called “flipped” counties. Forty-five percent of these are in the five Great Lakes states analyzed here. Interestingly, the average flipped county in a Midwestern swing state is better off than the average flipped county nationwide, as indicated by state average distress scores that are lower than the national average for all flipped counties. While some flipped counties are small, margins matter; in 2016, three of the five Midwestern swing states were won by less than two percentage points. These counties give a sense of where exactly political and economic shifts may be occurring in a country that is increasingly divided along lines of where and how we live and work.
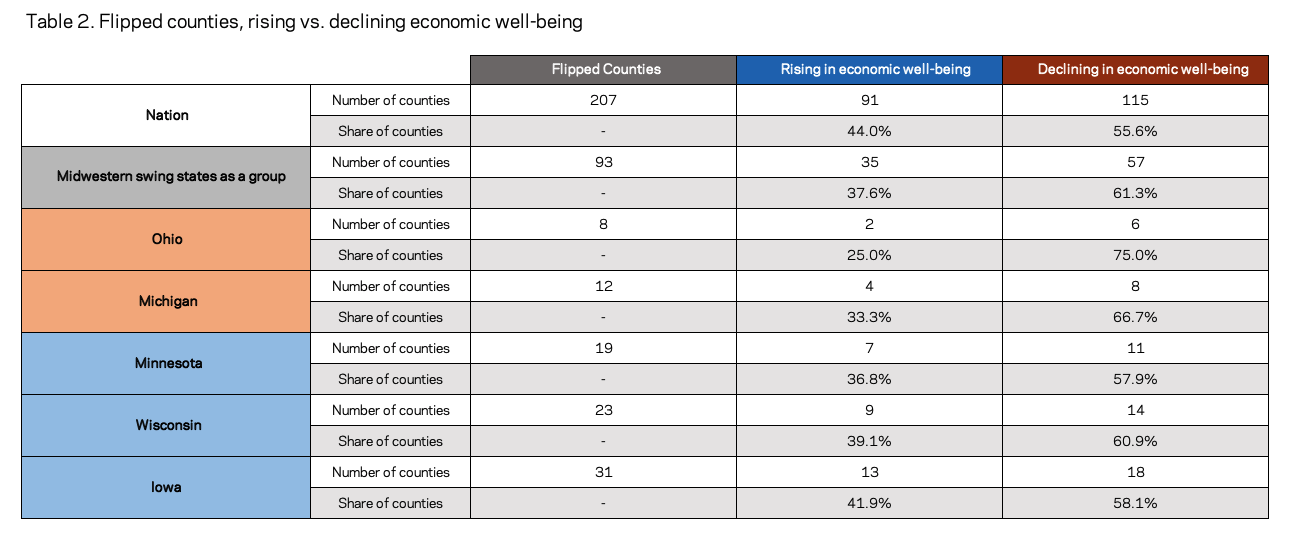
After the 2016 election, the conventional wisdom maintained that Trump won the Rust Belt by claiming the votes of those displaced by economic change and resentful of their communities’ economic decline. The DCI adds to the growing evidence that this narrative is incomplete at best. Nationwide, comparative economic well-being has deteriorated in 56 percent of flipped counties since the turn of the century. Across the five Midwestern states in this analysis, 61 percent of flipped counties home to a commensurate share of the total flipped county population in the region are in relative decline. That still leaves nearly two of every five flipped counties that are improving in economic well-being relative to the rest of the country.
And yet, the narrative of decline is a better fit in some parts of the region and the region as a whole since 2000, as Ashtabula County, OH, and the state of Ohio generally can attest. Ohio is the state among the five considered here that went most strongly to the Trump column in 2016, and it declined far more steeply in measures of economic well-being than its peers.

In the group of Midwestern swing states, an outsized share of flipped counties lost population from 2000 to 2019. More than half of flipped counties across the country experienced population loss compared to 42.4 percent of all counties. Only Wisconsin had a smaller share of flipped counties experiencing population decline than the nation as a whole. Population loss across flipped counties from 2000 to 2019 was common in both Iowa and Ohio. In terms of employment, flipped counties across four of the five states were more likely to be adding jobs than the typical county nationally from 2014 to 2018, but that pattern has inverted over the past two years. From the first quarter of 2018 to the first quarter of 2020, far fewer flipped counties were growing than typical nationally across all the region’s swing states except Minnesota. In Iowa, four out of five lost jobs, compared to under 50 percent nationally.
While Ohio as a state is considered distressed, its flipped counties have a lower average distress score than the state average. This is also true in Iowa. In Michigan, Minnesota, and Wisconsin, by contrast, flipped counties have higher average distress scores than the state average. It thus appears that in some states, areas more affluent than their neighbors moved towards the president while in others, a higher-than-state-average degree of economic distress characterized those places that flipped for Trump. Within states, this broader trend took on even more nuance as the state profiles below detail.
In some states, areas more affluent than their neighbors moved towards the president while in others, a higher-than-state-average degree of economic distress characterized those places that flipped for Trump.
Better understanding how and why the economic well-being of these states and their critical flipped counties has changed over time can provide insight into the lived experiences voters are carrying with them to the polls this November. Beyond asking a voter simply where they are from, this analysis goes a step further to ask a critical extension of that question: what kind of economy are they from?
Distressed, Larger Population States
Ohio
Ohio is the worst-off among the region’s swing states and has experienced significant relative economic decline at the state level since the turn of the century. In 2000, the state fell into the at risk quintile nationally; by 2018, it was considered outright distressed. In Ohio, 19.2 percent of people live in a distressed zip code, but that number breaks down starkly along racial lines. 13.6 percent of Ohio’s non-Hispanic white population live in a distressed zip code compared with over half of Black Ohioans. The most populous of the five states, it nevertheless remains home to substantial pockets of local prosperity (23.6 percent of its population reside in a prosperous zip code). In the 2016 presidential election, Trump won Ohio by over 8 points but in 2018, Democratic Senator Sherrod Brown defeated his Republican challenger by nearly 7 points.
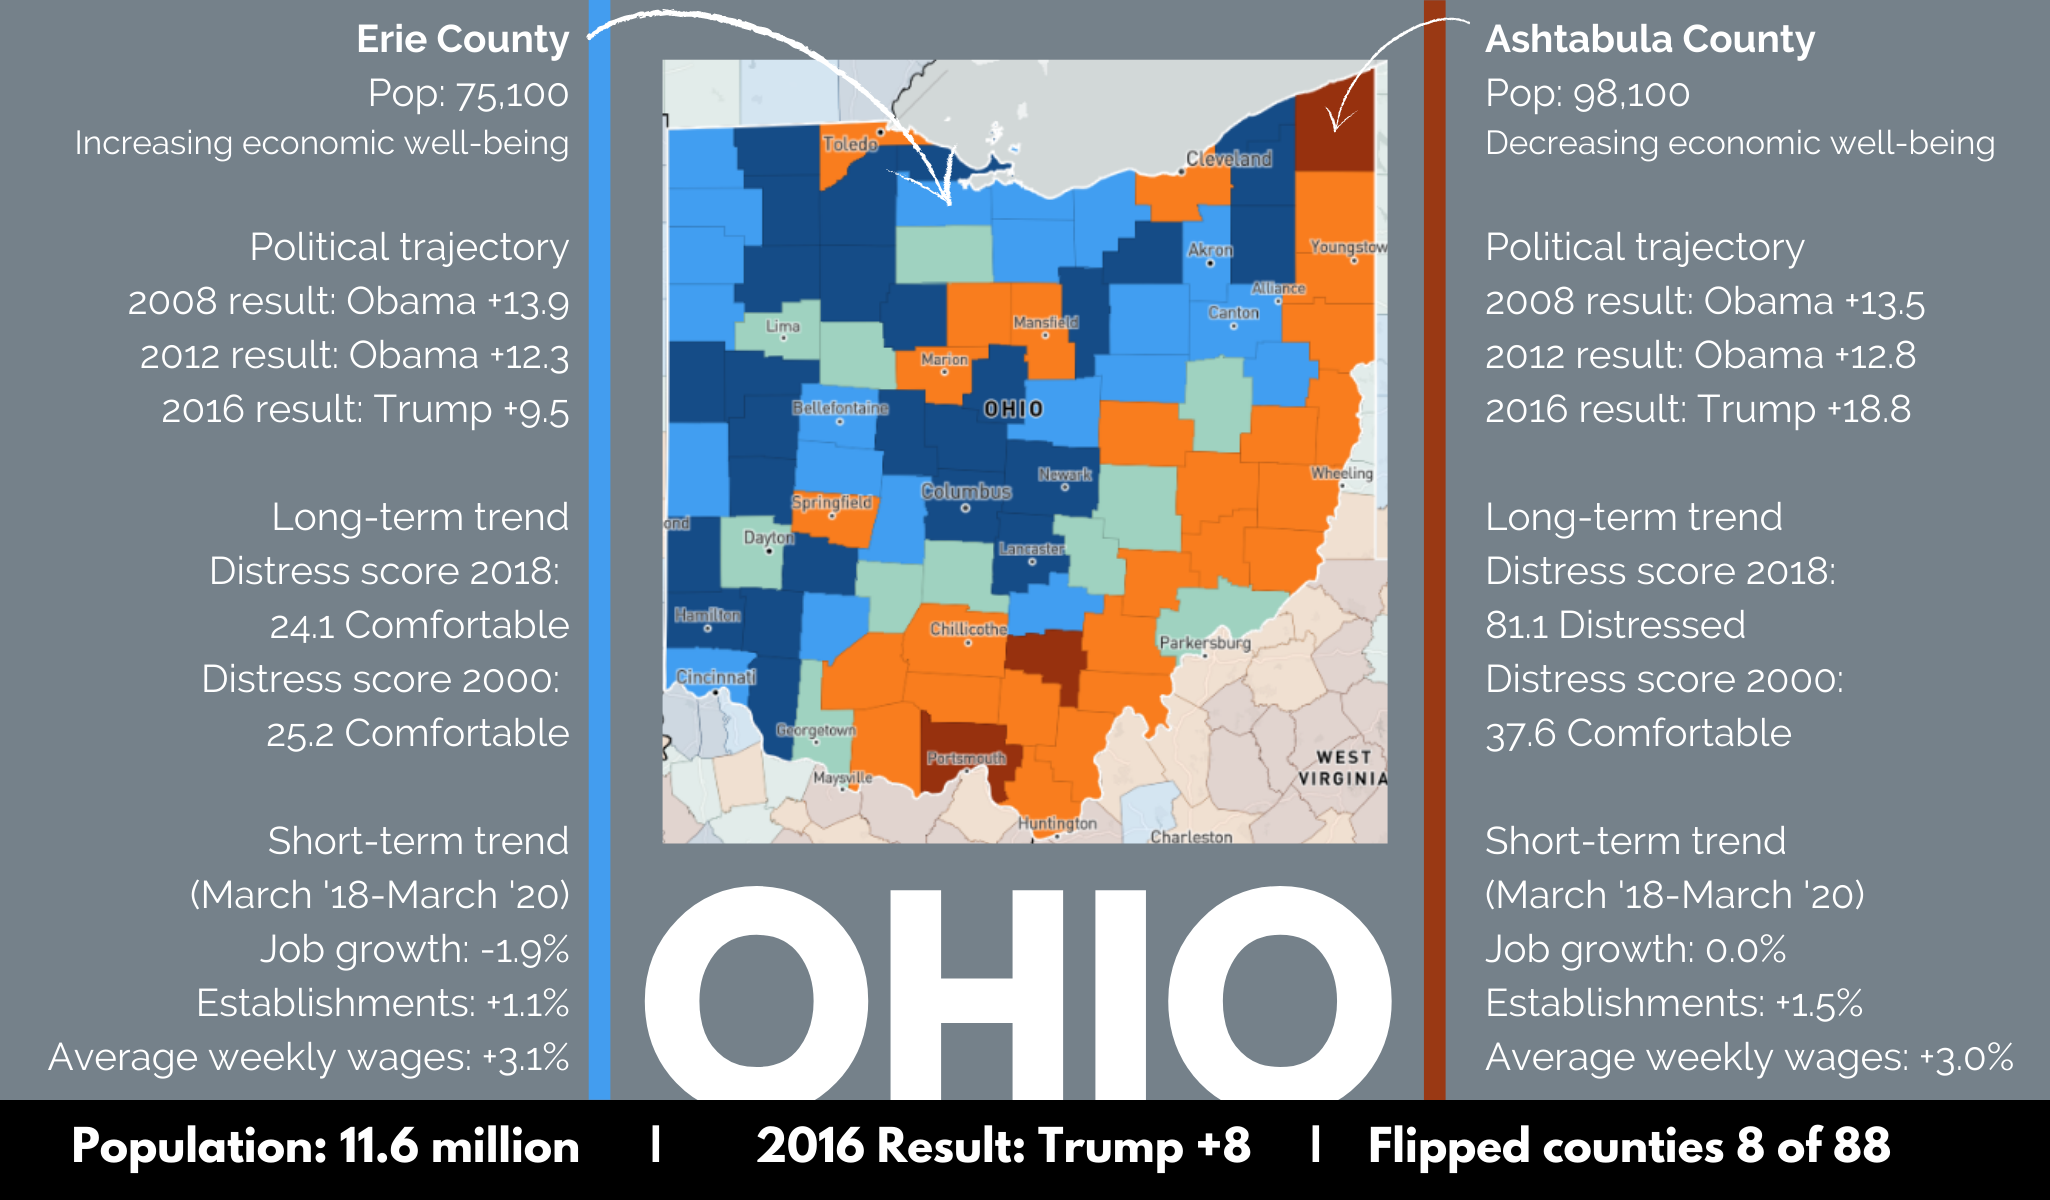
Homing in on the eight Ohio counties that flipped from Obama to Trump, two stand out for particularly poor and relatively strong economic performance, respectively. The bottom seemingly fell out of the economy in Ashtabula County in northeast Ohio. In 2000, the county sat in the comfortable quintile. By 2018, the poverty rate climbed to 20.3 percent, nearly a third of prime age adults were not in work (33.0 percent), and the county was firmly distressed. The county’s workforce was not in a strong position to weather the decline of manufacturing in the area, as well over 50% of the county’s population possessed a high school degree or less. Ashtabula County lost both business establishments and jobs from 2014 to 2018. Since then, the county has only seen a small increase in establishments and no net job growth from 2018 to the first quarter of 2020. Ashtabula’s drop from the comfortable to distressed quintile was the second steepest economic collapse of any flipped county in the country and the ninth steepest drop of any county in the country.
13.6 percent of Ohio’s non-Hispanic white population live in a distressed zip code compared with over half of Black Ohioans.
On the opposite end of the spectrum is Erie County, home to Sandusky and the iconic amusement park, Cedar Point. From 2000 to 2018, Erie County maintained its position in the comfortable quintile—a rare feat among the flipped counties in the state. Fifteen percent of the labor force in the county is employed in the arts, entertainment, and recreation plus food and accommodation sectors collectively, compared with 9.1 percent statewide—meaning the county is particularly exposed to the industries hit hardest by the virus. Whether the nation’s pandemic response is on the ballot in November remains to be seen.
Michigan
Michigan fell from mid-tier to at risk between the two periods in question. A rural-urban divide exists in prosperity across Michigan: the average distress score for an urban Michigan zip code is nearly 30 points higher, or a quintile and half more distressed, than the rural average. Racial stratification of distress similar to that observed in Ohio is also clearly visible. 57.4 percent of Black residents in Michigan live in a distressed zip code compared with 8.6 percent of white residents. The state had the largest increase in employment in terms of percentage share of all the Midwestern swing states, increasing employment by an impressive 9.3% from 2014 to 2018. Since then employment growth has flatlined, actually decreasing by -0.2% from the first quarter of 2018 to the first quarter of 2020. Relative to one year prior, employment was down 9.6 percent in the state in September, tied for the third worst decline nationally.

The 2016 presidential election saw 12 counties flip their preferred party in Michigan. Relative to some other Midwestern swing states, Michigan’s flipped counties are quite populous. While only 14.5 percent of counties were flipped counties, those counties contain 18.3 percent of Michigan’s population. Nearly half of Michigan’s swing county population is located in Macomb County alone.
In a quintessential example of prosperity’s tendency to reinforce itself, Macomb County improved its position within the prosperous tier of counties nationwide from 2000 to 2018. Macomb has the highest number of Black residents and the second highest share of Black residents of any flipped county in Michigan. Unlike most other flipped counties in Michigan, Macomb County saw robust employment growth and stronger establishment growth than nearly three quarters of Michigan counties. It is the most populous flipped county in the region and the only one of its size to have swung to Trump in 2016 after voting for Obama in 2012. Macomb County embodied a larger trend in the state in which Clinton failed to achieve Obama’s 2012 margins in areas with large concentrations of Black residents.
In a quintessential example of prosperity’s tendency to reinforce itself, Macomb County improved its position within the prosperous tier of counties nationwide from 2000 to 2018.
While Macomb County prospered, the second most populous flipped county in the state, Saginaw County, declined, falling from mid-tier to at risk from 2000 to 2018 due rising poverty and reduced prime age employment rates. The county has a higher share of Black residents, 18 percent, compared to more populous Macomb and is far and away the most diverse flipped county in Michigan. From 2014 to 2020, Saginaw’s economy moved in fits and starts, with business establishments decreasing through 2018 even as employment grew. More recently, business establishment growth has been easier to come by, but employment has lost steam. Economic security was not the only thing the county lost—the population declined by 9.3 percent between 2000 and 2019. Trump’s victory was slim in Saginaw: the mere one point win was the narrowest margin of any county that ultimately broke for him in the state.
Well-off, Smaller Population Swing States
Minnesota
A member of the club of well-off Midwestern swing states, Minnesota is the fourth most prosperous state in the country and the best-educated Midwestern swing state. The Twin Cities are its primary engines of prosperity, and the sea of well-being across the state makes the few distressed zip codes, many concentrated in and around Minnesota’s reservations, stand out even more starkly. While prosperity reigns in much of the state, some groups do better than others. In a reversal of national trends, foreign born residents are more likely to live in a distressed zip code than native born residents. While racial gaps in well-being still exist—12.2 percent of Black Minnesotans live in distressed zip codes compared to 5.6 percent of Hispanic or Latino residents and 1.6 percent of white residents—the plurality of Blacks, Latinos, and Asians live in prosperous zip codes. In 2016, the state narrowly broke for Clinton by less than 2 points. In 2018, Democrats won both U.S. Senate seats and the governor’s mansion by hefty margins.
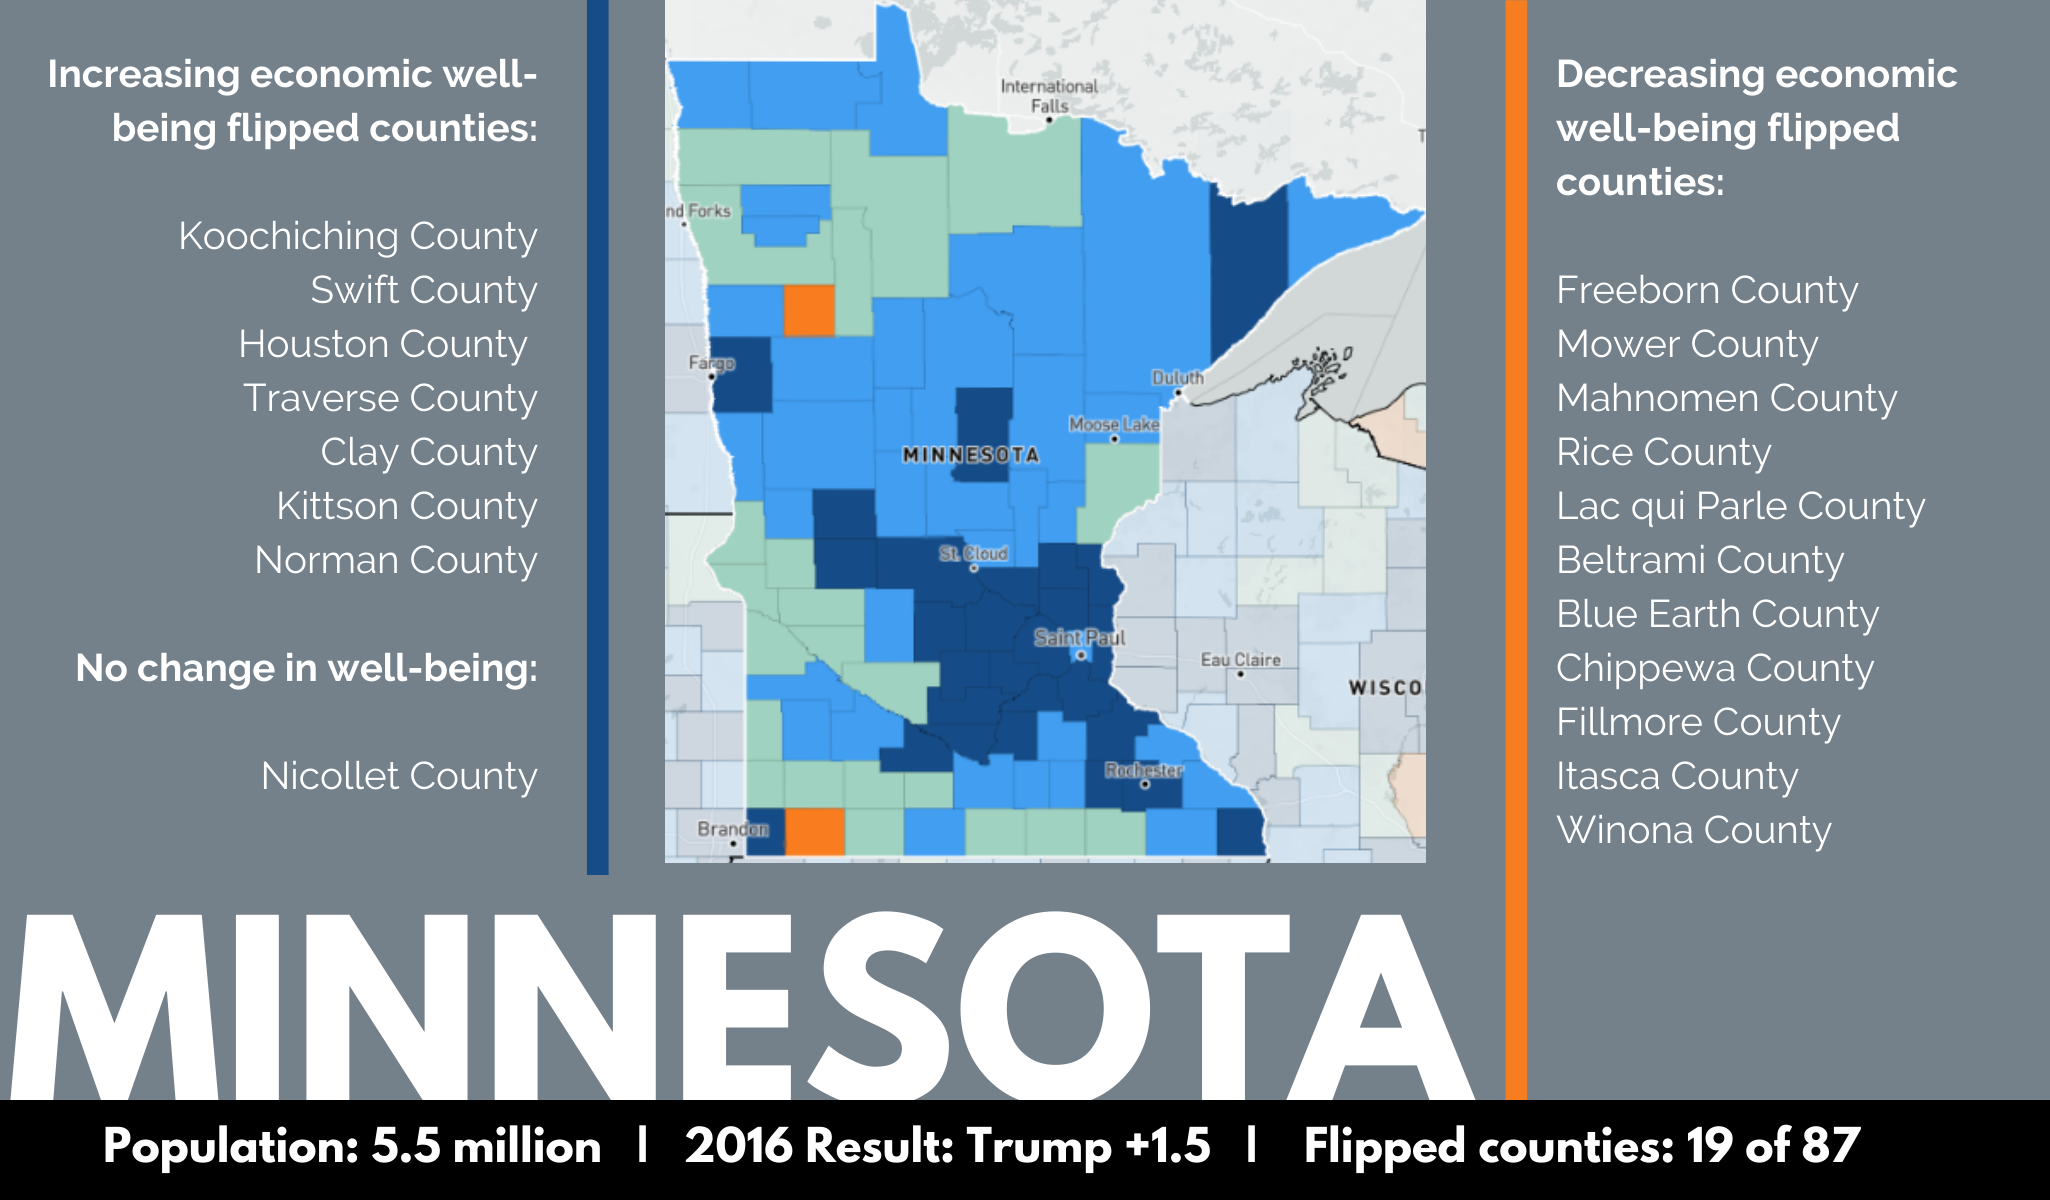
Minnesota had 19 flipped counties, although unlike other states, no county that switched parties with its presidential vote had a population greater than 70,000. While 21.8 percent of Minnesota’s counties flipped, they contained only 9.8 percent of the state’s population. These small switching counties had heterogeneous experiences of the first two decades of the century. Eleven of the nineteen flipped counties saw their distress scores deteriorate, although high initial well-being meant that no flipped county fell into the distressed quintile, and only one fell into the at risk quintile. The remaining flipped counties enjoyed stable or rising relative well-being.
Wisconsin
Wisconsin is the second most prosperous of the Midwestern swing states and lands in the comfortable quintile nationally. Its economic well-being has been stable relative to its peers since 2000. Milwaukee County, the state’s most populous, mixes distressed urban with prosperous suburban neighborhoods and itself lands in the mid-tier quintile. Like Minnesota, no county is distressed and only two are considered at risk. Unlike Minnesota where prosperity is more widely enjoyed, racial stratification is stark in the state. One in four Latinos in Wisconsin lives in a distressed zip code, compared to 3.0 percent of white residents and 56.8 percent of Black Wisconsin residents. Trump won Wisconsin by less than a full percentage point in 2016.
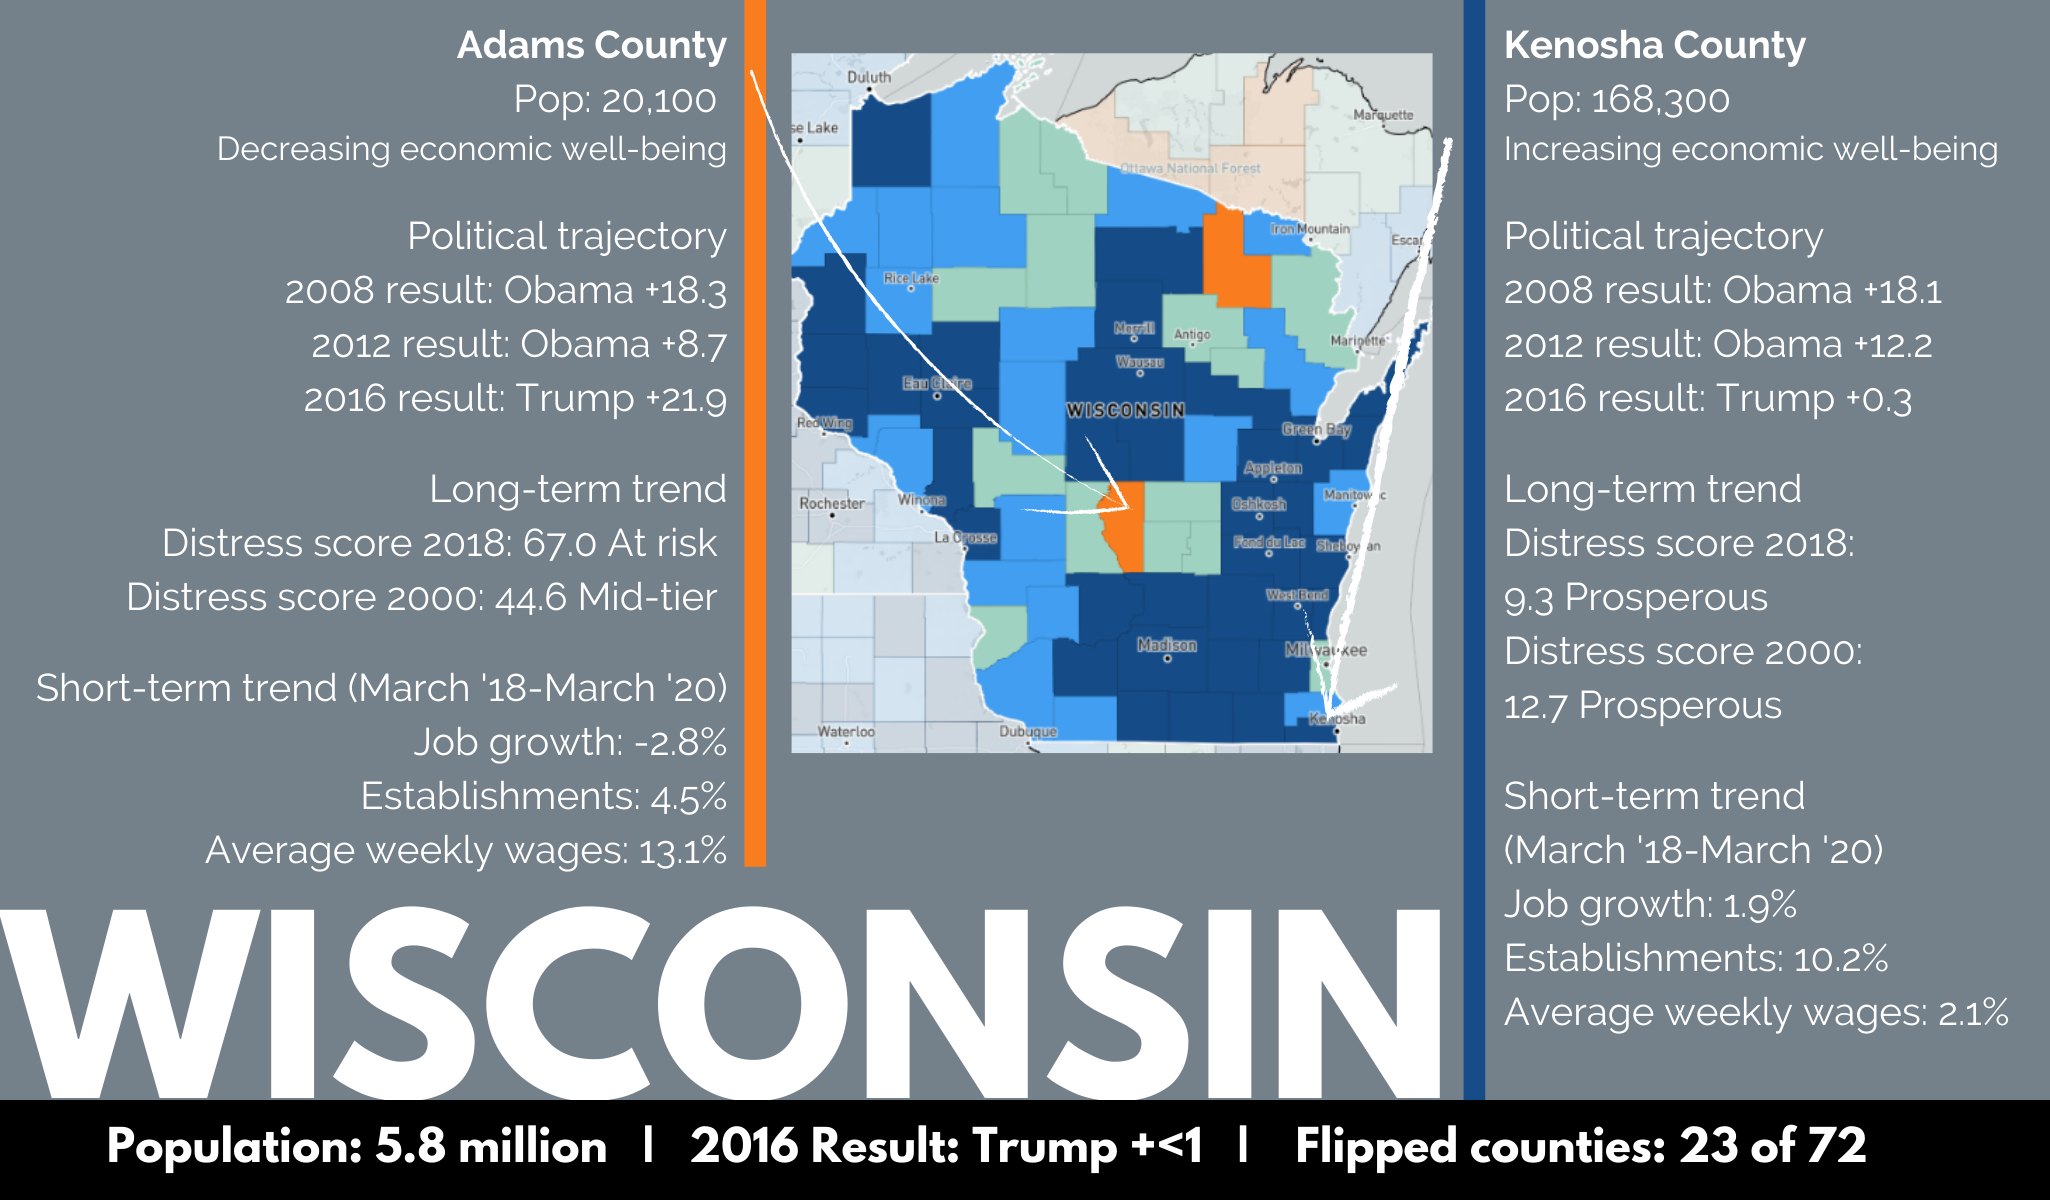
In Wisconsin, there were 23 flipped counties in the 2016 presidential election, roughly 40 percent of which improved on the index and 60 percent of which declined in relative economic well-being. Adams County is a relatively small county indicative of the 14 counties that were downwardly mobile in Wisconsin since 2000, although its place in the at risk tier makes it more worse off than all but one other county in the state. It stands out distinctly in the sea of prosperity that covers much of the state.
Unlike Minnesota where prosperity is more widely enjoyed, racial stratification in Wisconsin is stark.
Kenosha County, the Wisconsin slice of the Chicago metro area, was the third most populous flipped county in the state and a recent flashpoint in the nation’s ongoing reckoning with racial justice following the police shooting of Jacob Blake. Kenosha County was a prosperous county in 2000 and has reinforced that prosperity over the first two decades of the century thanks to an employment boom—employment increased by 25.8 percent from 2014 to 2018 alone—and a related decline in the share of prime age adults outside the labor force. The median household income is higher than the Chicago area average, and from 2014 to 2018, it saw a 7.3 percent increase in business establishments. However, Kenosha is home to serious poverty in spite of recent growth. The county’s relatively high poverty rate falls into the worst quarter of counties in Wisconsin and is also the county with the fourth highest poverty rate in the Chicago metro area. Only 10 percent of the county’s non-Hispanic white population sits below the federal poverty line compared to 33 percent of the county’s Black population. While the divides are profound, Kenosha County remains a prosperous place to live for many, with over 45 percent of its residents residing in a prosperous zip code.
Iowa
Iowa is the third most prosperous Midwestern swing state and the final member of the well-off club. Iowa is firmly in the comfortable tier of states nationwide, with five counties considered at risk and one distressed. Iowa has been upwardly mobile since 2000, rising in the ranks from the 18th to the 14th most well-off state in the country. But from 2018 to the first quarter of 2020, employment levels have actually declined slightly. Business establishment numbers looked more promising, growing by 3.0 percent from 2014 to 2018 and remaining positive through the first quarter of 2020. Iowa is the only swing state in the group of five to have added more business establishments from 2014 to 2018 than it did from 1996 to 2000. At 86.1 percent white, Iowa is the least diverse Midwestern swing state. Interestingly, a higher share of residents have a bachelor’s degree in distressed Ohio than in comfortable Iowa. Despite this educational attainment gap, the median household income in Iowa is $4,000 higher than in Ohio. In 2016, Trump won Iowa by over 9 points.
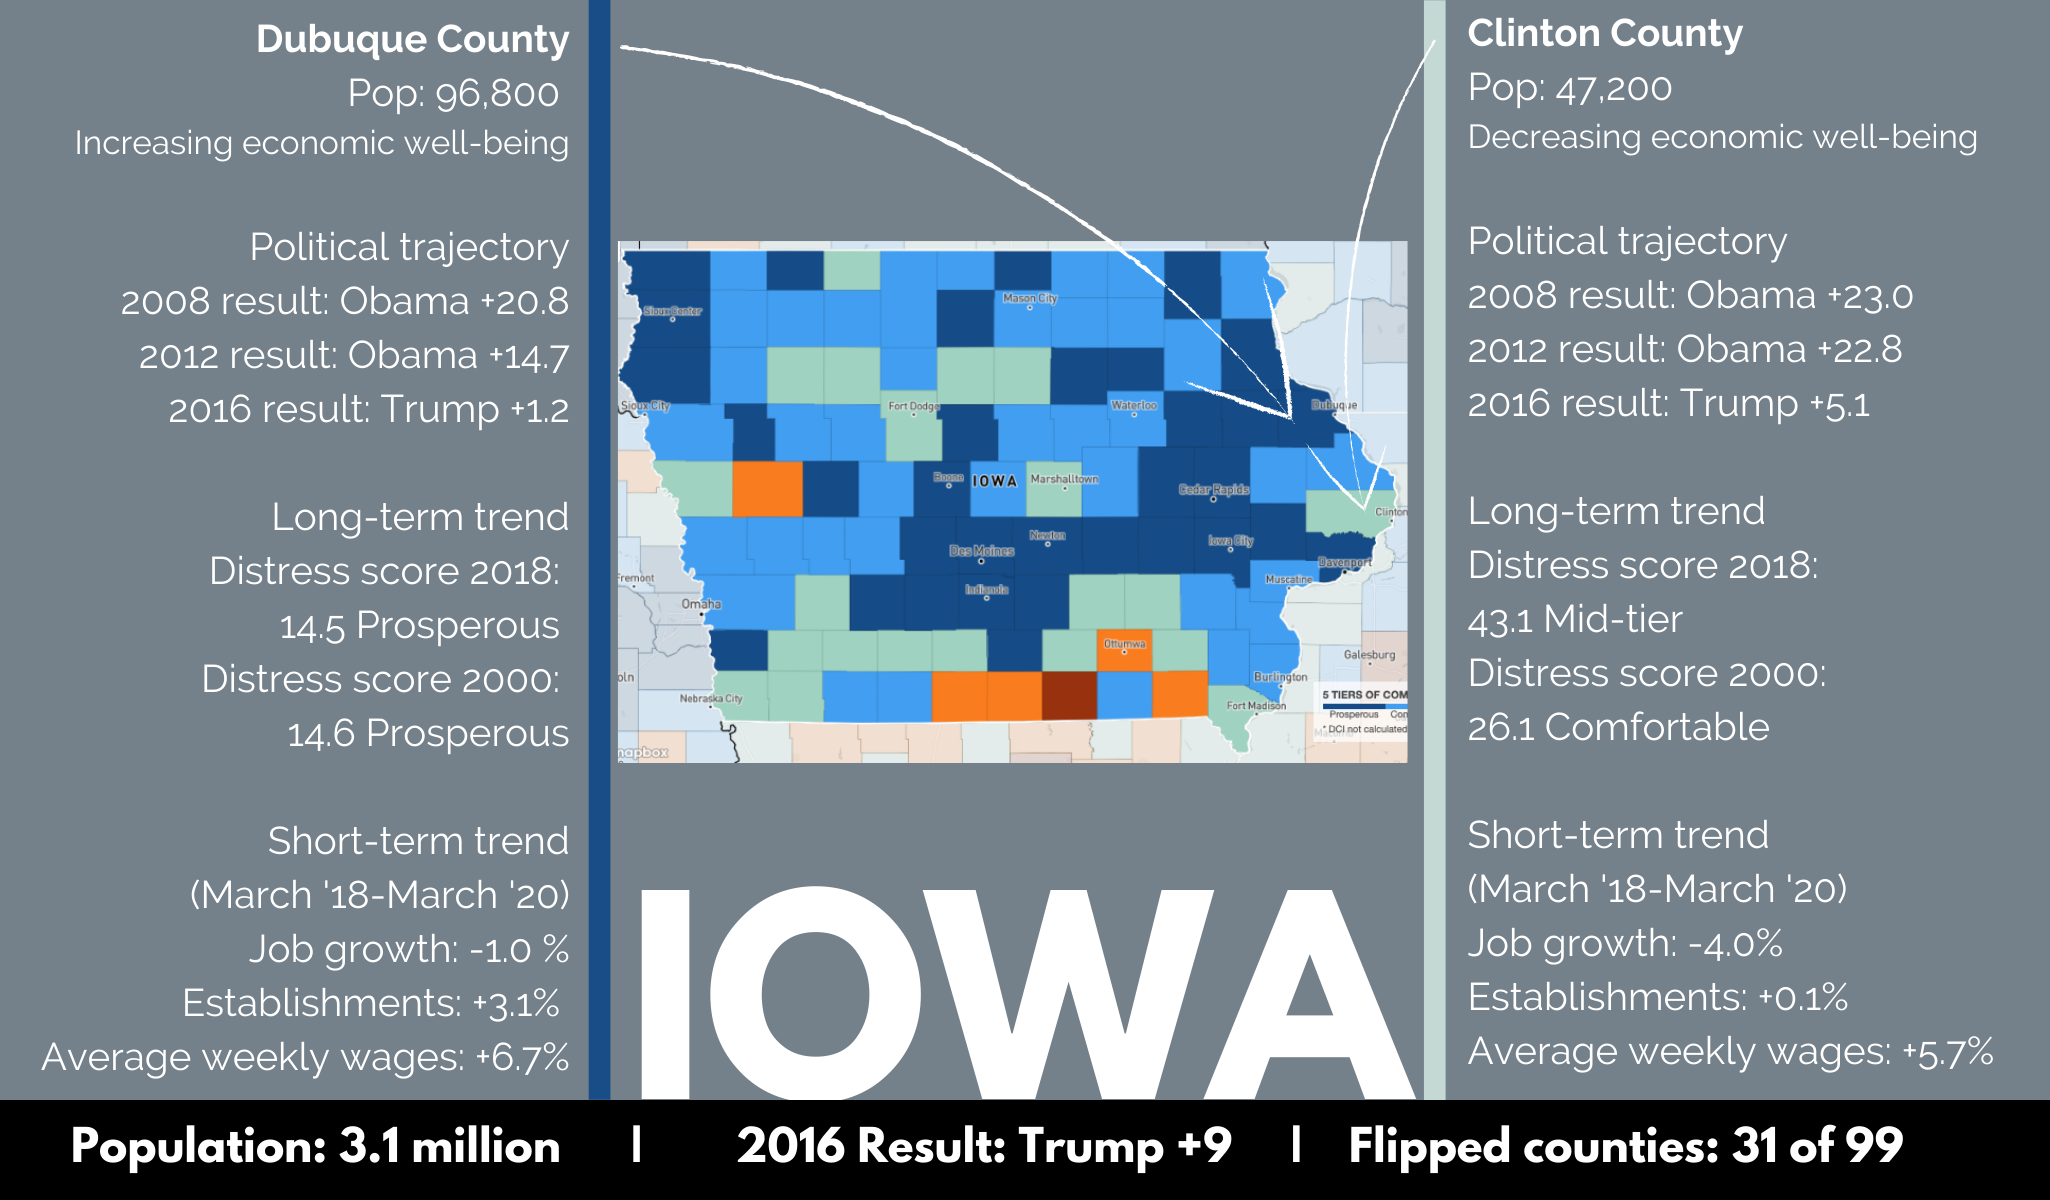
Thirty-one of Iowa’s 99 counties flipped parties in the 2016 presidential race, more than any other state. Clinton County, located on the eastern side of the state along the banks of the Mississippi, is representative of the 18 downwardly mobile counties in the state, although its drop in well-being was more severe than most. The county’s population has been on the decline in recent decades, and between periods it dropped from comfortable to mid-tier.
Dubuque County was the most populous flipped county in the state at 96,800 residents. It has remained consistently prosperous over time with relatively stable population numbers as well. The county contains no distressed zip codes and saw both employment and establishment growth from 2014 to 2018. Dubuque anchors a 50-strong string of flipped counties across five states hugging the Mississippi River as the largest of the bunch; ostensibly similar peers La Crosse, WI, and Davenport, IL, went for Clinton in 2016, and Trump carried Dubuque by only 1.2 percentage points.
Conclusion
In campaign season, practitioners and pundits alike often refer to the Midwest as a somewhat homogenous group of states. In reality, heterogeneity leads the day both across states and within them. Two clubs of economic well-being are clearly apparent at the state level: the well-off trio of Minnesota, Wisconsin, and Iowa, and the more struggling duo of legacy city-heavy Michigan and Ohio.
Underneath the state level, the same forces—some economic, others cultural—driving political polarization along lines of metro/rural geography and occupation or class at the national level are playing out within swing states as well.
Place matters for individual economic opportunity, and it matters in our form of representative government. With so many variables at play this election season, from a pandemic to trade wars to voter turnout rates and the exceptional nature of the candidates themselves, it is difficult to know what will animate which voters, where. Yet if recent history is any indication, the winner of 2020’s presidential election could be determined by a small number of places reacting to, among other things, their recent economic experience. These are some of the ones we’re watching for now. When we return to these places after the election, the DCI will further help us quantify and understand how changing local economic fates affected voters’ decisions across the political map and ultimately, the fate of the nation.