New provisions would be a boon to persistently poor rural communities in the South and boost public transparency
by John Lettieri and Kenan Fikri
Yesterday the House Ways and Means Committee passed its first package of tax legislation in the 118th Congress. Included in it are two provisions related to the Opportunity Zones (OZ) tax incentive for qualifying investments in low income and high poverty communities, which was originally enacted as part of the 2017 tax reform effort. If enacted, the legislation would result in a significant expansion of the OZ map and a giant leap in public transparency related to OZ investments and their effects on designated communities. The following analysis will examine each of these provisions in turn and highlight issues for policymakers to consider as they weigh future action on the incentive.
New map of persistent poverty OZs
The first provision would extend OZ designation to any rural persistent poverty census tract nationwide. To qualify, a census tract would need to a) be in a county in which at least 50 percent of census blocks are considered rural and b) meet a persistent poverty threshold of 20 percent or greater poverty rate over the past 30 years based on a recent Census Bureau analysis.
Our analysis finds that 1,926 rural census tracts meet the definition outlined in the legislation; however, of those qualifying tracts, more than one-third (684) are already designated as OZ communities.
The House bill would establish a new and separate timeline for the tax benefit related to qualified investments in the new map of rural OZ communities. Otherwise, the structure of the incentive itself is identical to that which was originally enacted in the 2017 bill. The Joint Committee on Taxation estimates the cost of this provision to be $1.07 billion over the 2023-2032 window.
New designations would be even more distressed–but also more regionally concentrated–than current OZs
Targeting persistent poverty communities sets a narrower geographic scope and higher threshold of economic need than the original criteria used to identify OZ communities during the 2018 designation process. The original law used the low-income community (LIC) definition that had previously been established in the New Markets Tax Credit Program, which generally requires a tract to have either a 20 percent or greater poverty rate or 80 percent or less than a reference area’s median family income. The new proposal excludes the median income of a tract from consideration and focuses instead on chronically high poverty rates over time.
Persistent poverty census tracts are a subset of LICs. Generally, the longer poverty persists the deeper it runs, such that these rural persistent poverty census tracts register as even higher need across a range of social and economic characteristics than the average Opportunity Zone, which is itself much worse off across a range of indicators than the typical LIC. More than one-third of the population falls under the poverty line in the average rural persistent poverty census tract, and the income of the median family is only 54 percent the nationwide figure. Half as many adults have college degrees while twice as many homes stand vacant compared to the nation. Most distressingly of all, life expectancy is four years shorter in persistently poor rural census tracts, and one year shorter than in the typical Opportunity Zone.
Persistent rural poverty runs deepest in Appalachia and the South. Accordingly, the bulk of census tracts that would qualify under the new criteria can be found in states in those regions. Kentucky and Mississippi have the greatest number of persistently poor rural census tracts, more than 160 each. States with few persistent poverty rural census tracts, which include Maryland, Nebraska, and Indiana, would receive only a handful of designations under the proposal, while states such as Nevada, New Hampshire, and Rhode Island would get none. California has 93 persistent poverty rural tracts, while Illinois, New York, Ohio, and West Virginia each have just over 50.
Overlaying the map of rural persistent poverty with county-level results from the 2020 presidential election, 74 percent of rural persistent poverty tracts are located in counties that voted Republican while 26 percent are located in counties that voted Democrat. Sliced differently, 24 percent of persistently poor rural tracts are in what are commonly considered blue states, 62 percent in red states, and another 14 percent in purple states (Arizona, Georgia, North Carolina, and Wisconsin). This largely tracks with the nature of each party’s coalition, with Democrats drawing most of their support from more urban or metropolitan centers and Republicans from more mid-sized cities or outlying or rural areas. However, the map of persistent poverty defies easy political classification. In parts of the Deep South or along the southern border, for example, persistent rural poverty disproportionately affects Democrat-leaning constituencies in Republican-leaning states. In the end, roughly half the population (49 percent) of the targeted tracts belongs to a non-white racial or ethnic group, 10 percentage points greater than the nation as a whole.
Changes to the political economy of zone designations
The original formula for determining how many OZs could be designated in each state balanced the goal of broad geographic representation with the core purpose of targeting high-need communities irrespective of their urban or rural status. All states were permitted to designate at least one-quarter of their eligible LICs as OZs, allowing the number of OZs to scale with the amount of economic distress in a state. As a backstop, states were guaranteed a minimum of 25 tracts, and 10 states plus DC hit that floor in the end.
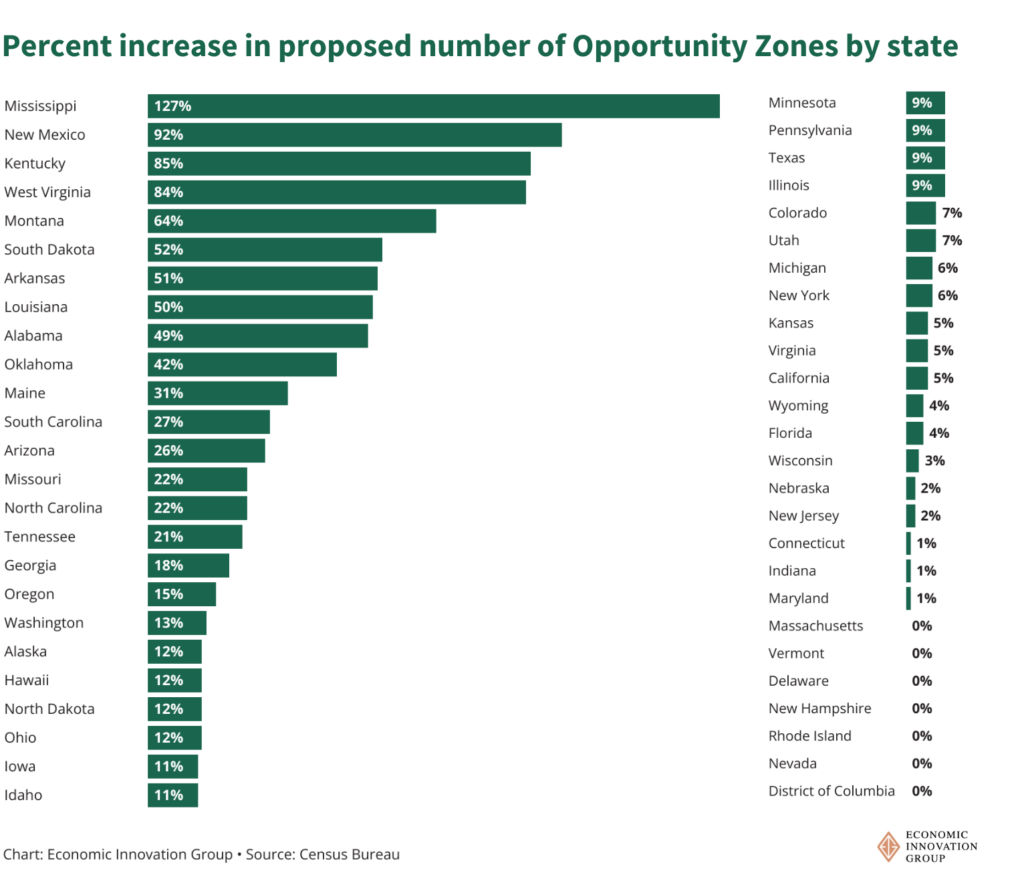
A new round of designations based on rural persistent poverty alone would significantly alter the national OZ landscape. For example, New Mexico would see a 92 percent increase in its OZs and Mississippi would see its count more than double. By contrast, six states plus DC would receive no new designations after controlling for persistent poverty rural tracts that are already OZs, and 15 states would see fewer than five.
Notably, the House proposal is a departure from the original model of having governors play a leading role in the designation of Opportunity Zones. That model helped ensure that state leadership–usually with extensive input from local officials and other stakeholders–had skin in the game regarding the implementation of the policy. The state-led nomination process also provided an opening for local knowledge to shape the map with insights that are not attainable through federal statistics alone. While by no means perfect, this process was an advance in how federal tax policy can incorporate sub-federal officials in its implementation, and it was noteworthy for how it resulted in a map that successfully targeted areas with both high need and robust potential for revitalization in spite of the first-time nature of the exercise.
Reporting requirements
The lack of robust transparency and reporting requirements related to the OZ incentive has long been a point of frustration for critics and supporters alike, as well as the focus of bipartisan attention from lawmakers. Fortunately, the Ways and Means bill incorporates the bulk of the extensive reporting provisions included in the bipartisan Opportunity Zones Transparency Extension and Improvement Act (OZTEIA) introduced in the House and Senate last year, which includes a strict penalty regime for noncompliance.
Among its provisions, the Small Business Jobs Act would require the Treasury Department to produce an annual report using aggregated data of tract-level OZ investment activity (e.g., amount, type, location, number of tracts), and two longitudinal reports measuring the performance of OZ communities over time across a variety of key socioeconomic indicators (e.g., poverty, employment, new business starts, affordable housing units), including comparisons to the performance of communities that were not designated. The longitudinal reports would be issued in the 6th and 11th years after enactment. These reporting requirements and compliance penalties are intended to apply to investments made in the original OZ designations as well as the new map of rural Opportunity Zones.
If enacted, the House proposal would dramatically improve the public’s understanding of how the nation’s largest place-based tax incentive is being put to use, as well as how it contributes to improved local outcomes for residents of many of the most disadvantaged communities in the country. Such insights are crucial to helping policymakers understand the extent to which the policy is succeeding and identify lessons that can be applied to future legislation.
Considerations for Congress
The OZ provisions in the House bill overall represent an important step forward in the life of this relatively new–and still experimental–tax incentive. Below we outline ways in which Congress can build on the House proposal and improve how past and future OZ designations can be used to benefit target communities, which we believe would have a disproportionately positive impact on rural communities in particular.
Identifying places most likely to benefit from OZ designation: Rural areas were well represented in the initial round of OZ designations in 2018. All together, 23 percent of OZ census tracts are outside of metropolitan areas, in line with the rural share of census tracts that were eligible. However, while no comprehensive or definitive data exists, close OZ observers agree that a proportional share of designations has not translated into a proportional share of investments. Why is that? While there are certainly a number of factors involved, emerging research on the effects of OZ designation on local development suggest that some types of tracts are a better fit for the OZ incentive than others. In other words, it isn’t simply a matter of designating a certain proportion of urban or rural areas, but rather what kinds of urban or rural communities match well with the nature of this particular incentive. For this reason, Congress should be cautious about proceeding with an automatic designation for all qualifying tracts irrespective of their specific local characteristics.
Cutoffs for income and student populations: Rural persistent poverty census tracts are unquestionably among the highest-need geographies in the country. However, any new round of OZ designations should incorporate a small number of targeted and meaningful filtering criteria to ensure that qualifying tracts align with the spirit of the policy.
In particular, filters for median family incomes and student populations can effectively weed out places that look poor statistically but in reality may not be appropriate targets for a federal investment incentive. For this reason, Congress should set a reasonable cutoff on the income levels of qualifying tracts. For example, 32 rural persistent poverty tracts actually have higher median family incomes than the country as a whole. Meanwhile, colleges’ upward-bias on poverty rates can be especially salient in rural areas: (low-income) students represent more than one-quarter of the population in one-tenth of all the tracts that would get nominated looking only at persistent poverty. Persistently poor rural tracts with relatively high incomes and large student populations can be found in places like Ithaca, New York (Cornell University and Ithaca College), State College, Pennsylvania (Penn State), and Ames, Iowa (University of Iowa).
Incorporating bipartisan consensus recommendations: Beyond implementing new reporting requirements, Congress should pursue a number of additional improvements to the original round of OZ designations that have bipartisan support in Congress and across an array of stakeholder groups.
First, Congress should move to sunset the small share of existing OZs that have median family incomes well above the national figure. Second, Congress should enact a one-time, two-year extension of the OZ incentive to the end of 2028 to recoup time lost during the two-year regulatory implementation. Such an extension would reinvigorate the market for OZ investment at a time when many communities are desperately in need of a boost.
Other improvements would help tackle barriers currently inhibiting greater levels of OZ investment into rural areas: scale and capacity. For example, tweaking the law to allow OZ feeder funds to aggregate capital that can then be channeled into smaller Opportunity Funds would facilitate smaller investments and greater diversification–exactly the sort of structural change that should enable more capital to flow to rural areas, where projects are often smaller and the local investor base thinner. This change would facilitate investments into non-real estate operating businesses, too, where the playing field is much more level for rural communities than it is for large real estate projects. Additionally, providing direct support to states to fund technical assistance, local capacity building, and pre-development investments–as called for in OZTEIA–would be disproportionately beneficial to inducing more OZ investment in rural areas.
These recommendations are rooted in the real-world evidence on what works for catalyzing OZ investment in rural areas and the highest need Opportunity Zones generally. To date, the OZ incentive has produced billions of dollars in rural investment and a multitude of local success stories in rural communities nationwide, from Selma, Alabama, to Brookville, Indiana, and Colorado’s Western Slope. This legislation seeks to multiply the impact of the OZ initiative by extending it to an even wider array of persistently poor rural areas. It will stand a better chance of doing so if it addresses local capacity-building, takes steps to grow the investor base, and makes it easier to invest in the types of projects that are most likely to take root and grow in rural areas.
Conclusion
Opportunity Zones have already generated a scale of investment and geographic reach far beyond previous attempts at place-based investment incentives. The Small Business Jobs Act reflects a desire among many lawmakers to extend the benefits of the incentive to more communities, as well as a clear and commendable recognition of the need for granular, publicly available data on the nature and effects of OZ investment. These are welcome signs, but we urge Congress to go further in strengthening the current policy as well as to apply important lessons from the original designation process to any new rounds of designations.