by Adam Ozimek
A growing body of research has demonstrated the impacts of remote work on where people live. In 2021, economists Arjun Ramani and Nick Bloom coined the exodus from expensive city centers to surrounding suburbs and exurbs “The Donut Effect” due to how changes in housing prices appeared on a map. As research in this area continues to grow, it’s important to recognize one fact: the geography of remote work is both heterogeneous and still evolving. To this end, this short analysis will illustrate how housing prices have evolved across regions from the start of the pandemic through the most recent data available through April 2023.
While the Donut Effect focuses on how prices relate to metro areas’ central business districts and suburban or exurban places, research has suggested that it is the most expensive and dense places that have seen the biggest declines in population and housing demand as a result of remote work. Using Zillow’s Home Value Indexes, this analysis presents a data-oriented perspective on the Donut Effect, focusing on the relationship between changes in house prices at the zip code-level and pre-pandemic housing prices.
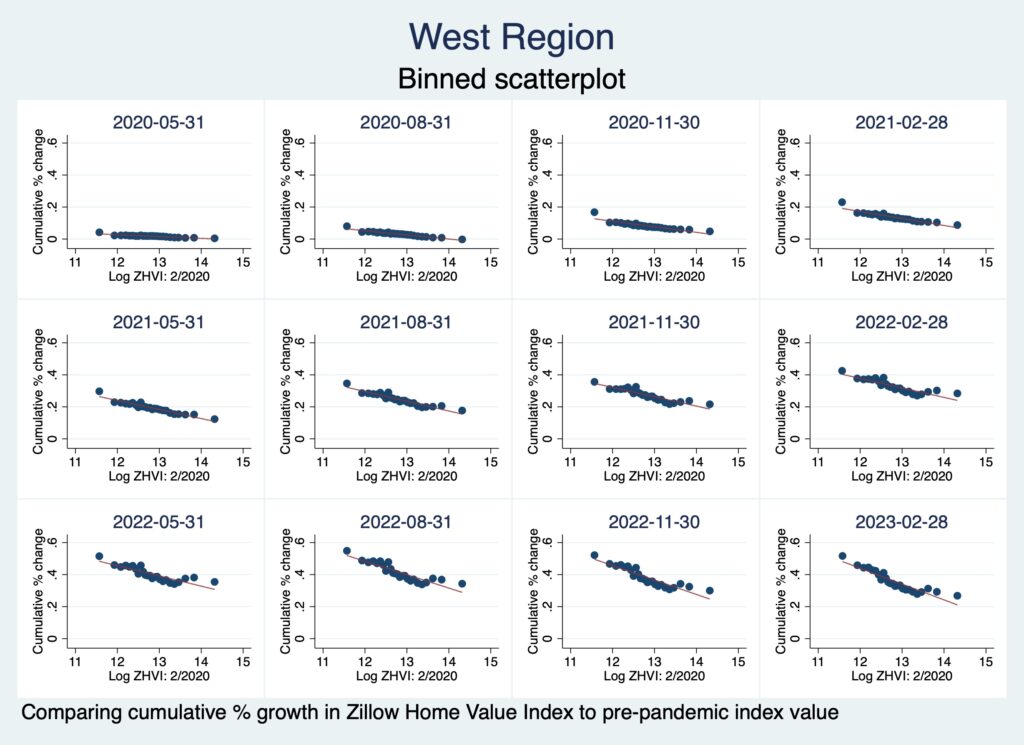
This analysis uses binned scatterplots to compare cumulative change in house prices throughout the pandemic to initial, pre-pandemic prices to characterize the Donut Effect. To illustrate heterogeneity, we focus on regional differences in the evolution of the Donut Effect as categorized by the Census Bureau’s regional classifications.
A look at the West Census Region shows a relatively consistent Donut Effect, which became notable by the end of 2020 and has gradually strengthened over the pandemic and recovery periods. Comparing mid-2022 to today reveals that the more expensive end has moved downward, indicating that the Donut Effect is strengthening.
The Donut Effect is clear across the Northeast Census Region by the end of 2020, and remains present throughout the pandemic including up through 2023; however, it had weakened somewhat by late 2021, with a relatively flatter trend line and increasing convergence between the most expensive places and those in the mid-tier. The Donut Effect began to strengthen entering 2023.
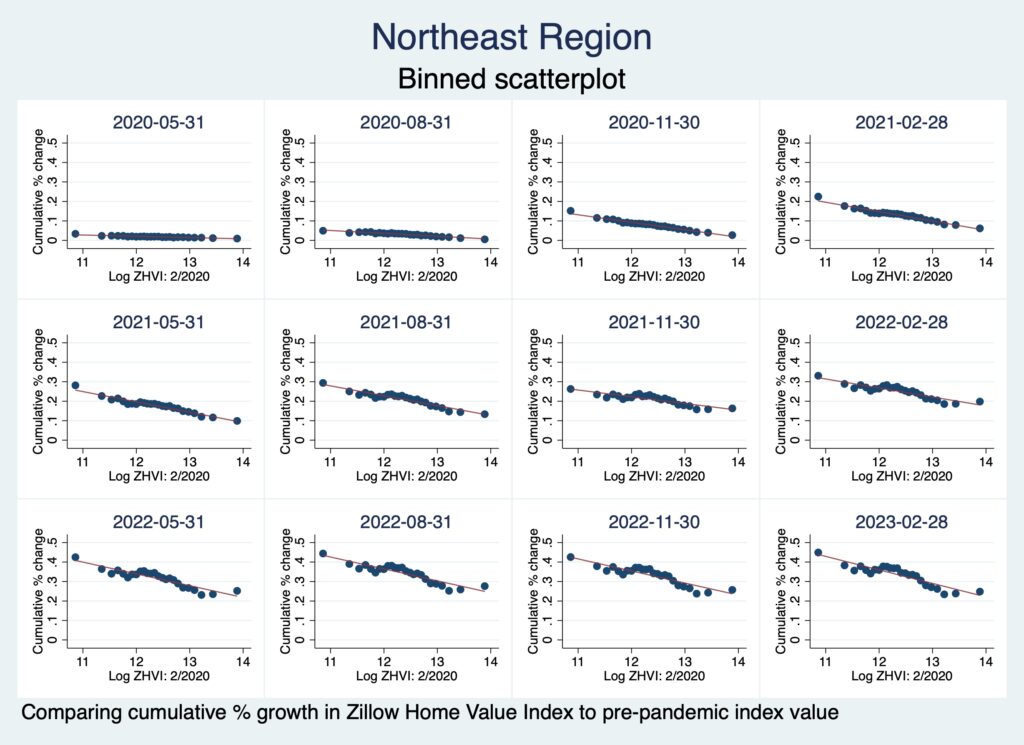
The feature that characterizes the Donut Effect in the Northeast Region is the performance of mid-priced places, which have done relatively well. Though the least expensive places have done better, the middle tier (home values around $200,000 to $250,000) held up relatively well.
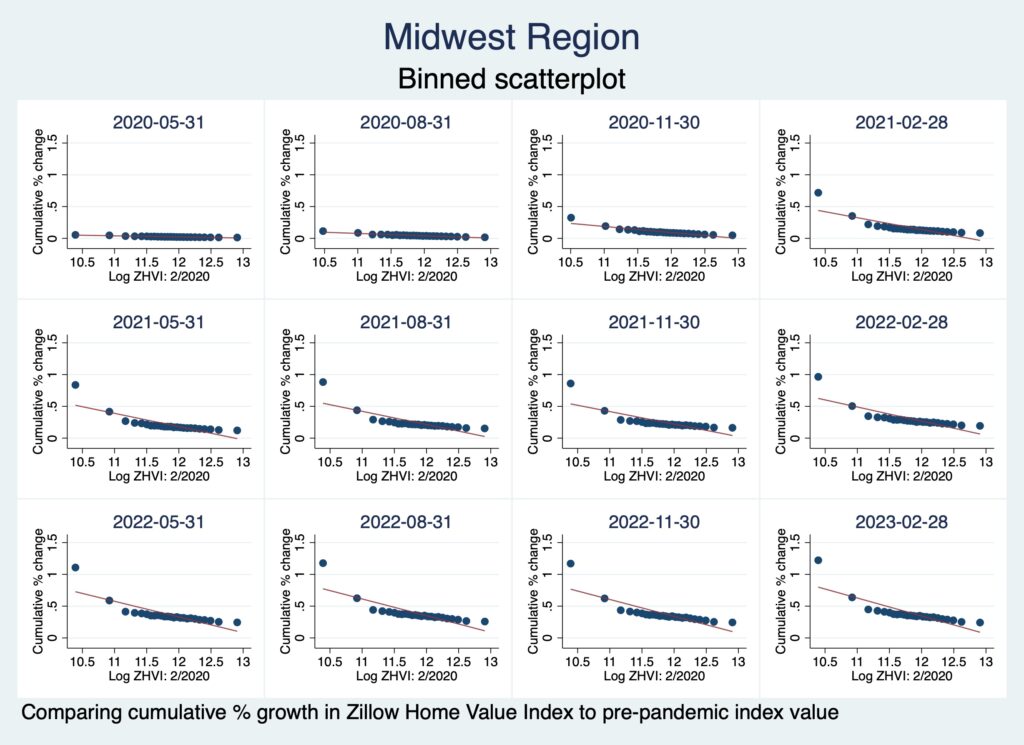
The Donut Effect is present throughout the Midwest Region, where the lowest-cost places have seen substantially more increases in price than other regions. Low cost may be a more important factor in the Midwest than in other regions, perhaps as a result of less need to be relatively close to large, more expensive urban areas.
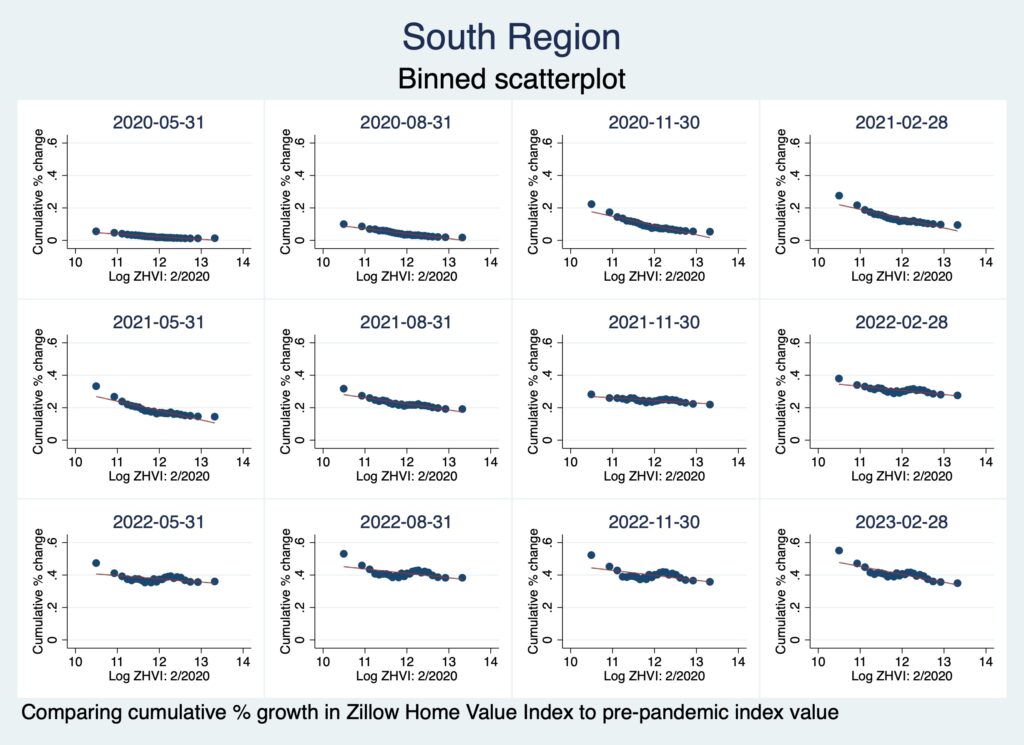
Finally we look at the South region, where a strong Donut Effect is apparent by the end of 2020; however, the donut weakens and essentially disappears throughout 2021. Towards the end of 2022 and into 2023, the donut begins to reappear. Like the Midwest, the lowest-cost places stand out, while the most expensive places have begun to fall in value within the most recent months.
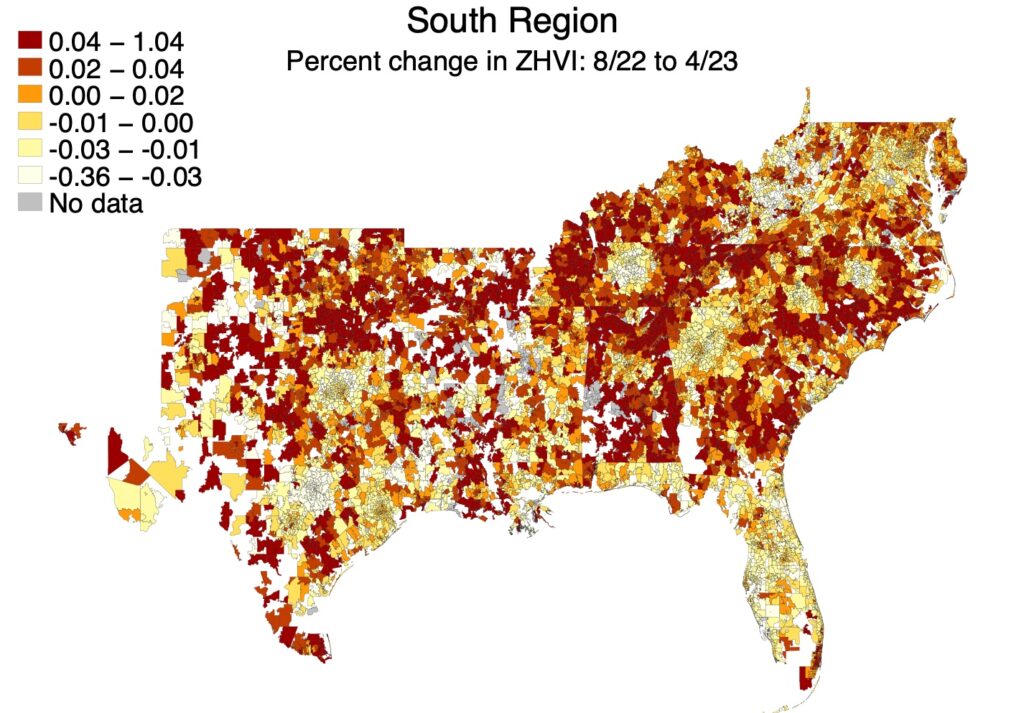
Indeed, simply looking at a map of price changes in the last 8 months, the Donut Effect in the South is abundantly clear. As house prices are falling, they are doing so in a Donut Effect-shaped pattern.
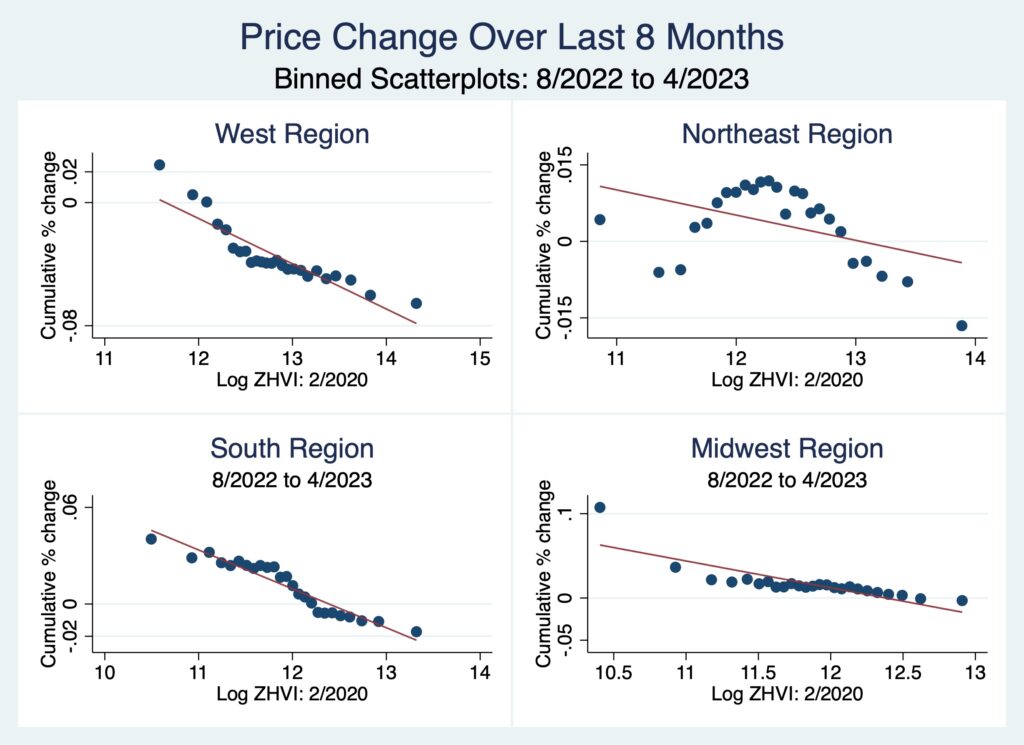
While regional heterogeneity is clear, across most regions it appears the Donut Effect has been strengthening recently. Indeed, it is worthwhile to zoom in on the most recent changes to see how the evolution of the Donut Effect has developed since August 2022, when national housing prices peaked in the Zillow indexes—one can observe heterogeneity during this period that mirrors the trends discussed above. In the West and South, the Donut Effect in general has strengthened in the last eight months as low-cost places are seeing gains and other, more expensive groups see declines map closely to pre-pandemic expensiveness. Mid-cost places have performed better over the last six months in the Northeast, while the most expensive places and some cheaper places have seen the biggest declines. The Donut Effect is strengthening in the Midwest as the least expensive places have seen the strongest price growth.
In short, the data suggest that the Donut Effect is present across the U.S. but reveal differing trends across regions. Importantly, when only focusing on certain parts of the country, the Donut Effect appears to have weakened or even disappeared beginning in 2021. In reality, the effects have been strengthening across all regions since housing prices peaked in mid-2022, suggesting that remote work’s effects on economic geography have not yet reached an equilibrium.