Economic Innovation Group Launches The Distressed Communities Index, A New Analysis of Economic Well-Being and Spatial Inequality
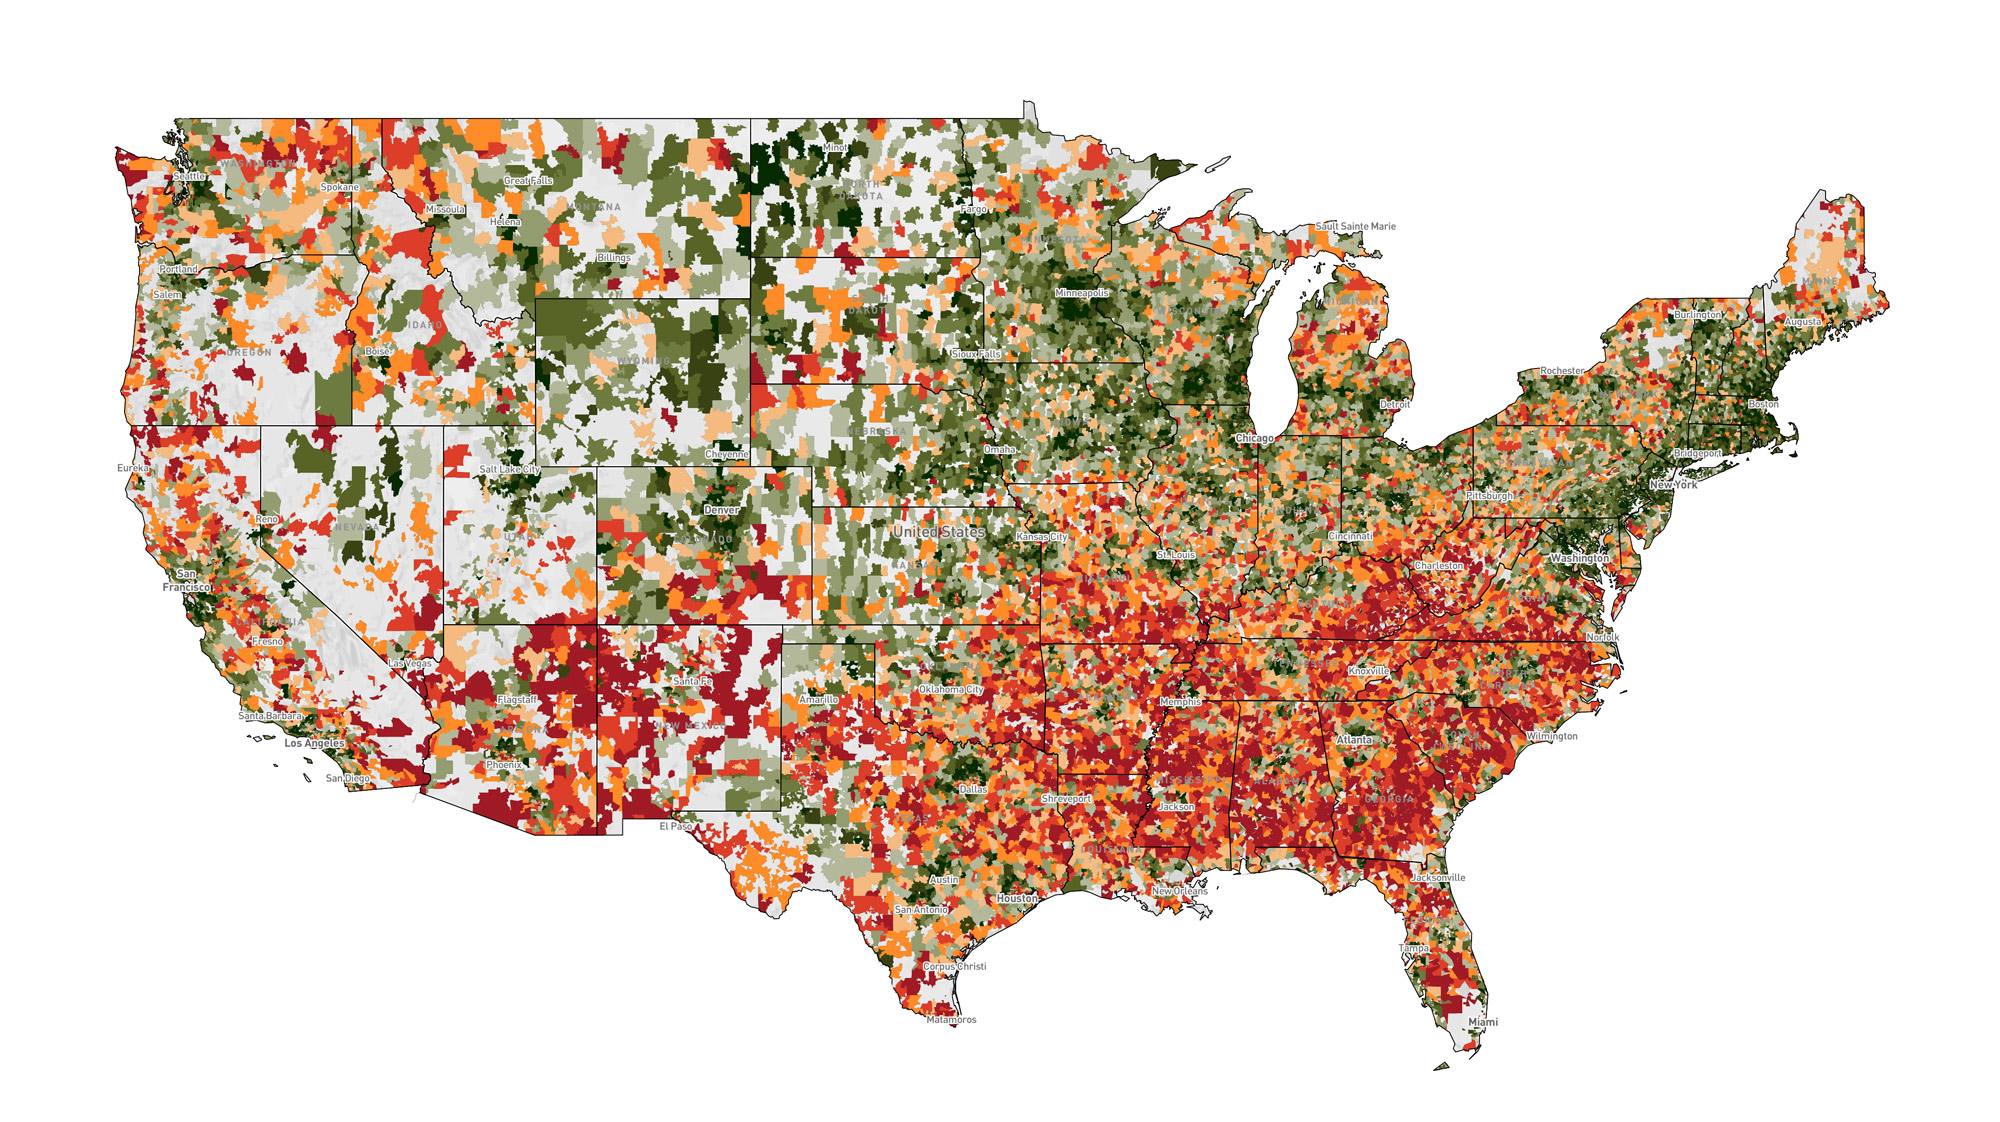
Washington, D.C. – The Economic Innovation Group (EIG) today launched the Distressed Communities Index (DCI), an interactive heat map and analysis for identifying, visualizing, and evaluating economic prosperity and distress spanning nearly every community throughout the country. The DCI was built using data from more than 25,000 zip codes and covers 312 million Americans, or 99 percent of the population. Users can explore the dataset by zip code, county, city, state, and Congressional district.
“Good data are essential for good public policy,” said John Lettieri, EIG co-founder and senior director of policy and strategy. “The DCI gives us a deeper understanding of economic well-being through the lens of local geographies, providing a powerful tool for policymakers at the federal, state, and local levels.”
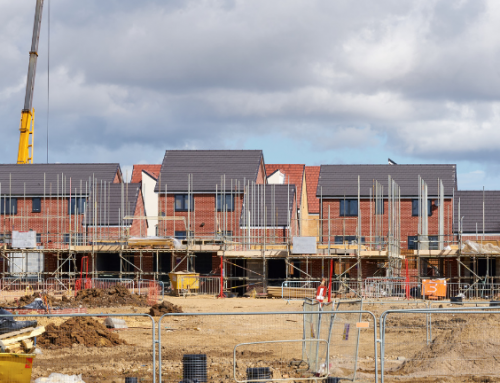
The DCI provides a multifaceted look at the circumstances underlying the prevailing economic anxiety for many Americans. While more Americans live in communities that have recovered from the Great Recession, there are large swathes of the country that continue to be plagued by disproportionate poverty and joblessness. The DCI reveals that more than 50 million Americans live in economically distressed communities.
“Millions of Americans continue to feel left behind by the economic recovery. The DCI helps us understand what is driving these sentiments and why, and how, place matters,” said Steve Glickman, co-founder and executive director of EIG. “Achieving the American dream should not be predetermined by the zip code where you happen to be born.”
An examination of economic well-being at the local level reveals that the country’s most prosperous and most distressed communities are pulling apart with particularly heavy concentrations of economic distress in Southern states and Rust Belt cities.
“We built EIG to drive innovative public policies that succeed where older models have failed in addressing complex economic problems,” said EIG founder and chairman Sean Parker. “The index will help diagnose areas that need these solutions, as well as guide their deployment.”
With the DCI, EIG also introduces a new scale for evaluating spatial inequality — the gap in economic opportunity among neighborhoods within the same city. The most spatially unequal cities are typically those characterized by wealthy suburbs and struggling urban cores that see the least integration of their economic circumstances.
The DCI provides data behind the notion that place matters, shedding light on the communities most at risk of being left behind in America.
Key findings from the study include:
- 50.4 million Americans live in distressed zip codes. In the bottom 20 percent of zip codes that are the most distressed, nearly a quarter of adults have no high school degree, over half of adults are not working, and the median income is only two-thirds of the state level.
- The country’s most distressed zip codes are stuck in a deep recession, while the most prosperous flourish. During the recovery years from 2010 to 2013, the average distressed zip code lost 6.7 percent of its jobs and saw 8.3 percent of its businesses close. At the same time, the average prosperous zip code enjoyed booming job growth of 17.4 percent and business growth of 8.8 percent. In the median zip code, job growth was half the national average and no new businesses opened during those three years of recovery.
- Distress is concentrated in a small number of states and cities. Economic distress is concentrated in the South, Southwest, and Rust Belt. Many of these struggling rural and urban communities are stricken by long-term, structural economic problems. Texas contains the largest number of people in distressed zip codes (5.2 million) and Mississippi has the largest share of its population in distress (40 percent). Eighty cities — comprising only 40 percent of the country’s urban population — carry over two-thirds of national urban distress. The Great Recession exacerbated distress in most of these cities but did not cause it. Cities with the largest concentrations of distress have the most difficulty escaping the downward spiral of shrinking tax bases, business investment, and access to capital.
- Prosperous cities tend to be the newest and fastest-growing. Many of the country’s most prosperous cities are located in states and metro areas that experienced only mild recessions: cities like San Francisco and Dallas, and states like Colorado and Minnesota. In other regions, prospering and distressed cities often sit side by side within the same metro area where the prosperous city is a burgeoning new locale and the distressed city an aging urban core. The median home in the most prosperous 10 percent of cities was built in 1989; in the most distressed, it was built in 1959. The most prosperous cities averaged 8.2 percent population growth from 2010 to 2014; the most distressed 0.5 percent.
- Inequality is about more than income; spatial inequality shows where opportunities differences are most extreme between neighborhoods. Distress scores provide a new way to look at how inequality is experienced across neighborhoods. EIG measured the gap in economic well-being across zip codes within the same city and found that the most spatially unequal cities–where opportunity among neighborhoods within cities is most uneven–are in the South and Rust Belt. Cities with high income inequality like Boston, New York, and San Francisco actually see far less inequality across neighborhoods than the most spatially unequal cities of San Antonio, Phoenix, or Columbus, where nearly adjacent neighborhoods exist world’s apart.
You can view the full report, interactive maps, and infographics here: eig.org/dci.
Supporting Resources
- DCI interactive visualization: eig.org/dci
- Report: eig.org/dci/report
EIG welcomes press, bloggers, policymakers, think tanks, and other interested parties to use and reference our research with attribution, such as “Source: Economic Innovation Group Distressed Communities Index, 2016.”
About the Economic Innovation Group (EIG)
The Economic Innovation Group (EIG) is an ideas laboratory and advocacy organization whose mission is to advance solutions that empower entrepreneurs and investors to forge a more dynamic American economy. Headquartered in Washington, D.C. and led by an experienced, bipartisan team, EIG convenes leading experts from the public and private sectors, develops original policy research, and works to advance creative legislative proposals that will bring new jobs, investment, and economic growth to communities across the nation. For more information, visit eig.org.