The State of Socioeconomic Need and Community Change in Opportunity Zones
This paper offers a detailed baselining of prevailing social and economic conditions across the country’s Opportunity Zones. It comes as this new policy is just beginning to take shape. The U.S. Department of the Treasury issued the first of draft of proposed rulemaking in October 2018. Many unknowns remain, including some pertaining to fundamental functions of the incentive.
Our goal here is to level-set on the current state of need and change in Opportunity Zones—the federal government’s farthest-reaching place-based economic and community development initiative in at least a generation. The zone designation process led by governors early in 2018 produced a compelling map across which this new policy will play out over the next 10- plus years. While most zones are well within the spirit of the policy, a small share of designations raise legitimate concerns about need-targeting. While it is important to learn from these cases to improve targeting in the future, the outliers should not obscure the fundamental fact that Opportunity Zones are a cohort of places facing enormous socioeconomic challenges.
A survey of the data reveals:
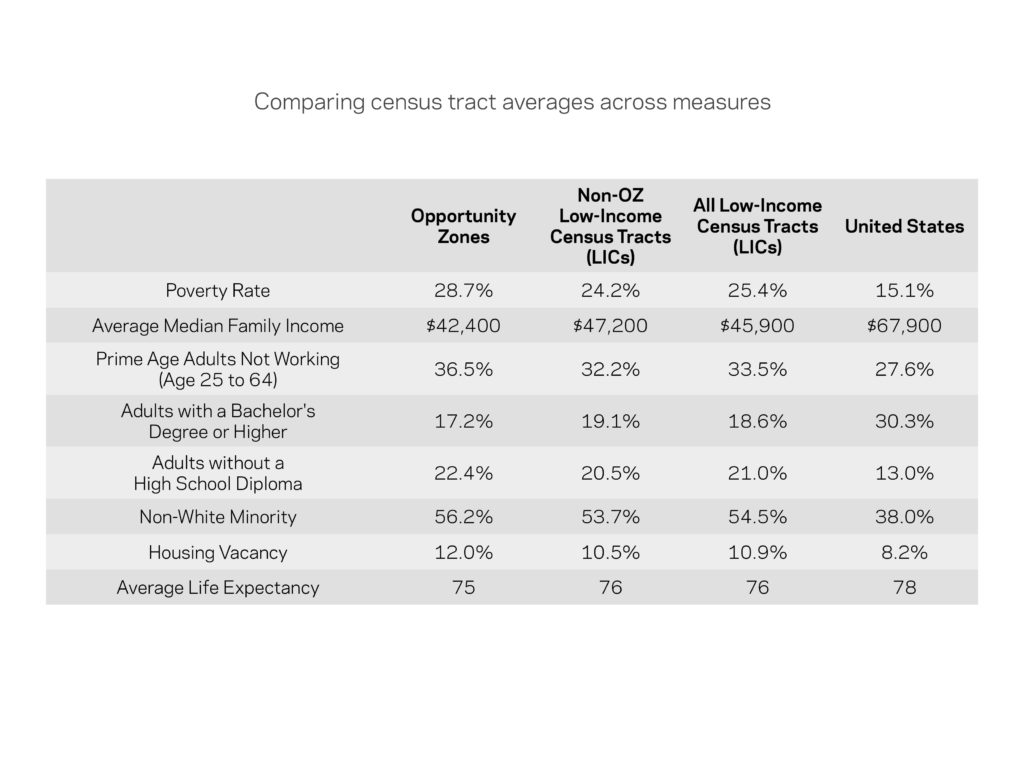
- Opportunity Zones are higher-need across nearly every available measure than both the full universe of eligible tracts and the subset of low-income census tracts that did not receive designation.
- Seventy-one percent of Opportunity Zones meet the U.S. Treasury Department’s definition of “severely distressed.”
- The average designated tract has a poverty rate nearly double the national average. More than one-fifth of all Opportunity Zones have poverty rates of 40 percent or higher, which is true of only around 5 percent of communities nationwide.
- The median family income of the median Opportunity Zone is only $40,800, or 40 percent below the national level.
- Of the 31 million residents of Opportunity Zones nationwide, over 14 million live in communities that saw median incomes decline over the recovery period and nearly 19 million live in ones in which poverty rates rose.
- In an era in which educational attainment is increasingly critical to local prosperity, more adult Opportunity Zones residents lack a high school diploma than have obtained a college degree.
- Minorities comprise a majority of Opportunity Zones residents, and one third of black and Hispanic households are owner-occupied. This translates to 1.4 million minority households who could see their wealth improve as a result of local reinvestment.
- Over 96 percent of Opportunity Zones do not show readily observable signs of gentrification according to two independent, multidimensional measures.
- The ratio of Opportunity Zones losing population compared to those showing signs of gentrification is more than 12 to 1.
Now that the map is in place, the challenge is to ensure the incentive unlocks an effective distribution of the capital across the many different types of places and use cases. That will require successful regulatory implementation, continuous work on the ground to align investor incentives with community needs, and broad-based engagement across public, private, and non-profit sectors.