

Originally published on Agglomerations, the Substack newsletter from the Economic Innovation Group.
By Jess Remington
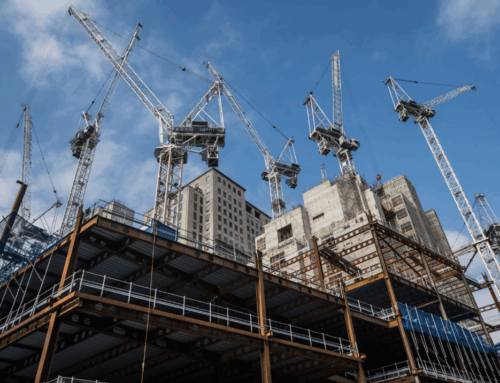
For decades, America’s housing growth has followed a familiar blueprint: build outward. From 1950 to 2014, more than 90 percent of all new housing in major metro areas was built in the suburbs and exurbs.
In a long and thoughtful piece in April, New York Times journalist Conor Dougherty looked at booming home construction in the Sunbelt states, which have attracted millions of new residents with their relatively affordable rents and home prices. And they’re doing it almost entirely through suburban and exurban sprawl — single-family homes spiraling out farther and farther from city centers.
Homes are replacing farmland in Texas, spreading across the desert in Arizona, and rising on former forests and swampland in Florida.
Dougherty is right that the recent explosion in suburban sprawl has been instrumental in easing home prices in the Sunbelt. But this is only one part of the housing story.
A small but significant set of dense urban neighborhoods has been matching, and in some cases exceeding, the pace of homebuilding in the sprawling suburbs of Texas, Arizona, and Florida. These places have absorbed rapid population growth while keeping housing costs relatively contained — so much so that the typical resident in these cities now spends less on housing, as a share of income, than the national average. Their success challenges the false tradeoff between density and growth.
But first, let’s look at the data for new housing construction over the past decade, which tells a surprisingly nuanced story about the role that density plays in homebuilding.
New Home Construction: Dense Counties, Sparse Tracts
At the county-level, density is king: from 2014 to 2024, the densest 20 percent of counties in the United States accounted for 80 percent of all new homes built.
You can see the trend clearly in the chart below, which from left to right shows the least dense 10 percent of counties through the most dense, where density is defined as the county’s 2014 population divided by its land area.
The vast majority of new housing supply is concentrated in the places that already have the most people, jobs, infrastructure, and cultural amenities.
But when we zoom in closer to the Census tract level,[1] we see what is basically an illustration of the familiar story of suburban and exurban sprawl: New housing construction within the densest counties has been concentrated in some of the least dense neighborhoods — in most cases, the outer-ring suburbs.
One archetypal example of this type of low-density, high-construction neighborhood is a Census tract in southwestern Fort Worth, Texas. The tract, which includes the neighborhood Llano Springs, is about 15 miles from downtown Forth Worth and 45 miles from Dallas. In 2014, the tract was mostly empty pastures. There were fewer than 500 residents and around 200 homes, with a population density of 223 people per square mile. Today, the population has sextupled to nearly 3,000 residents and 1,500 new detached single-family houses. It’s precisely the type of suburban sprawl neighborhood that Dougherty describes as leading the construction boom.
The Exception: Major Downtowns
The dominance of neighborhoods like Llano Springs might suggest that low-density places in high-density regions are the most desirable places to live and to build, in part because many people prefer having larger homes with more space between them and their neighbors (the demand side), and in part because these places have the most undeveloped land (the supply side).
But when we look again at the chart above, another surprising trend reveals itself: housing construction ticks up in the densest 10 percent of neighborhoods — the downtowns and urban cores often thought to be “too built out.”
This pattern is even clearer on a per capita basis. The densest 10 percent of tracts — the downtowns and urban cores — are building more housing relative to their populations than the next 20 percent — the inner-ring suburbs surrounding downtown neighborhoods.[2]
Consider New York City, which added only 34 new homes per 1,000 residents over ten years.[3] That’s modest compared to the Fort Worth suburbs, where fast-growing neighborhoods like Llano Springs have pushed the surrounding county’s rate to 70 homes per 1,000 residents. But New York City still vastly outbuilds its suburban neighbors — Westchester and Nassau counties each built only 7 homes per 1,000 residents. Even the notoriously construction-adverse San Francisco exceeded its suburbs in per capita construction: 31 homes per 1,000 residents in the city versus just 17 in neighboring Napa County.
New York City has been able to build more per capita than Westchester and Long Island, and San Francisco more than Napa — in spite of their significantly higher densities — primarily by building tall apartments with hundreds of homes in their downtown neighborhoods. In some cases, these apartments replaced old parking garages; in other cases, they were part of a broader urban revitalization effort that rezoned industrial areas to mixed-use residential. And while this activity has helped somewhat to ease the housing crisis, it certainly falls short of actually solving the problem, as the per capita building rates for these cities as a whole are still quite low.
But there are outliers: some dense cities are building new housing at rates comparable to America’s suburban powerhouses. In turn, these places have managed to keep housing costs relatively under control compared to their peers. A compelling — and perhaps unexpected — example is Washington, DC.
Washington, DC is Building a Lot of Homes Per Capita
The District of Columbia has become an unlikely leader in housing construction.[4]
From 2014 to 2024, DC built 113 homes per 1,000 residents — more than twice as much housing per capita as other major cities of a similar density, like Philadelphia and Boston. It even built more per capita than the suburban heavyweights of Orange County, Florida (home to Orlando) and Maricopa County, Arizona (home to Phoenix).
Of the 168 largest counties in the United States, DC ranked 15 in terms of new homes per capita. This is especially remarkable for a county that spans just 61 square miles — a third of which is owned by the federal government and is thus off-limits to residential homebuilding — and where federal law prohibits the construction of skyscrapers.
How did DC pull this off?
Housing growth in DC has stemmed from three key approaches: 1) building eight-to -13 story apartments along major corridors, 2) converting single-family attached rowhomes into multi-unit dwellings like triplexes or condos, and 3) developing compact, dense mixed-use communities on parcels that previously housed parking lots or low-rise commercial buildings.
A particularly successful example of the latter is the NoMa neighborhood, which contains one of the top-ranked Census tracts in the United States for new housing construction per capita. In 2014, NoMa was already dense by national standards, with blocks of rowhomes and a handful of office buildings. But it also had a sea of surface parking, vacant lots, and shuttered commercial buildings. Before it was rezoned for mixed-use residential, the land fell under the catch-all zoning category of “other.”
Since then, several thousand new homes have been added in a space of less than half of a square mile. That growth also brought a grocery store, dozens of local businesses, and the adaptive reuse of an old warehouse into a popular food hall with a rooftop terrace open to the public.
The change from then to now is stark, and best seen in overhead shots.
NoMa in 2014:

NoMa in 2024:

NoMa isn’t Manhattan. It’s still a neighborhood where buildings top out at around 12 stories, and rowhomes (some of which have since been converted to duplexes or triplexes) sit across the street from new apartment buildings. But what was once a landscape of surface parking and a famously vacant Burger King has transformed into a vibrant residential community — while still serving as a main entryway into the city for commuters, providing ample parking for shoppers, retaining greenery through public parks and a college campus lawn, and encouraging safer, multi-modal transit with wide sidewalks, protected bike lanes, and a metro station.
And it’s not done building. As of 2025, new apartments are underway.
NoMa was one of several mixed-use neighborhoods in DC that added thousands of homes on a relatively small plot of land: the Waterfront and Navy Yard neighborhoods have a similar story. Overall, in spite of federal constraints like the Height Act and federal land ownership, DC grew its housing stock by 18 percent from 2010 to 2020 — nearly triple the national average of 6.7 percent.
DC is also, perhaps surprisingly, one of the more affordable large cities for residents. We typically look at housing prices compared to the national average — on that metric, DC is extremely unaffordable. But it’s important to also view prices in the context of prevailing wages for the region. The typical DC resident actually spends less of their income on housing than the typical American. According to 2023 American Community Survey (ACS) data, the typical DC renter spent 28 percent of their income on housing, and the typical homeowner with a mortgage spent 19 percent — both below the national medians of 31 percent and 21 percent, respectively.
Additionally, while the proportion of DC residents who are housing cost-burdened is concerningly high (38 percent), this is still lower than Boston (45 percent), New York City (50 percent), Los Angeles (55 percent), and Miami (58 percent), as well as the nation as a whole (39 percent).[5]
This relative affordability may help explain where people are choosing to move: since 2014, DC’s population grew by 7 percent, compared to stagnation in New York City and a significant exodus from California’s major cities (Los Angeles lost 1 percent of its population and San Francisco lost 3 percent). DC’s population growth even rivals that of Houston (7 percent) and Phoenix (9 percent).
Seattle and Atlanta Are Building Too
DC is not the only dense place that has been building a lot per capita.[6] Over the past decade, the downtowns of Seattle and Atlanta have built new homes at a similar rate as the suburbs of Arizona and Texas — around 200 homes for every thousand residents.
Like DC, much of the homebuilding in Seattle and Atlanta happened via new apartments and mixed-use neighborhoods rising on old warehouses, parking lots, and low-rise commercial properties. Both cities also prioritized improvements to their transit-oriented development and upzoned around some rail stations.
Consequently, Seattle and Atlanta are also among the more affordable large cities for residents when compared to the area’s wages. The median Seattle resident spends less of their income on housing than the typical American (27 percent for renters in Seattle versus 31 percent in the U.S. and 20 percent for homeowners with a mortgage in Seattle versus 21 percent in the U.S.). Additionally, fewer Seattle residents are housing cost-burdened than in the U.S. as a whole (37 versus 39 percent).
The rates for Atlanta are slightly higher — 33 percent of the median renter’s income and 19 percent of the median homeowner’s income is spent on housing, while 43 percent of residents are housing cost-burdened — but these numbers are still far below those of many major cities like Los Angeles, New York City, and Miami.[7]
Seattle has been one of the fastest growing cities in America the past decade — the city has grown by over 100,000 people, or 17 percent. Likewise, Atlanta has grown by 14 percent.
What’s Holding Back Other Dense Places?
If DC, Seattle, and Atlanta can build, why aren’t other dense places doing the same? The issue isn’t land. The average American downtown, for instance, devotes 26 percent of its land to parking lots and garages. In LA, a city with one of the worst housing crises in the nation, that figure is 23 percent.
And even within relatively successful cities like DC, Seattle, and Atlanta, why is so much of the homebuilding concentrated in downtowns, major corridors, and formerly industrial neighborhoods? One simple explanation is zoning. In Atlanta, 60 percent of all tax lots are still zoned for single-family-only housing, while in DC the share is even higher at 75 percent. Until recently, 80 percent of Seattle’s land was zoned for single-family-only housing.[8] These single-family-only neighborhoods in the city should also be thought of as inner-ring suburbs, and they too hold vast untapped potential. But unlike old industrial zones, their “underutilized” land often comes in the form of big lawns, big setbacks, and low buildings — spaces that many suburban residents currently think of as undesirable for their neighbors to convert into homes.
The problem is legal, not physical. Many of these jurisdictions have effectively outlawed the kinds of housing that meets modern demand. Zoning codes often prohibit even small apartment buildings, and existing homeowners frequently block reform.
But the demand isn’t going away. People want proximity to jobs, to transit, and to each other. The remarkable growth of places like NoMa is proof that, when allowed, dense places can and do build.
The housing crisis in America isn’t just about building more — it’s about building in the right places. Outer-ring suburbs and exurbs will continue to grow. But if we’re serious about addressing affordability, climate change, and economic opportunity, we also need more growth in the places where it’s hardest — and most necessary — to build.
That means continuing to unlock parking lots and low-rise commercial corridors in downtowns. It also means continuing to prioritize building in the suburbs — but in the form of infill, rather than just sprawl. And it means rethinking how we define which land is “buildable.”
The Github repository for this analysis is available here.
Notes
- A Census tract is a county subdivision, or neighborhood, of around 4,000 residents, whereas the average county had about 108,000 residents in 2024.[↩]
- Inner-ring suburbs and outer-ring suburbs are correlated with density, but they are not an exact match. Some low-density communities would be considered inner-ring suburbs because they border dense downtowns.[↩]
- We are technically comparing counties. So for New York City, which comprises five counties, we have aggregated those.[↩]
- Since DC is in the unusual position of being both a city and a county, we can compare it to both cities and counties in other parts of the country.[↩]
- Housing cost-burden is the share of renters and homeowners with a mortgage who spend more than 30 percent of their income on housing costs.[↩]
- You might wonder why a city like Austin, Texas doesn’t make this list, even though it’s been in the news a lot for its recent construction boom and zoning reforms. One reason is because most of Austin’s homebuilding has actually been in the metro area’s suburbs (in the table for most new homes built per capita, the Austin suburb of Williamson County is number one). The second reason is because even in the city proper, Austin is not very dense by national standards.[↩]
- Based on 2023 ACS data.[↩]
- An earlier version of this piece implied that Seattle’s single-family zoning still accounts for 80 percent of land. It has been changed to reflect recent zoning updates. Notably, Seattle has taken major steps in recent years to enable suburban infill through missing middle housing, including a 2019 reform that relaxed ADU regulations. Since then, ADU permitting has more than doubled. On May 27, 2025, Seattle’s city council unanimously voted to upzone the entire city in order to comply with Washington state law — legalizing four homes by right on all residential lots and six near transit. The ordinance is a stopgap measure for now, but it will be exciting to monitor how it develops.[↩]