By Jason Segedy
EIG recently released two reports as part of its Neighborhood Poverty Project, which examines the evolution of community-level poverty across metropolitan America over nearly four decades.
The first, entitled The Expanded Geography of High-Poverty Neighborhoods, found that the number of neighborhoods across the United States with a high poverty rate (30 percent or higher) has doubled since 1980.
The second, entitled The Persistence of Neighborhood Poverty, found that two-thirds of the neighborhoods across the United States that were high poverty in 1980 were still high poverty in 2018.
This analysis will take a closer look at the high-poverty neighborhoods in Ohio’s largest urban areas. Ohio has arguably suffered more than any other state from the economic decline of blue-collar jobs over the past 50 years. Ohio is home to more legacy cities than any other state, and its urban areas have largely failed to experience trends in revitalization compared to other cities that have successfully attracted many highly-educated, highly-paid residents.
For the purposes of this analysis, I examined all of the neighborhoods located in the eight counties that contain the core city of each of Ohio’s largest metropolitan areas, as well as 5.5 million Ohioans, or 47 percent of the state’s population.
- Cuyahoga County (Cleveland)
- Franklin County (Columbus)
- Hamilton County (Cincinnati)
- Lucas County (Toledo)
- Mahoning County (Youngstown)
- Montgomery County (Dayton)
- Stark County (Canton)
- Summit County (Akron)
I looked at these neighborhoods through the same lens that EIG used in the Neighborhood Poverty Project:
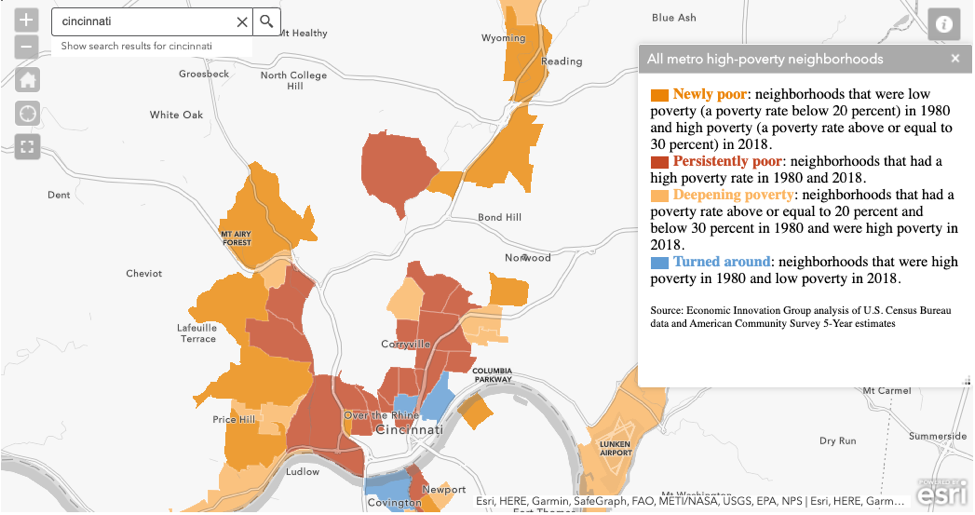
- Turned Around (neighborhoods that were high poverty in 1980 and low poverty in 2018)
- Newly Poor (neighborhoods that were low poverty in 1980 and high poverty in 2018)
- Deepening Poverty (neighborhoods that had a poverty rate of 20-30% in 1980 and were high poverty in 2018)
- Persistently Poor (neighborhoods that were high poverty in both 1980 and 2018)
I also used the same basic definitions that EIG used in the Neighborhood Poverty Project:
- Neighborhoods – coextensive with individual census tracts
- High-Poverty neighborhoods – poverty rate of 30 percent or higher
- Low-Poverty neighborhoods – poverty rate of less than 20 percent
Finding #1: Gentrification is nearly non-existent in Ohio’s largest cities
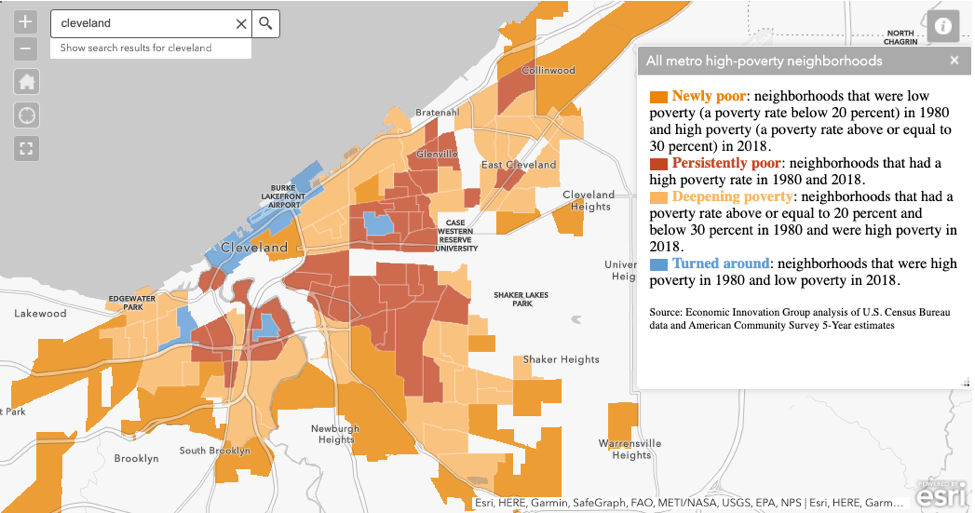
Throughout Ohio’s eight large urban counties, only 10 neighborhoods transitioned from high poverty to low poverty between 1980 and 2018. Four of these neighborhoods were located in Cleveland, four were located in Columbus, and two were located in Cincinnati.
All of these neighborhoods are located in or near the downtown core of these three cities and include notable places like Tremont (Cleveland), the Short North (Columbus), and Mount Auburn (Cincinnati).
In these turnaround neighborhoods, the poverty rate decreased from 41 percent to 16 percent, population decreased by 8 percent, and the white population increased from 56 percent to 61 percent.
Twenty-two thousand Ohioans – 0.4 percent of the population of these eight counties – live in these turnaround neighborhoods.
Finding #2: Poverty in Ohio’s largest urban areas has concentrated and expanded
While 10 neighborhoods transitioned from high to low poverty, 369 stayed or became high-poverty. So, for every neighborhood in these eight counties that turned around and escaped high poverty, there were 37 others that stayed or became poor.
Sixteen percent of the population of these eight counties – 878,000 Ohioans – live in these high poverty neighborhoods.
For every person in Ohio’s large urban counties that lives in a neighborhood that turned around from high to low-poverty since 1980, there are forty people who live in a neighborhood that stayed or became high-poverty.
The next three findings explore the state’s high-poverty neighborhoods across the three groups enumerated above: the newly poor, the persistently poor, and those experiencing deepening poverty.
Finding #3: For every neighborhood that turned around, 15 went in the opposite direction
In these eight large urban counties, 154 neighborhoods became newly poor. Between 1980 and 2018, the poverty rate in these neighborhoods increased from 13 percent to 39 percent; population decreased by 20 percent; and the white population decreased from 74 percent to 38 percent.
This analysis breaks out the change in white population over time because, historically throughout urban America, large declines in the white population have often resulted in disinvestment, disadvantage, and marginalization. Predominantly Black neighborhoods are hit especially hard by these dynamics and neighborhood poverty.
Eight percent of the population in these eight counties – 441,000 Ohioans – live in neighborhoods that have become newly poor.
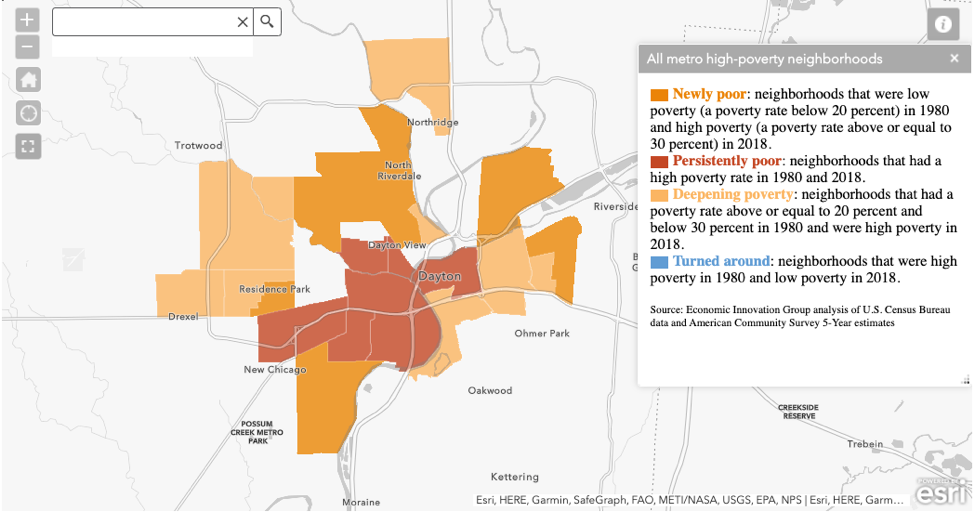
The newly poor neighborhoods were solidly middle-class in 1980, and are located primarily either on the outer periphery of the eight central cities or are in inner-ring suburbs like Euclid, Garfield Heights, Maple Heights (Cleveland); Norwood (Cincinnati); and Kettering (Dayton).
Finding #4: Neighborhoods that were already threatened by high poverty declined even further
In these eight large urban counties, 104 neighborhoods experienced deepening poverty. These are places that were already fairly poor four decades ago and have gotten even poorer today.
The poverty rate in these neighborhoods increased from 25 percent to 42 percent; population decreased by 40 percent; and the white population decreased from 48 percent to 30 percent.
Just over 4 percent of the population of these eight counties – 226,000 Ohioans – live in neighborhoods that experienced deepening poverty. These neighborhoods were working-class places in 1980 and are located within the central cities and some older inner-ring suburbs like East Cleveland and Garfield Heights.
Finding #5: Poverty in the oldest, predominantly Black neighborhoods closest to the urban core has been chronic and persistent – and is still getting worse
In these eight large urban counties, 111 neighborhoods have been persistently poor and remain enmired in chronic poverty.
Between 1980 and 2018, the poverty rate in these neighborhoods increased from 42 percent to 50 percent, and population decreased by 44 percent. The white population decreased from 24 percent to 21 percent, and the Black population fell from 73 percent to 68 percent while the Hispanic share of the population rose to 6 percent.
Just under 4 percent of the population of these eight counties – 211,000 Ohioans – live in neighborhoods that have remained persistently poor. These neighborhoods are predominantly located in the core of the central cities, and nearly all were heavily majority-Black neighborhoods in 1980. Moreover, many were redlined in the 1930s and suffered from widespread disinvestment for generations.
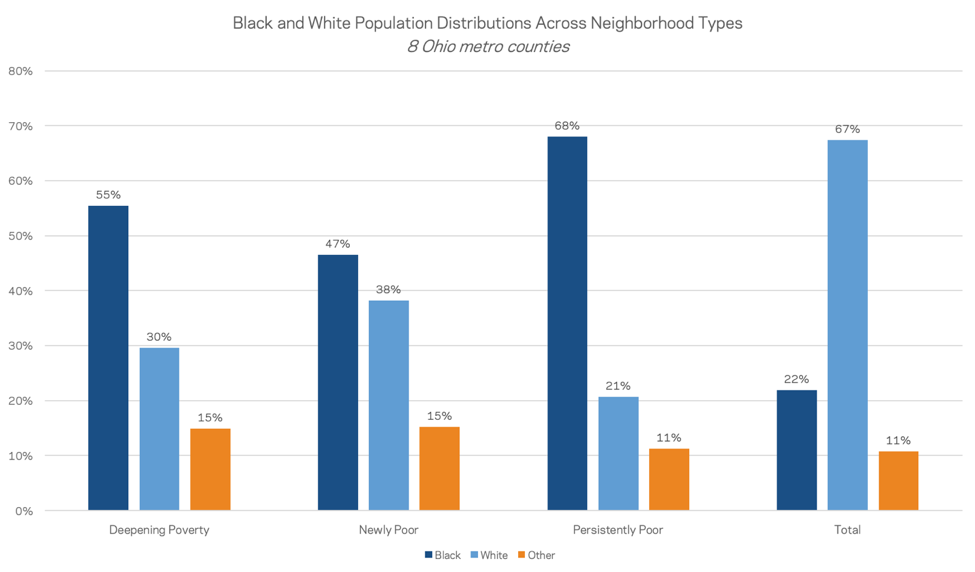
Finding #6: Black households are most affected by neighborhood poverty
Black households are disproportionately likely to live in areas of high poverty compared to whites.
While 22 percent of the population in these eight counties is Black, Black residents comprise 68 percent of the population in persistently poor neighborhoods, 55 percent in those with deepening poverty, and 47 percent in newly-poor neighborhoods.
By comparison, while 67 percent of the population in these eight counties is white, whites comprised 21 percent of the population in persistently poor neighborhoods, 30 percent in those with deepening poverty, and 38 percent in newly-poor neighborhoods.
Across all 8 counties, Black residents were more than five times more likely to live in high poverty neighborhoods than white residents.
—
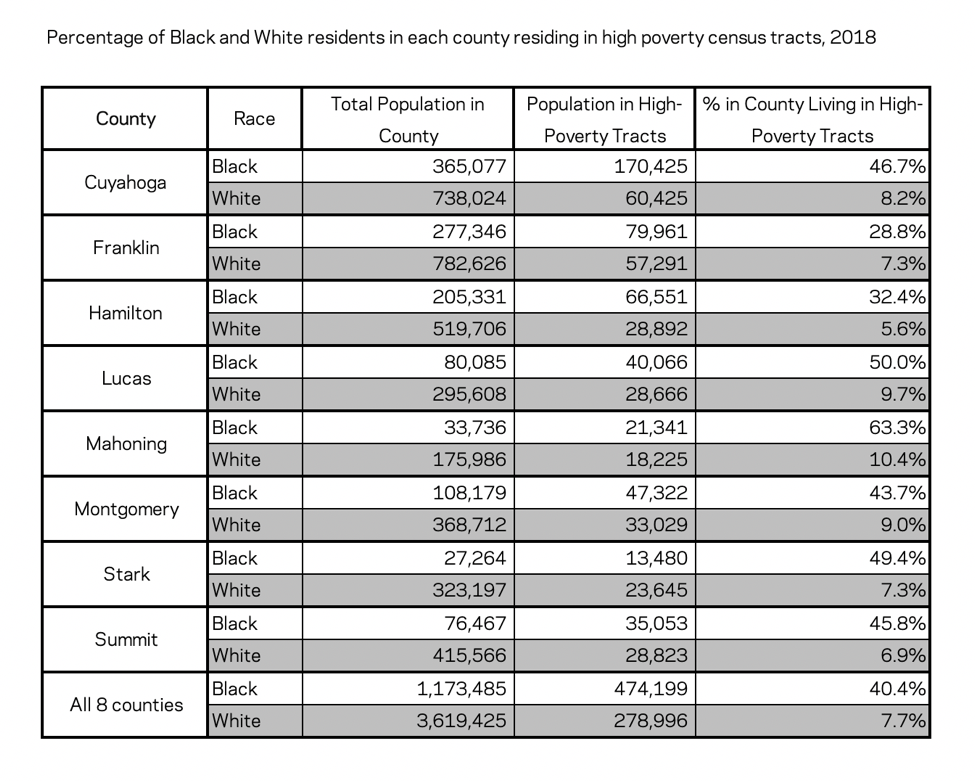
Majority-Black neighborhoods face a particular disadvantage, highlighting how race, place, history, and inequality continue to shape Rust Belt neighborhoods. Majority-Black neighborhoods in 1980 were especially likely to either be poor then or fall into poverty over time. Of the 94 majority-Black census tracts in Cuyahoga County in 1980, for example, 36 were considered high poverty at the time. By 2018, 35 more had fallen deep into poverty.
Come 2018, 62 percent of majority-Black census tracts across all eight counties were considered high poverty. At the extreme, 24 of Lucas County’s (Toledo) 27 majority-Black census tracts were high-poverty in 2018.
Finding #7: High-poverty neighborhoods have lost significant economic ground, and look increasingly less like the counties in which they are located
Between 1980 and 2018, the poverty rate increased from 25 percent to 42 percent in these 369 high-poverty neighborhoods; population decreased by 33 percent; and the white population decreased from 52 percent to 32 percent.
That 42 percent poverty rate is over two-and-a-half times what it is in these eight large urban counties as a whole (16 percent).
While these high-poverty neighborhoods lost one-third of their population since 1980, the total population of these eight counties has remained unchanged since 1980. Overall, their population declined a barely-perceptible 0.01 percent.
While two-thirds of the population of these high-poverty neighborhoods belong to a minority group, two-thirds of the population in these eight large urban counties is white.
What does this mean?
The trends in Ohio’s cities over the past four decades are unlike those frequently discussed in national press or urban punditry. Ohio has not witnessed sky-high urban housing prices, gentrification and displacement of low-income residents, or battles between NIMBYs and YIMBYs over single-family zoning.
Instead, we are seeing persistent suburban sprawl and urban disinvestment, vacancy, and abandonment, which has hit many predominantly-Black neighborhoods the hardest.
Persistent and worsening poverty in Ohio’s large urban areas is a function of both the state’s relative economic decline as well as an unhealthy set of dynamics within each urban area. All of Ohio’s large urban areas, with the exception of Columbus, have lost significant economic ground relative to their national peers since 1980 as a result of macroeconomic trends such as globalization and the transition from a blue-collar manufacturing-based economy to a white-collar service-based economy.
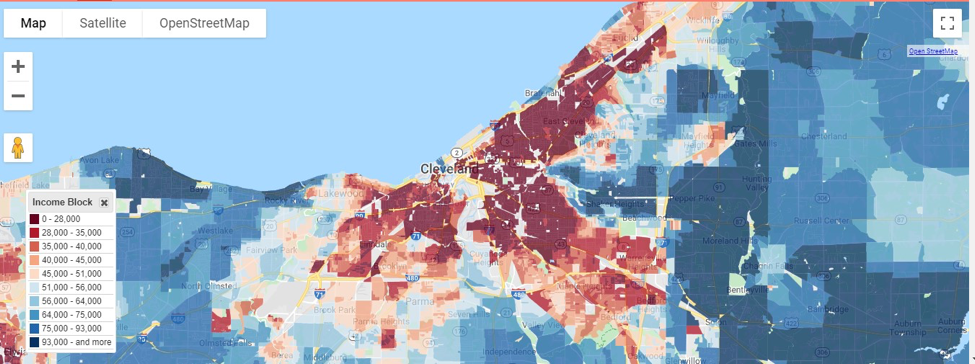
A simple comparison between metropolitan Cleveland and Washington, DC, shows what Ohio cities are up against. In 1960, median household income in Washington, DC, was 9 percent higher than Cleveland. In 2018, median household income in Washington, DC, was 82 percent higher than Cleveland.
Not only has the gap between these regions grown, but the geography of the economic gaps within these regions looks different as well. The map of Cleveland below estimates household income by block and provides clear visual evidence of the huge gap in incomes between the central city and the outer suburbs. The second expresses the same data at the same geographic scale in Washington, where there is far less of a gap between the central city and the outer suburbs and household incomes are much higher overall.
Source: justicemap.org
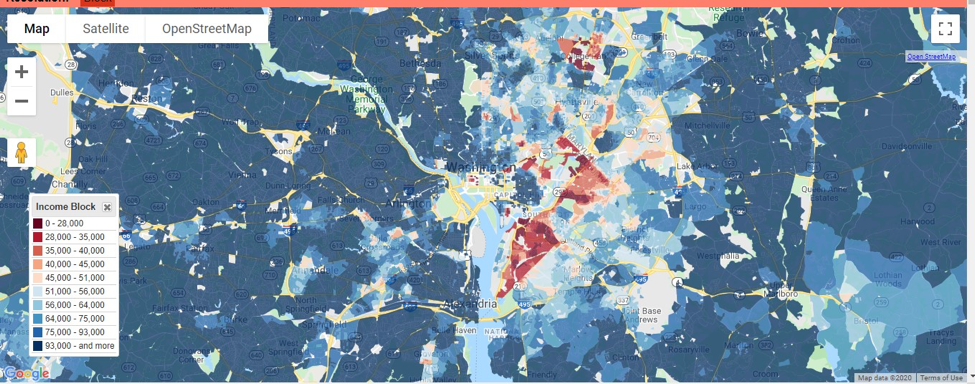
Source: justicemap.org
These macroeconomic national trends have been exacerbated by conditions within each metropolitan area. The eight large counties, in the aggregate, have the exact same population that they did in 1980, yet all of them have seen widespread suburban development, even as nearly all of their core city populations have actually declined.
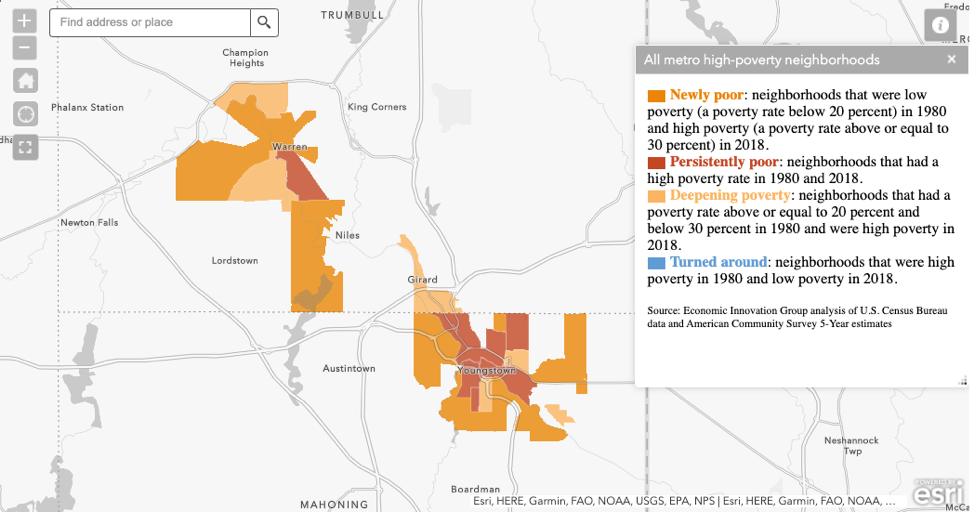
The divergence between Columbus – which has the best-performing high-end services economy in Ohio – and the remainder of the state’s larger cities has been significant. Since 1980, the population of Columbus has increased by 59 percent, while Cleveland, Cincinnati, Toledo, Akron, Dayton, Canton, and Youngstown have collectively lost 27 percent of their population – ranging from a high of 44 percent population decline in Youngstown to a low of 17 percent population decline in Akron.
Many neighborhoods in these cities (and increasingly their inner suburbs) experienced a pervasive and vicious cycle: population loss, which led to more poverty, disinvestment, and abandonment, which led to more population loss, and so on.
This pattern of disinvestment, abandonment, and outward growth is not just the result of the free market at work – it is aided by a wide array of public policies that help reinforce it, like transportation and economic development decisions. Even in a slow-growth, low traffic-congestion state like Ohio, billions of state and federal dollars have been spent on highway improvements to build job hubs in the outer suburbs, moving jobs and shopping opportunities further away from urban residents in cash-strapped cities. Meanwhile, these same residents have seen the infrastructure in their own neighborhoods crumble from neglect and disinvestment.
States would be well-advised to focus more of their efforts on place-based economic development that is not spatially-agnostic, and on transportation policies that support urban neighborhoods. Combining these efforts with policies focused on boosting local entrepreneurship and small business development can help bridge social and economic gaps and, ultimately, help create more opportunity in the legacy cities of the Rust Belt and nationwide.
Jason Segedy is the Economic Innovation Group’s inaugural Legacy Cities Fellow. You can learn more about EIG’s Legacy Cities Fellowship and Jason’s background here.