By Daniel Newman
Spatial inequality plays out at many different scales, from neighborhoods all the way up to regions. Cities are no exception. In fact, cities constitute an especially important unit of analysis for understanding geographic inequality because the undercurrents that drive racial and economic segregation in the United States do not only lead Americans to sort into different neighborhoods, but increasingly into different local jurisdictions altogether. This matters because it perpetuates inequality via local and municipal governments, as some enjoy plenty—well-resourced schools, top-notch infrastructure, impressive amenities—while others contend with eroding tax bases, poor schools, and outsized spending on social services and policing in triaged attempts to mitigate the social problems that stem from pervasive distress.
Here EIG applies the methodology behind its Distressed Communities Index (DCI) to cities, or more specifically census-designated places, to better understand how well-being compares across the cities and towns we call home. Using the latest available data from 2014 to 2018, the DCI assesses local economic well-being by scoring places on seven different metrics of economic performance covering poverty, education, housing vacancy, work, incomes, job growth, and business openings. Each score is then ranked, and cities are placed into one of five even quintiles that range from prosperous to comfortable, mid-tier, at risk, or distressed. All cities with more than 50,000 residents went into the rankings, but here we discuss findings for only the 100 largest of them.
The results show that city-level prosperity is increasingly a Western phenomenon, as jobs and residents flock to burgeoning parts of the Southwest, Mountain West, and Texas in particular. At the same time, the country’s older distressed cities grapple with both economic challenges and the persistent stranglehold of systemic racial inequality.
Prosperity runs highest in many fast-growing parts of the West
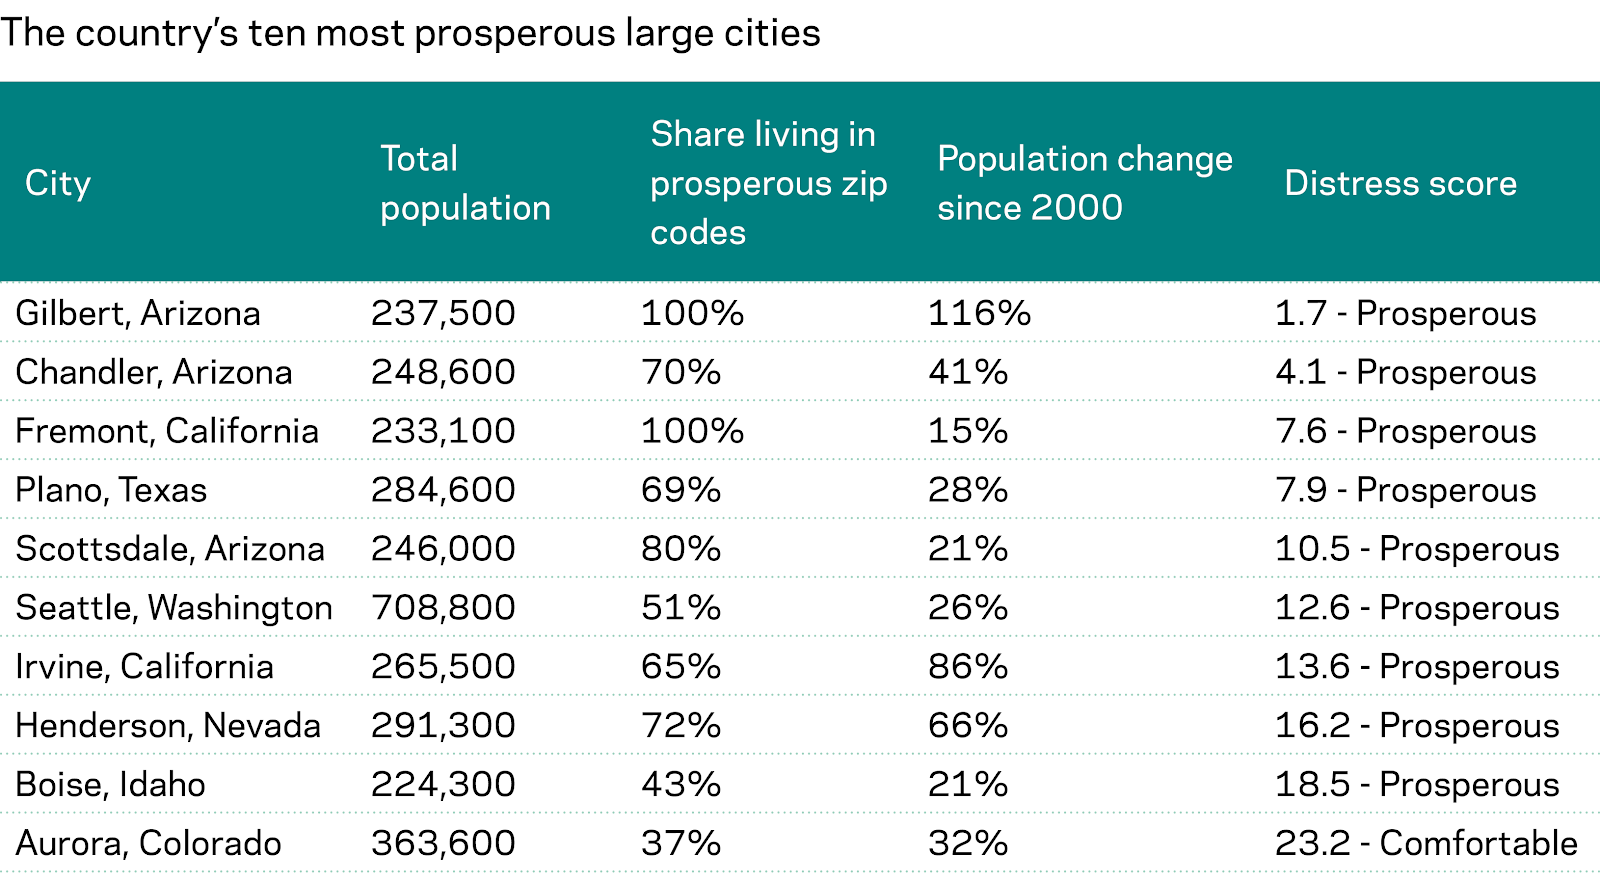
Prosperity among large cities is concentrated in the rapidly growing western half of the country: The 10 most well-off major cities are all part of western metropolitan areas. Not a single major city east of the Mississippi River ranks as prosperous.
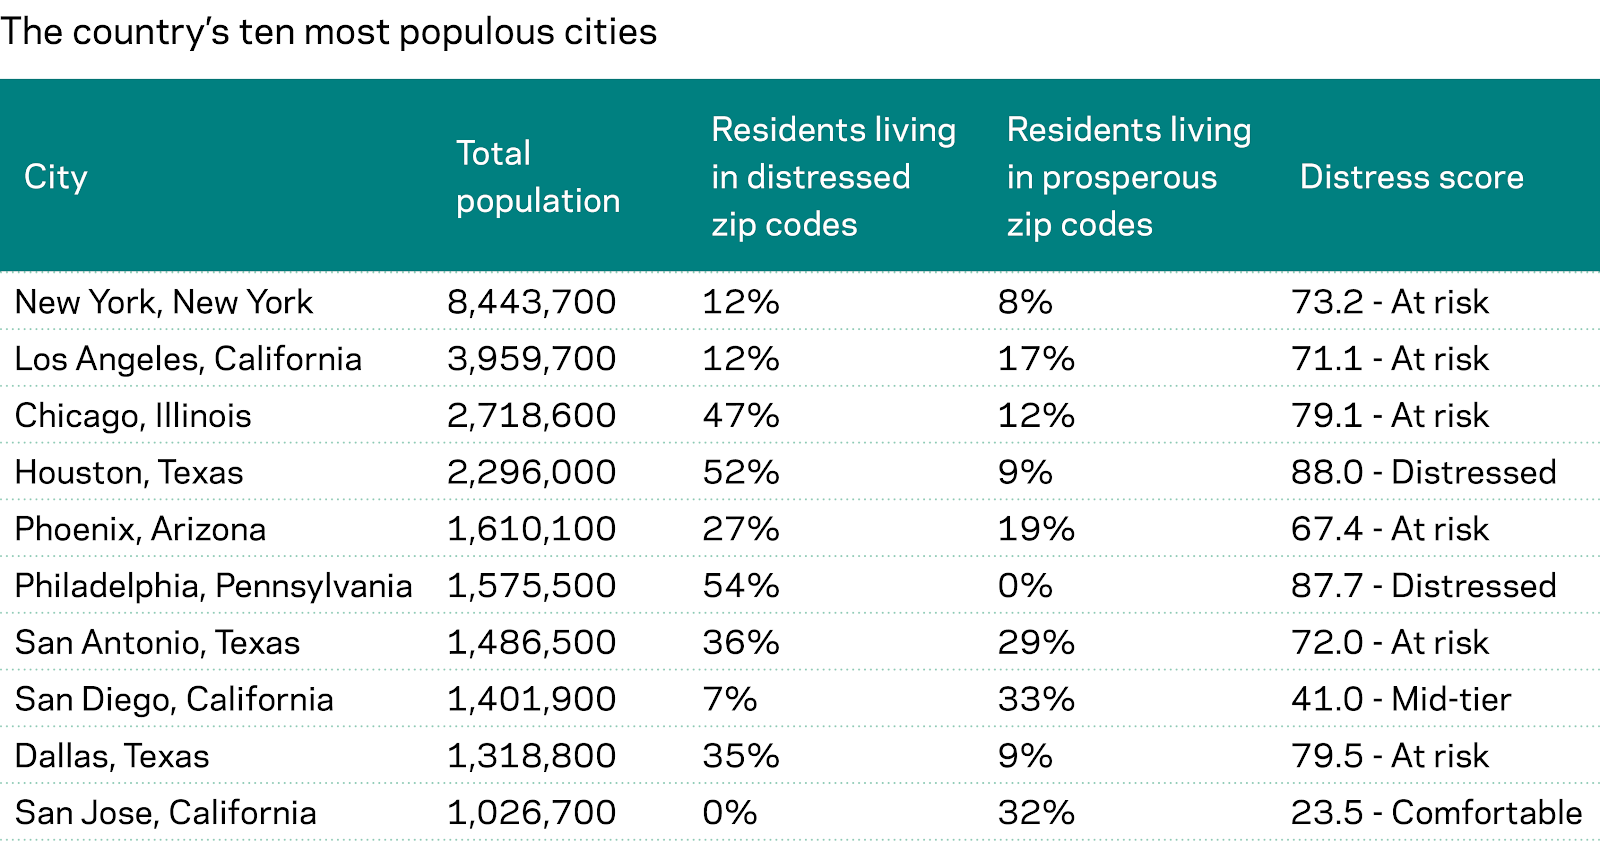
The absence of very populous places at the top of the rankings is notable and partially attributable to the special nature of the country’s very biggest cities, which contain greater socioeconomic diversity within their borders than some of the comparatively smaller and more homogenous, suburban-style cities that also count among the 100 largest places nationally. Despite the dominant economic output of cities such as New York or Los Angeles, residents in these places more frequently live in wildly divergent neighborhoods of wealth or poverty. As a result, the overall distress score for very populous cities can mask how economic well-being is spread across neighborhoods, and the share of residents living within prosperous or distressed zip codes can vary widely, even among cities in the same tier.
Suburban satellite cities, on the other hand, can run especially large in new and fast-growing parts of the West, while containing a much less diverse set of economic circumstances, which helps to boost their standing relative to other cities. Fewer suburban jurisdictions in the more fragmented eastern half of the country can match the population of their western peers, which is why relatively few appear in the top 100.
But where large fringe jurisdictions do include enough people to make the cut, prosperity often abounds. Eight of the 10 most well-off large cities in the country are suburban centers within larger metropolitan networks. Some of them, such as Plano, TX, or Irvine, CA, serve as business hubs in their own right. Among the top performers, only Seattle, WA, and Boise, ID, serve as the primary core of their metro areas.
This western and suburban success is evidenced by the two most prosperous large cities in the country—Gilbert, AZ, and Chandler, AZ—which are located just outside the limits of Phoenix, AZ. With booming and highly-educated populations, businesses and jobs have poured into these communities and similarly-situated peers throughout the West. Despite much of the Valley of the Sun’s affluence, its central city of Phoenix lags far behind in the at risk quintile, a standing in which the greatest number of large cities find themselves. This trend is common across much of the country: large central cities struggle comparatively as their broader metro regions thrive.
A clear trend among the top performers is the close link between population growth and prosperity, as people are drawn to local lifestyles and the economic benefits of living in and around productive cities. As a result, these places tend to be some of the country’s newest and fastest-growing magnets of new residents. Since 2000, the prosperous tier of cities averaged a stunning 47 percent growth in population, and in top-scoring Gilbert, AZ, the population more than doubled. Jobs in these places often require a college degree, leading to 51 percent of residents in prosperous cities having graduated from college on average.
Economic distress still prevails among legacy cities
Despite these bright spots, most large American cities find themselves struggling relative to their newer, more vibrant peers. The 23 large cities that land into the distressed quintile are typically stricken by long-term, structural economic problems or are struggling under the weight of long histories of racial and economic segregation—often, they face both. At the tail end of the spectrum, legacy cities such as Cleveland, OH, and Baltimore, MD, typify urban distress.
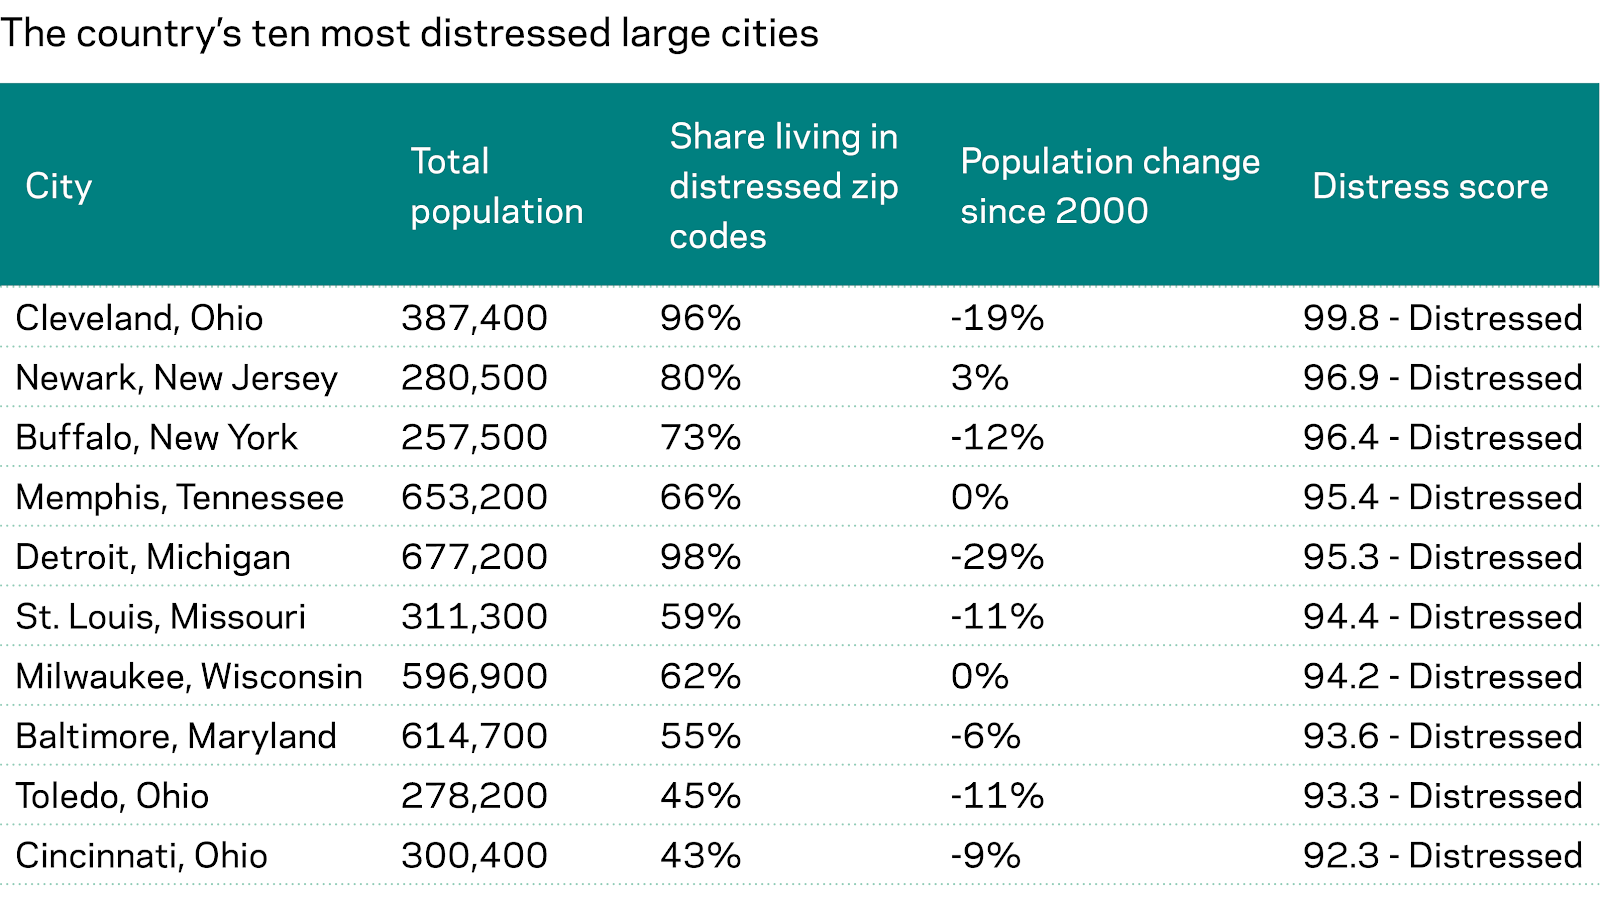
Unlike prosperous cities, distressed cities can be found in every region of the country, but they are most prevalent in the Midwest, South, and Mid-Atlantic regions. Many share a common struggle in transitioning from an economy based on legacy industries (often manufacturing) to a more advanced, knowledge-based one. Educational attainment often lags significantly: only 27 percent of residents of distressed large cities hold a college degree on average. Even large Sun Belt cities are not immune to extreme distress. Houston, TX lands solidly in the bottom tier as the most distressed city among the ten largest in the country, with more than half of its 2.3 million residents living in a distressed zip code—beating even Chicago, IL.
Many distressed and at risk cities struggle even as their suburbs thrive. Cleveland, OH, is a prime example of the urban-suburban inequality that pervades many metro areas. Cleveland trails all other large cities in terms of well-being, yet its distress is highly concentrated in the city itself, while its suburbs are a blanket of prosperity. An astonishingly high 96 percent of residents within the city limits live in a distressed zip code; that share drops to just 27 percent when including the entire metro area.
In stark contrast to the top performers, distressed cities have averaged a paltry 2 percent population growth over the course of the 21st century so far. Strikingly, nearly half of distressed cities have shrunk due to population loss. Six have lost more than 10 percent of their population since 2000: Detroit, MI; New Orleans, LA; Cleveland, OH; Buffalo, NY; Toledo, OH; and St. Louis, MO. Among those cities to have lost population, more than half of residents were left living in a distressed zip code on average.
Many of the country’s largest and most socioeconomically diverse cities fall in the middle of the spectrum
Outside of the extremes that exist across urban America, there is also a sizable group of cities with a broader mix of neighborhoods, income levels, and demographics that tend to fall towards the mid-tier and comfortable categories. These places tend to congregate highly educated workers and have enjoyed strong economic growth in the past decade, but they are also larger, more economically and racially diverse, and may have large immigrant populations as well. Such places like Washington, DC; San Diego, CA; and Atlanta, GA, contain a range of communities and economic circumstances that place them neither at the top nor the bottom of economic well-being.
This group represents a true patchwork of America’s cities ranging from 1.4-million-strong San Diego, CA, to relatively compact and suburban Arlington, VA. They also tend to be demographically diverse—just under half of these 36 cities are majority-minority. Most have recorded strong population growth in recent decades, and households earn slightly more on average than the median for their metro area. Central cities at the heart of Midwestern metro bright spots such as Columbus, OH, and Minneapolis, MN, stand out regionally by making it into this middle bracket, while most of their peers languish lower down the rankings.
Minorities remain much more likely to live in distressed cities
No matter where a place scores on the DCI, Americans’ exposure to community prosperity and distress remains profoundly divided along racial lines. Even though cities are generally among the most racially diverse places in the country (63 of the 100 largest cities are majority-minority), that diversity can be highly segregated and is not evenly distributed geographically or among the top and bottom tiers:
- Prosperous large cities are 60 percent white on average, while distressed places average only 36 percent.
- Just under one-third of cities in the leading prosperous and comfortable tiers are majority-minority, while 80 percent of cities qualify as majority-minority in the distressed and at risk tiers.
- The only two majority-minority cities in the prosperous tier are Fremont, CA, and Irvine, CA, both of which contain large shares of Asian residents.
Black communities in particular are disproportionately likely to be economically distressed, even in otherwise well-off metropolitan areas. Economic gaps across races and ethnicities are reinforced by residential segregation, which often walls off disadvantaged minority populations in struggling central cities or inner suburbs while whites and other affluent groups congregate in economically healthier suburbs. In general, the higher a city’s share of Black residents is, the greater likelihood that it qualifies as distressed. A startlingly high 36 percent of residents in distressed cities are Black on average, yet the average in prosperous cities is only 4 percent.
This tendency toward economic distress is particularly noticeable among a group of predominantly Southern and Midwestern cities like Detroit, MI, and Baltimore, MD, where at least one-third of residents are Black. Only a handful of places with relatively large Black populations score outside the distressed or at risk quintiles and stand out as exceptions to this trend: Washington, DC; Atlanta, GA; Durham, NC; and Charlotte, NC. These cities retain many race- and place-based inequalities but also share a reputation as hubs of Black opportunity, at least for some.
Many majority-Black, urban areas bear the scars of a long legacy of barriers to economic opportunity through policies like redlining, restricted access to job opportunities, and neighborhood upheaval under the guise of urban renewal. Such social and economic segregation comes at great cost. To consider just one way in which it perpetuates disadvantage by limiting wealth accumulation for Black households: In the typical majority-Black urban zip code in the United States, the average median home value was $150,800 in 2018 compared to $360,700 in a comparable majority-white community.
The landscape of economic well-being in America’s major cities is a view of both optimism and concern. EIG’s report accompanying this year’s launch of the DCI, “The Spaces Between Us,” shows that many of these trends replicate themselves neighborhood by neighborhood and throughout states across every region of the country. To examine how spatial inequality plays out in your community, explore the interactive maps at https://eig.org/dci/interactive-map.