Key takeaways:
- The first phase of Opportunity Zones implementation is now complete: The U.S. Treasury Secretary has now certified the census tracts nominated by the governor of every U.S. state and territory and the mayor of Washington, D.C. For the next ten years, private investors will be eligible for certain tax benefits in return for investing in these low-income communities.
- Governors tailored their selections to the needs and potential of their communities. They relied heavily on public and local government engagement, rigorous analytics, peer-learning, and interagency collaboration to determine their zones.
- Governors prioritized higher-need places. Zones have an average poverty rate of nearly 31 percent, well above the 20 percent eligibility threshold, and an average median family income of only 59 percent of its area median, compared to the 80 percent eligibility threshold.
- Selected tracts have high need as well as proven growth potential. The country’s Opportunity Zones already contain 24 million jobs and 1.6 million places of business. Many can harness some positive momentum as well: Three-quarters of zones are located in zip codes that experienced at least some level of post-recession employment growth from 2011 to 2015.
- Less than 4 percent of zones have recently experienced high levels of socioeconomic change, a proxy for gentrification and displacement risk. The average Opportunity Zone’s housing stock has a median age of 50 years, more than ten years older than the U.S. median—a sign that many of these neighborhoods urgently need reinvestment.
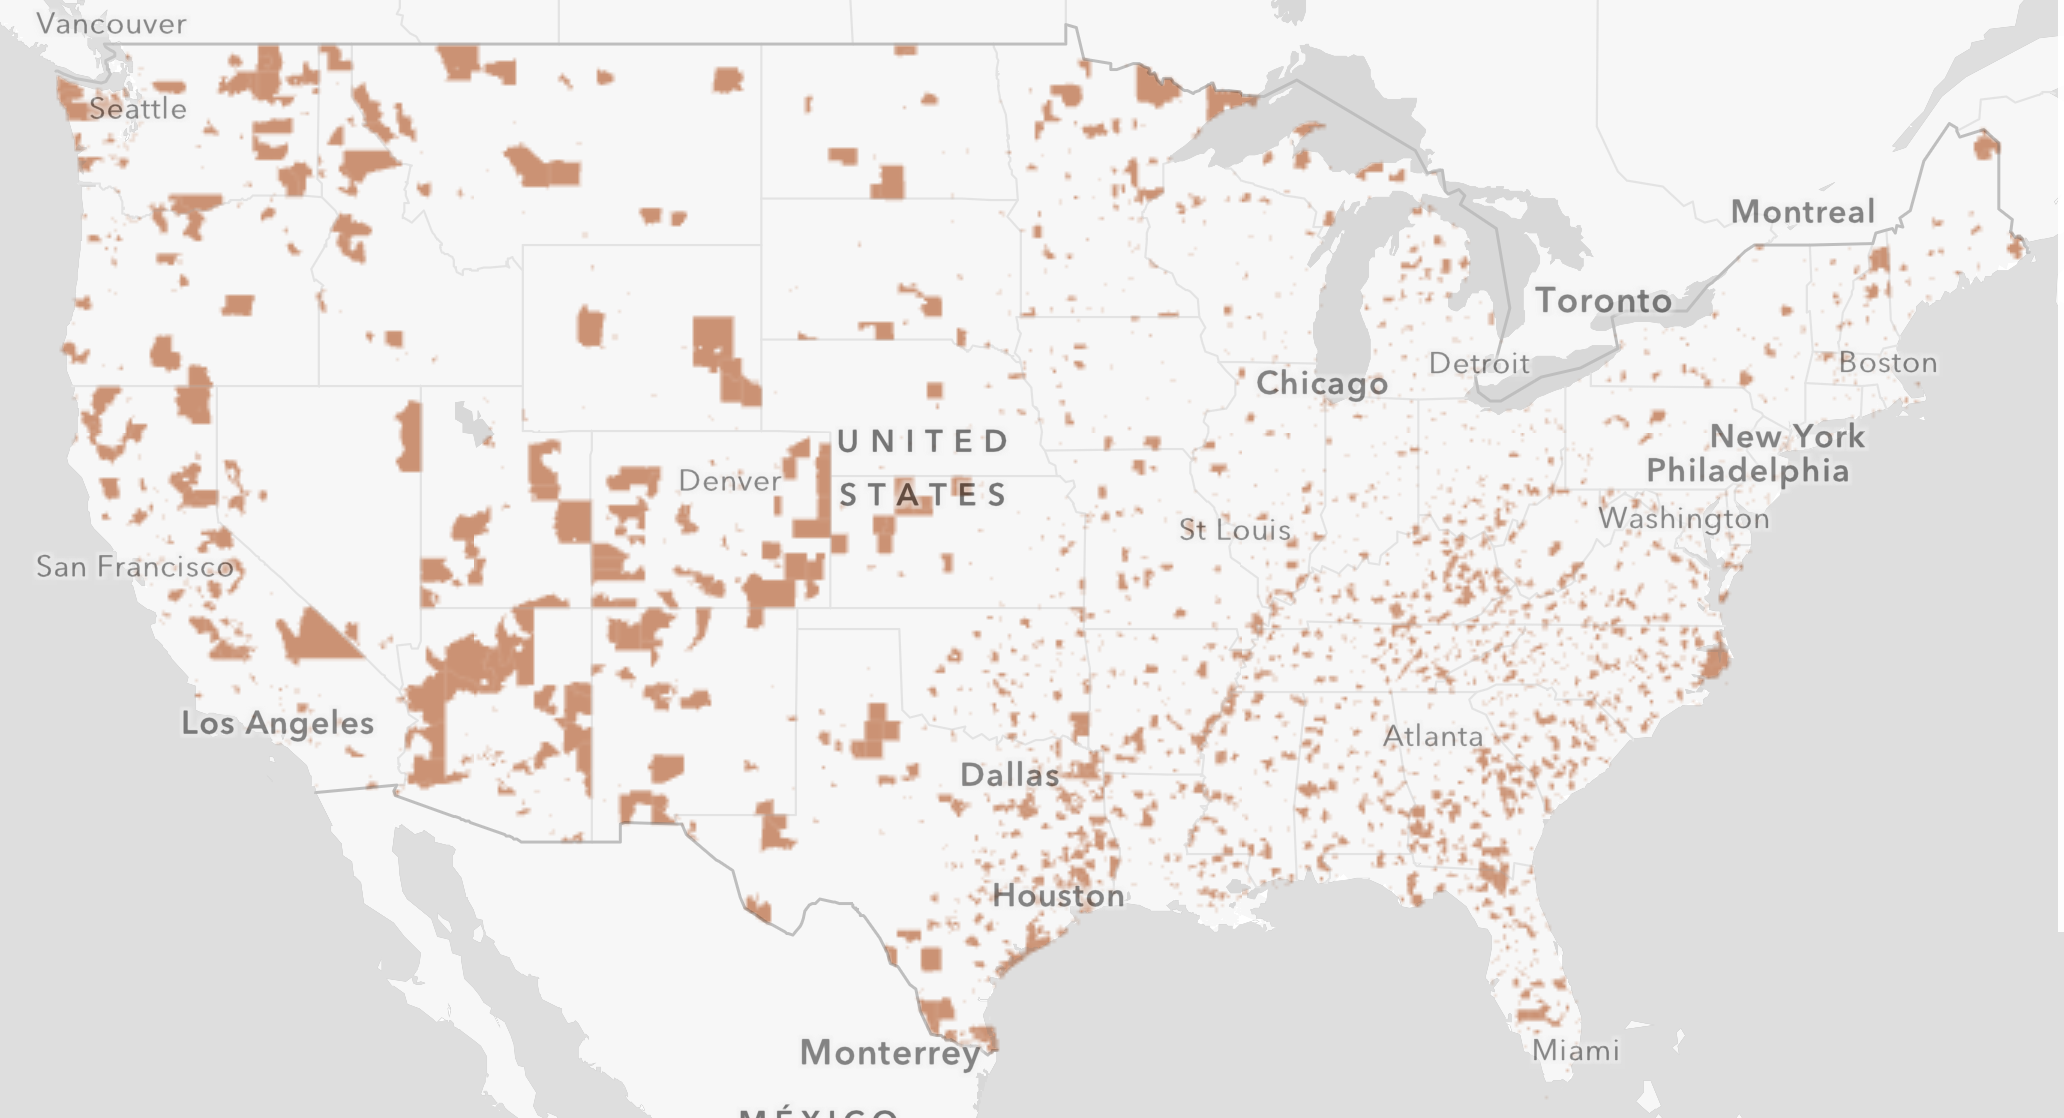
It’s official: The national map of Opportunity Zones is now in place. On June 14th, the Department of the Treasury certified the final round of states’ nominations, bringing the total number of qualified census tracts to more than 8,700 across all states, territories, and the District of Columbia.

(Click to explore map)
Recent economic growth has too often bypassed the kind of communities where Opportunity Zones are found. Now, thanks to a new provision of the tax code, investors willing to take a risk on these domestic emerging markets will get a series of benefits tied to the longevity of their investments. If the policy is successful, it will help seed the next generation of enterprise and opportunity in the country’s left-behind locales.
In one of the country’s boldest recent experiments in federalism, Congress called on the chief executives of every state and territory (henceforth “governors”) to nominate up to a quarter of the low-income communities (LICs) in their jurisdictions as Opportunity Zones. The challenge was for governors to identify places with clear needs, but also clear capacity to attract and absorb new investment—places where an incentive for private capital could catalyze a broader economic turnaround if combined with the right local strategies.
The results show that governors embraced the task, adapting the selection process to their own unique circumstances in order to strike a delicate balance between need and opportunity at the local level.
What does the average Opportunity Zone look like?
Within the 50 states and D.C., Opportunity Zones are home to 31.3 million people (all figures reported here are sourced from the American Community Survey’s 5-year estimates for 2011-2015, the dataset that determined a census tract’s eligibility). The figure rises to 35 million including Puerto Rico and the other territories. Fifty six percent of Opportunity Zones residents in the 50 states plus DC are minorities, compared to 54 percent of the population of all LICs and 38 percent for the country as a whole. Over three-quarters of certified tracts lie within metropolitan areas, but Opportunity Zones are nearly evenly split between high density (urban) zip codes and low density (rural) ones, with the remaining 22 percent in medium density (suburban) communities. Many states included explicit set-asides for tribal areas, resulting in 294 Opportunity Zones that contain Native American lands—proportional to their share of all eligible LICs (this definition is slightly broader than exclusively tribal census tracts, which the Urban Institute studied).
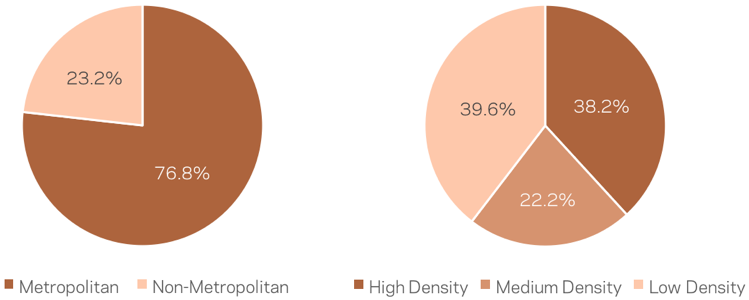
Source: EIG analysis of American Community Survey data
The statute established a national baseline of eligibility for Opportunity Zones designations based on economic need. Governors, however, treated the federal LIC eligibility criteria as only a starting point in determining their selections. The designated Opportunity Zones across the 50 states and D.C. have an average poverty rate of nearly 31 percent, well above the 20 percent eligibility threshold and nearly four points higher than the average across all LICs. Adjusting for tracts with high populations of college students, which sometimes skew data, still results in an average poverty rate of 30 percent. Median family incomes also underscore the emphasis states placed on need: The average Opportunity Zone has a median family income equal to only 59 percent of its area median, compared to the 80 percent eligibility threshold. On average, the unemployment rate in these communities is 14.4 percent, and 38 percent of prime age adults are not working—a figure that is nearly 10 points higher than the country as a whole.
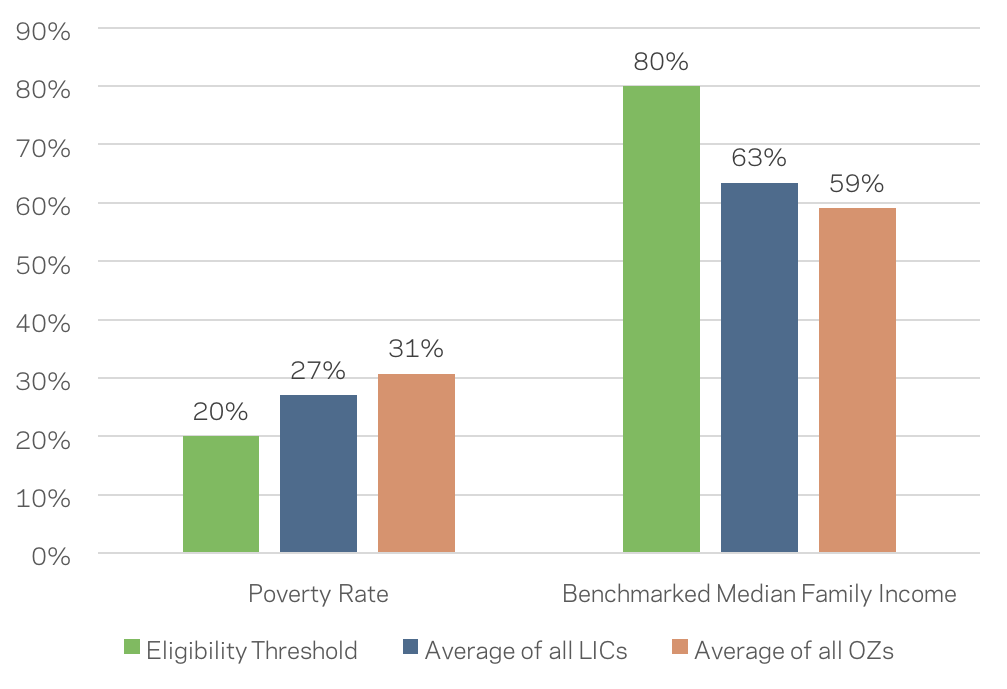
Source: EIG analysis of American Community Survey data (2011-2015 5-year estimates)
Furthermore, 69 percent of the population in Opportunity Zones resides in a census tract that is “severely distressed” according to the CDFI Fund, meaning in a community with especially high poverty or unemployment rates, or especially low median family incomes. In Florida in particular, nearly 94 percent of Opportunity Zone residents live in such a tract, and in Georgia, that number spikes to over 99 percent.
Because of the wide latitude afforded governors in the selection process, some observers worried they would simply target already-gentrifying areas that had little need for a new incentive to attract investment. However, less than four percent of Opportunity Zones experienced high levels of socioeconomic change from 2000 to 2016, according to a dataset developed by the Urban Institute. A number of states took Urban’s dataset into account when vetting zones, and Oregon created its own indicator of gentrification pressures. In fact, the average Opportunity Zone’s housing stock has a median age of 50 years, more than ten years older than the U.S. median. Half of Opportunity Zones are also communities eligible for the Low-Income Housing Tax Credit. And more than two-thirds contain brownfield sites tracked by the Environmental Protection Agency. These results speak to the widespread and urgent need for reinvestment across the nation’s Opportunity Zones, and should allay many of the initial concerns about the potential for displacement of local residents.
While governors clearly emphasized need, they also sought tracts with real potential for revitalization. The country’s Opportunity Zones are presently home to 24 million jobs and 1.6 million business establishments according to ESRI’s Business Data. These figures establish a critical baseline against which success can be measured down the road. And there is real reason for optimism: 75 percent of Opportunity Zones are located in zip codes that experienced at least some level of employment growth from 2011 to 2015, and 64 percent in zip codes with increases in business establishments over the period. Opportunity Zones can help add greater momentum and reach to these fragile local recoveries.
How did state leaders select Opportunity Zones?
EIG conducted a survey to memorialize how each state went about selecting its zones. Responses from 41 state officials involved in the selection process were augmented with information gleaned from press releases, websites, and other sources to produce the most complete assessment yet of how this new map of Opportunity Zones took shape.
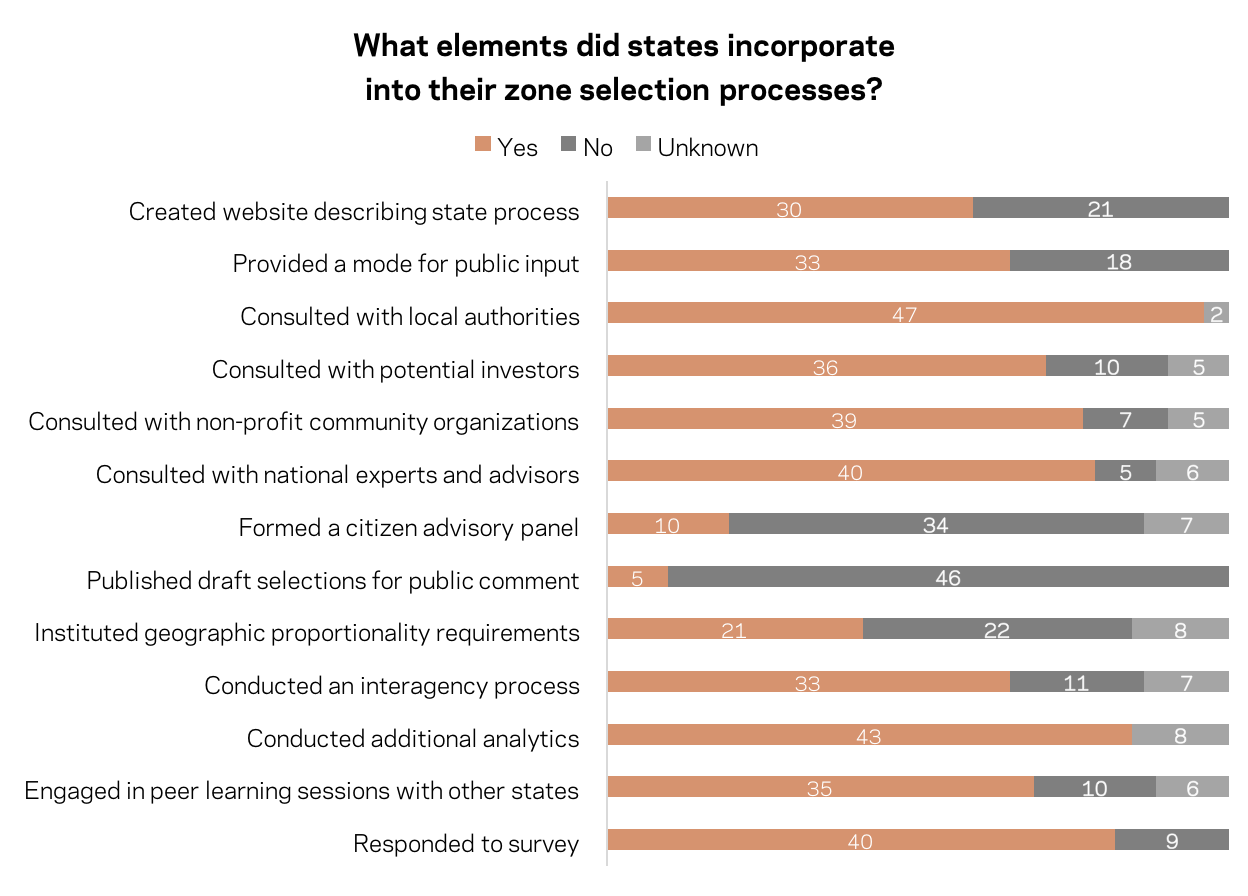
States consulted extensively with their municipalities, counties, and local and regional economic development organizations. It appears that every state augmented the baseline eligibility criteria with additional data analytics customized around their own priorities (Colorado was an early mover, and its rigorous data-informed approach to balancing need and opportunity served as a model for several others). States varied more on public transparency: 29 states plus DC stood up a website that described in varying degrees of detail the governor’s selection process. 32 states plus DC provided some sort of portal, application, or email address to solicit public input. California, DC, Michigan, Nevada, and Vermont set the gold-standard for transparency by releasing draft recommendations to the public for comment before making submissions to the Treasury Department. In the case of California, this led to a fifth of their initial recommendations being overturned.
At least 10 states (e.g. Indiana) stood up some sort of external advisory panel of citizens or public leaders to vet final recommendations. We estimate that two-thirds of states engaged in an interagency process (involving the economic development, workforce, and housing departments, for example). The vast majority consulted with national experts, advisors, and peers as well.
States took various approaches to balancing the geographic distribution of zones. Just under half of states appear to have established strict proportionality rules that every county with an eligible tract would receive at least one, for example. A handful of states took a different approach, standing up competitive application processes that only awarded the most intentional and strategic local plans with zones (e.g. Iowa). Several anchored their selections in overarching visions—of revitalizing Gateway Cities in Massachusetts, for example, or of galvanizing rural entrepreneurship in several western states. Michigan and New York took care to align their Opportunity Zones behind the considerable investments the states are already making to revitalize communities. New Jersey’s Department of Community Affairs saw the chance to support sustainable transit-oriented development and improve access to job centers.
While the quality of the process matters more than the quantity of elements incorporated into it, the diversity of elements governors incorporated speaks to a thoughtful and rigorous process to identify their Opportunity Zones.
Next steps: Turning Opportunity into Reality
Looking forward, the action now shifts to engaging the marketplace and recruiting investment. Treasury and the Internal Revenue Service must issue technical rules and guidance to give investors additional clarity. State and local leaders must develop comprehensive strategies for nurturing a new market around a new asset class—their Opportunity Zones—to take shape. They should work in tandem with investors and fund managers, entrepreneurs and business owners, anchor institutions, property developers, philanthropies and community stakeholders to help a new Opportunity Zone investment ecosystem emerge. The tool is now in hand and the map is now in place, but the work is just beginning.