Note: This blog was updated on November 9, 2020 to reflect newly available election results data. The updated figures and text do not significantly differ from the original post.
By Jimmy O’Donnell
Although the results for the 2020 Presidential election are still being counted in some key swing states, a few interesting trends have emerged from the currently available data. One of these early trends has to do with the difference in the recent economic performance of counties that voted for former Vice President Joe Biden and those that voted for President Donald Trump. Counties that went to Biden enjoyed slightly stronger economic growth on average in the two years prior to the pandemic but were hit harder economically during the pandemic.
Crossing county-level election results with data from the Quarterly Census on Employment and Wages (QCEW), we find that former Vice President Biden won counties that exhibited stronger recent economic growth than the counties won by President Trump. In particular, we looked at how dynamic the counties were between 2018–20 by analyzing (1) the average change in total employment, (2) the average change in the total number of establishments, and (3) the average change in weekly wages. The results—showing the national average, the average for Biden-won counties, and the average for Trump-won counties—are shown below.
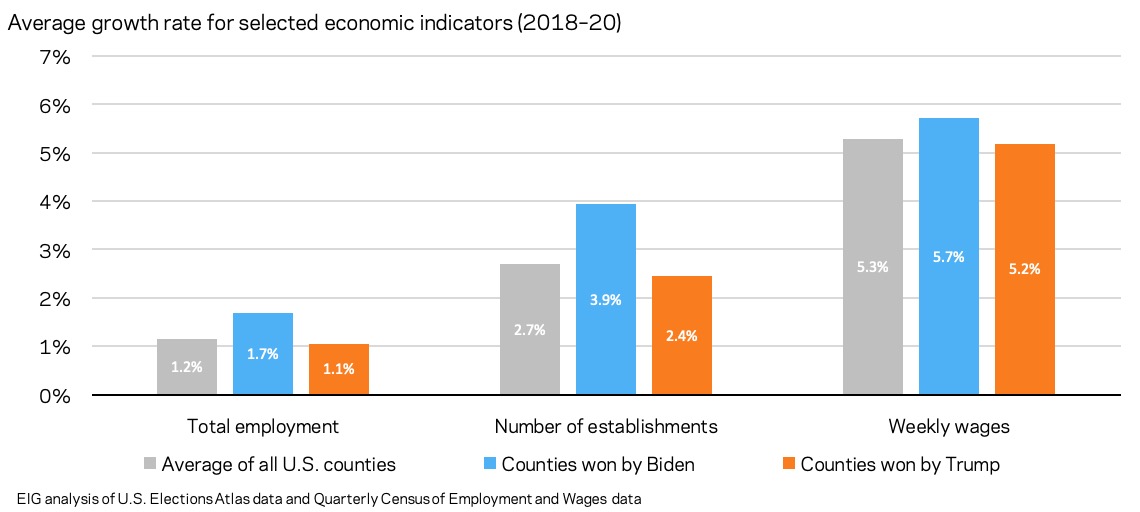
Between February 2018 and February 2020 (the two-year period right before the pandemic hit), the national average for county-level employment growth was 1.2 percent. For counties won by former Vice President Biden, average employment growth was 1.7 percent, and for those won by President Trump it was 1.1 percent.
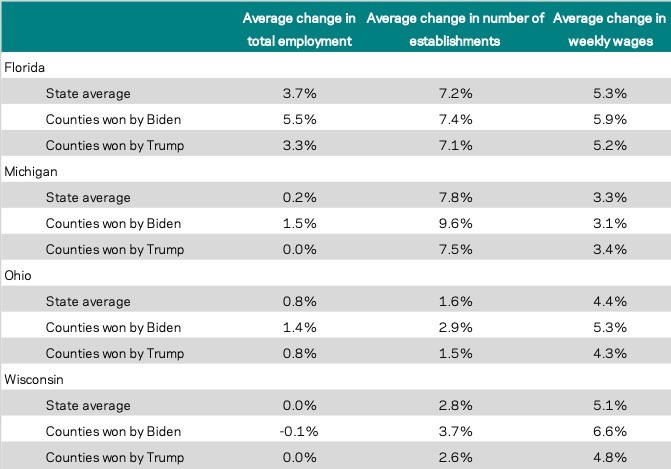
The divide in economic performance is starker though when looking at growth in total establishments and weekly wages. Between 2018Q1 and 2020Q1, U.S. growth in total establishments was 2.7 percent. In counties that former Vice President Biden won, the average growth in establishments was 3.9 percent, whereas average growth was only 2.4 percent in counties won by President Trump. For wages, the average county-level growth was 5.3 percent. In Biden-won counties, workers saw an average increase of 5.7 percent, while workers in Trump-won counties only experienced a 5.2 percent bump. As shown below, these trends also hold true for several key swing states that have already been called: Florida and Ohio (both of which Trump won) as well as Michigan and Wisconsin (both of which Biden won).
Interestingly, there is also preliminary evidence that Biden performed better in counties that were hit harder at least in economic terms by the COVID-19 pandemic. The economic performance indicators used above show the growth in establishments, employment, and wages between 2018Q1 and 2020Q1, which ended in March 2020 right before the pandemic went into full swing. Below is a graph showing the average unemployment rate in August 2020 for all U.S. counties, counties won by Biden, and counties won by Trump. We break it out between (1) the average unemployment rate in August 2019, and (2) the percentage point increase in the unemployment rate between August 2019 and August 2020 for the average county in the group.
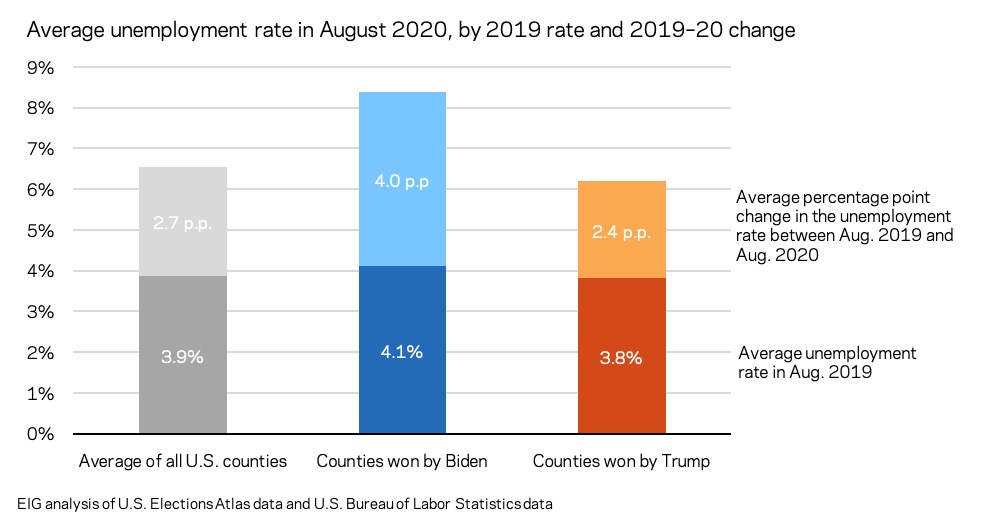
By doing so, we show that counties won by Biden had a slightly higher average unemployment rate in August 2019 (4.1%) compared to the national average (3.9%) and counties won by Trump (3.8%). Counties won by Biden went on to experience a higher average percentage point increase in their unemployment rates as well (light shaded bars). This trend is in line with recent research showing that Democratic areas have suffered larger COVID-related job losses than Republican areas.
In all, it appears that former Vice President Biden performed well in counties that prior to the pandemic were experiencing stronger growth in employment, business establishments, and wages, and during the pandemic have been hit particularly hard. The analysis shown here is likely a downstream effect of the fact that former Vice President Biden did better in major metropolitan areas, while President Trump won counties outside these urban centers.
Interested in exploring how socioeconomic trends played out across the 2020 election map? Reach out to us with your questions and suggestions at [email protected].