by August Benzow
Just one quarter of all metro areas added jobs year-over-year at or above the national rate in December 2022; only half have recovered jobs lost during the pandemic.
Key findings
- Just one quarter of metro areas added jobs year-over-year at least as fast as the national rate in December 2022, and only 12 percent (44 metro areas) significantly exceeded the national rate of employment growth.
- Among large metro areas, nine of the top 10 for employment growth were in the Sun Belt. Portland, OR, rounded out the group.
- Dallas-Fort Worth saw the biggest percentage increase in jobs from December 2021 to December 2022 and the second highest absolute increase in jobs year-over-year after New York City.
- No metro areas in the Mountain West added jobs faster than the national rate year-over-year in December 2022—a surprising slowdown for a typically high-growth region.
- The Salt Lake City metro area is the most stark example of this slowdown in the Mountain West: it added jobs year-over-year in December 2022, but at a rate slower than legacy metro areas like St. Louis.
- Several populous coastal tech hubs registered stronger annual job growth than the national rate in December, including Seattle, Portland, San Jose, San Francisco, and Boston; however, the latter two still have not reached pre-pandemic employment levels.
The lowest unemployment rate in over half a century in January 2023 is obscuring uneven growth across U.S. metro areas. Based on the latest employment estimates for metro areas, nearly all added jobs year-over-year in December 2022, with just four percent losing jobs. However, just one quarter of metro areas added jobs at least as fast as the nation in December 2022, and only half have returned to pre-pandemic employment levels. Nearly two-thirds of metro areas that outpaced the rest of the country were in the Sun Belt with coastal metro areas making up most of the remainder. The metro areas of the Mountain West, which saw some of the fastest growth in the country before the pandemic, mostly tracked closely with the national rate of employment growth. Meanwhile, the country's heartland continues to lag far behind the rest of the country, with no signs of this trend improving: just five legacy metro areas added jobs faster than the rest of the country, compared to 92 that saw growth below the national rate.
Large Sun Belt metro areas had the biggest job gains, while legacy metro areas saw sluggish growth
Among the 50 largest metro areas based on population, the top ten for employment growth were all Sun Belt metro areas with Portland, OR, as the lone exception. Dallas-Fort Worth saw the biggest percentage increase in jobs from December 2021 to December 2022 and the second highest absolute increase in jobs year-over-year after NYC with 234,700 jobs added. The economic strength of these Sun Belt metro areas is not a new trend, but the top ten list looked different ten years ago when tech hubs, like San Jose, CA and Denver, rose to the top, and Columbus, OH was a powerhouse in the Midwest, with Detroit not far behind. The hegemony of the Sun Belt in 2022—especially the rise of Florida metro areas, which didn't crack the top 10 list at all ten years ago—is a trend that established itself in the second half of the 2010s and is showing no signs of shifting course.
Among the ten metro areas with the slowest employment growth, the most surprising one is Salt Lake City, which before the pandemic was among the metro areas with the highest employment growth. In December 2019, Salt Lake City's year-over-year employment growth rate was double that of St. Louis at 4.8 percent; by December 2022, St. Louis's year-over-year employment growth rate was slightly higher than Salt Lake City's. While a multitude of factors may be dampening growth in Salt Lake City, two factors stand out: rising housing costs and a very tight labor market. The metro's home values are up by around $150k (a 38 percent increase) from before the pandemic [1] and its unemployment rate has sunk to 2.0 percent, one of the lowest rates nationally. [2] Neighboring Denver, which has an employment growth rate slightly above national rate, has a slightly higher unemployment rate of 2.8 percent and, although its home values are higher than Salt Lake City's, they have increased at a slower rate. Elsewhere, fast growth metro areas like Dallas-Fort Worth have home prices below the national median and much more labor market slack.
Legacy metro areas still in the red while those in Sun Belt post big increases
Metro areas in the Sun Belt experienced robust employment growth throughout the 2010s with year-over-year percent increases in jobs either comparable to or just below the tech-dominated metro areas of the Mountain West and West Coast. They were by far the most resilient to the economic shocks of the pandemic recession with a 5.1 percent loss of employment year-over-year in 2020 compared to 8.3 percent for the string of metro areas in the Northeast corridor. Although West Coast and Mountain West metro areas had the biggest percent increase in employment in 2021, they were climbing out of a deeper hole and only recovered 76 percent of jobs lost in the previous year, compared to 94 percent that were recovered by Sun Belt metro areas. Legacy metro areas lagged behind every other region throughout the 2010s, and even though they saw a slightly smaller percent loss in employment during the pandemic (than every region except the Sun Belt), they had the weakest growth in 2021. As with every region, 2022 year-over-year growth for legacy metro areas was still above the region's pre-pandemic baseline, but already sinking beneath average growth rates in the 2010s for Sun Belt and West Coast and Mountain West metro areas. These legacy metro areas will have to add nearly half a million jobs in 2023 to fully recover what they lost in the pandemic recession—an outcome that is in doubt given their sinking growth rates and population losses.
Most metro areas where employment growth outpaced the nation are in the Sun Belt
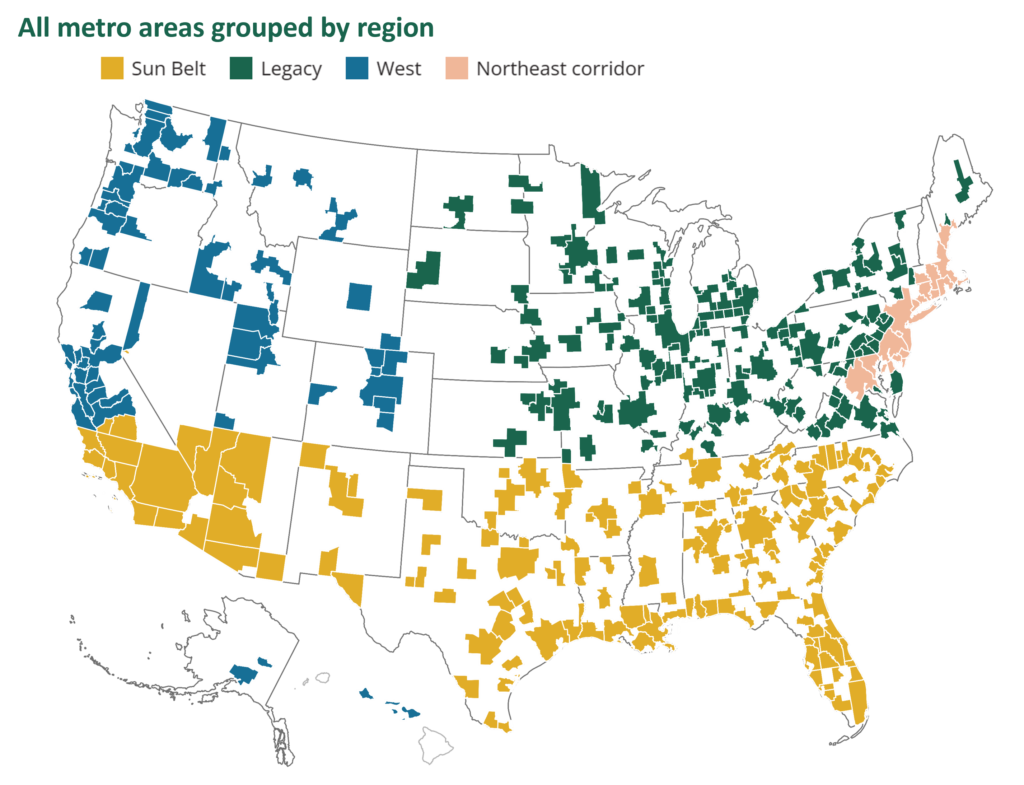
The unevenness of employment growth across the country can clearly be seen in the map below, which groups metro areas based on their employment growth relative to the national rate of 3.1 percent from December 2021 to December 2022. The smallest cohort is the elite group of 44 metro areas (12 percent of all metro areas) that added jobs at a rate at least one percentage point above the national rate. Collectively, these metro areas added 1.7 million jobs to the economy, or 36 percent of all new jobs in 2022. Slightly more jobs, 2 million, were added to the economy by the 160 metro areas (43 percent) that were on par with the national rate, meaning they added jobs at a rate within one percentage point of the rest of the country. The fewest jobs were added to the economy by the plurality of metro areas (178 in total) that were more than a percentage point below the national rate, with just a half million net jobs generated by these metro areas.
Large Sun Belt metro areas (a population above one million) were the economic powerhouses of 2022 with an average employment growth rate of 3.5 percent. None of these metro areas had a growth rate below the nation, with most significantly above that number. A few like Phoenix and Los Angeles were only on par with the national rate after experiencing slowing employment growth throughout 2022. Despite headline-grabbing layoffs in the tech sector, the country's biggest coastal tech hubs added jobs comfortably above the national rate, including Seattle, Portland, San Jose, San Francisco, and Boston, although the latter two still have not reached pre-pandemic employment levels. This robust growth was surprisingly absent from the Mountain West, where all of those metro areas, regardless of population size, were either on par with or below the national average. Although no large legacy metro areas added jobs faster than the national rate, a few smaller metro areas did with Lansing, MI, the largest example, joined by Harrisburg and neighboring Lebanon, PA, and Rapid City and Sioux Falls, SD.
Metro areas with employment growth below the national rate were concentrated in the Midwest and the Northeast. However, the sparsely populated states of Montana, North Dakota, and Wyoming were the only states where every metro area added jobs below the national rate. Louisiana and Mississippi both bucked the Sun Belt trend, and most metro areas in these states grew slower than the nation. Indeed, despite its concentration of large, rapidly growing metro areas, the Sun Belt has many examples of lagging metro areas, especially smaller ones scattered across the Deep South.
This disparity between legacy metro areas and both Sun Belt and Western metro areas is shown in stark relief by the total number of metro areas that were above, below, or on par with the national employment growth rate. Nearly 100 legacy metro areas had year-over-year employment growth rates in December 2022 that were below the national rate, more than double those that were on par with the national. By contrast, the majority of Sun Belt and Western metro areas fell into the on par category. Even though there are far fewer total metros in the Northeast corridor than there are legacy metros, nearly the same number were above the national rate. Sun Belt metros made up nearly two-thirds of metro areas that grew above the national rate. However, a high number of metro areas in this region added jobs more slowly than the nation. Albuquerque is the most populous example.
Surprisingly weak and strong performances within sectors highlight the economic complexities of the country's metro areas
The industry sectors that were hit hardest during the pandemic recession–leisure and hospitality, retail, and government–still have not returned to 2019 employment levels nationally three years on from the crisis. By contrast, professional and business services, information, and transportation and logistics have benefited the most from the shifts in the economy and have seen the highest rates of three-year growth in employment. At the metro level, these disparities between different sectors play out differently depending on the dynamics of a particular metro area's economy. San Francisco, for example, is close to recouping all the jobs lost during the pandemic recession, in no small part due to 11.7 percent growth in its information sector from 2019 to 2022. However, its leisure and hospitality sector is still down 15.8 percent from three years ago despite nearly 10 percent growth in 2022 alone.
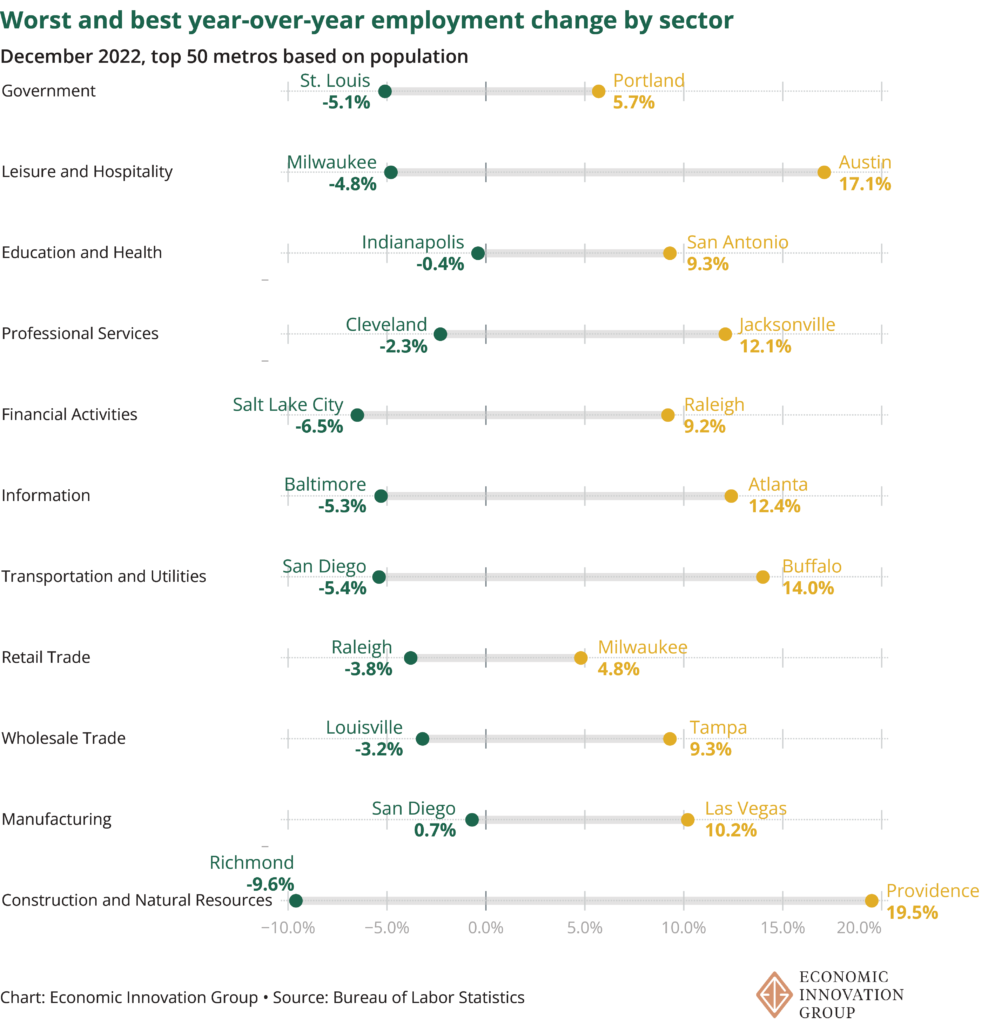
The retail trade sector saw the weakest national growth year-over-year in 2022 at just 0.4 percent. At that rate, it will take the sector several more years to return to its 2019 employment numbers. Among the country's 50 largest metros, 19 lost jobs in the retail sector year-over-year in December 2022, suggesting that the shift to online shopping during the pandemic may be a long term trend. Raleigh had the steepest loss of 3.8 percent, while Milwaukee had the highest gain of 4.8 percent. This is surprising given that Raleigh is among the top 10 metro areas for year-over-year employment growth, while Milwaukee is in the bottom 10.
Milwaukee is not the only struggling metro area with specific industry bright spots. Buffalo— which saw growth on par with the nation in 2022 but is still below its 2019 employment levels—posted a 14 percent year-over-year increase in transportation and logistics employment. The national strength of this sector helped Buffalo offset losses and weak growth in other sectors, and even more jobs are in the pipeline for the metro area. A similar story can be found in Providence, which can attribute around half of its employment growth to its impressive 19.5 percent growth in the construction and natural resources sector. Underperformance in one sector can of course have the same effect in the other direction. St. Louis's especially low total employment growth rate year-over-year can mostly be attributed to the nearly 8,000 government jobs it lost, a 5.1 percent decrease.
Conclusion
While lagging employment growth in legacy metro areas and booming economic expansions in Sun Belt metro areas is not a new trend, the latest data indicates that these trends have not only persisted, but intensified, in the wake of the pandemic. Even legacy metro areas that are seeing high employment growth relative to the rest of the country like Minneapolis still haven't returned to 2019 employment levels. There should be concern that some of these metro areas won't make sufficient gains in employment before the next economic downturn, especially if growth slows down over the next year.
Notes
- Zillow home value index, December 2019-December 2022.
- BLS Local Area Unemployment Statistics December 2022.
Region descriptions
Throughout this analysis, Sun Belt metros are defined as those below the 36°30' parallel. Using this boundary, metro areas from 15 states are categorized as Sun Belt. These states include Alabama, Arizona, Arkansas, California, Florida, Georgia, Louisiana, Mississippi, Nevada, New Mexico, North Carolina, Oklahoma, South Carolina, Tennessee and Texas. Some states, most notably California, are split by this boundary and consequently Los Angeles is considered a Sun Belt metro area, while San Francisco is considered a Western metro area. Western metro areas include those in northern California, Oregon, Washington, Alaska, Hawaii, Colorado, Utah, Wyoming, Idaho and Montana, and reflect the Census defined West region of the United States with the exclusion of Sun Belt metro areas. Most of these Western metro areas have in common a high cost of living, historically robust population growth, and a proliferation of knowledge economy jobs. Northeast corridor metro areas include metros in the Boston-Washington, DC corridor. Legacy metro areas include all of those in the Midwest, the mid-South, the Great Lakes region, and northern New England.