By Kenan Fikri
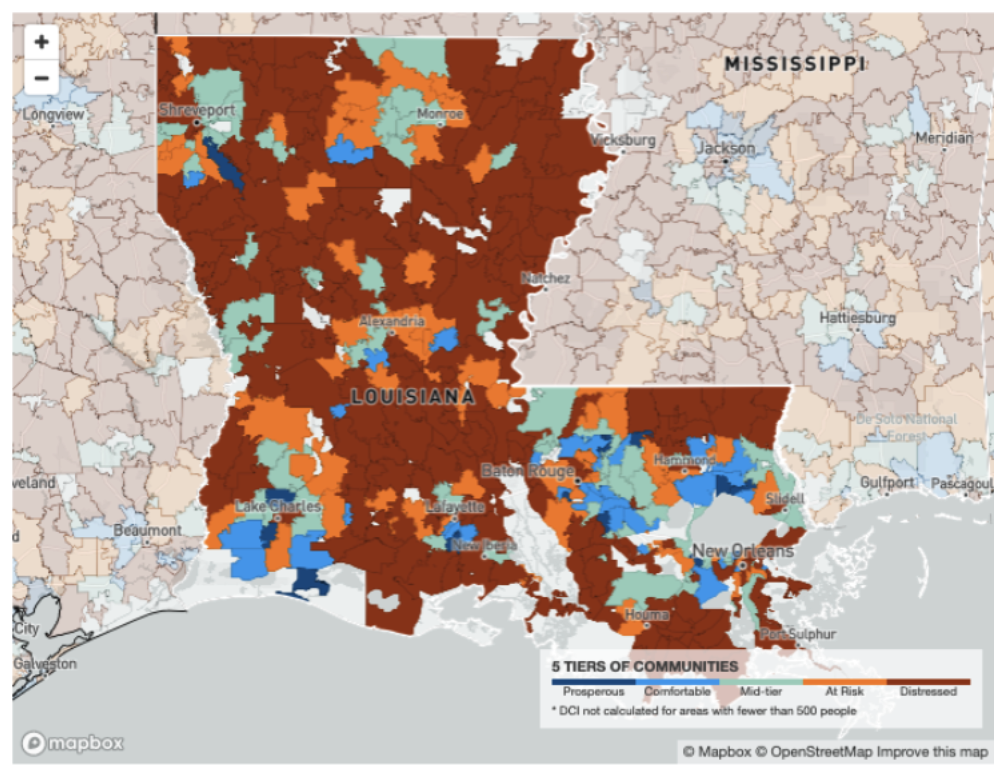
Hurricane Ida is pummeling some of the country’s most economically distressed communities. The states of Louisiana and Mississippi rank third and first, respectively, for the total share of their populations living in distressed communities, according to the Economic Innovation Group’s Distressed Communities Index (DCI). That means that 45 percent of the population in Mississippi and 39 percent of the population in Louisiana live in a zip code that falls into the bottom one-fifth of all zip codes nationally in terms of economic well-being. Both of those shares are higher today than they were in 2000. Nationwide, only 16 percent of the population lives in a distressed zip code.
The DCI gauges well-being across seven different metrics covering education, poverty, incomes, work, housing vacancy, job growth, and business openings. Distressed communities tend to lag behind their peers on all fronts. As a consequence, they are often the least resilient in the face of natural disasters, economic dislocations, or public health crises. This leaves them particularly vulnerable to the confluence of challenges related to climate change, the COVID-19 pandemic, and continued economic uncertainty—both acutely in the form of Hurricane Ida and the coming fall-out and longer-term.

Minority populations are particularly vulnerable in the states in Ida’s path, providing a stark reminder of the limited progress made in resolving the country’s racial inequities that Hurricane Katrina exposed so viscerally, in the same region, exactly 16 years ago. In Louisiana, 52.5 percent of the black population and 60 percent of the native population live in distressed communities. By contrast, only 1 percent of the state’s black population lives in a prosperous zip code (meaning a community that ranks in the best one-fifth nationally on the DCI). Divides are similarly stark in Mississippi, where 64 percent of the black population lives in a distressed community, 3.5 percent in a prosperous one, and 32 percent someplace in between.
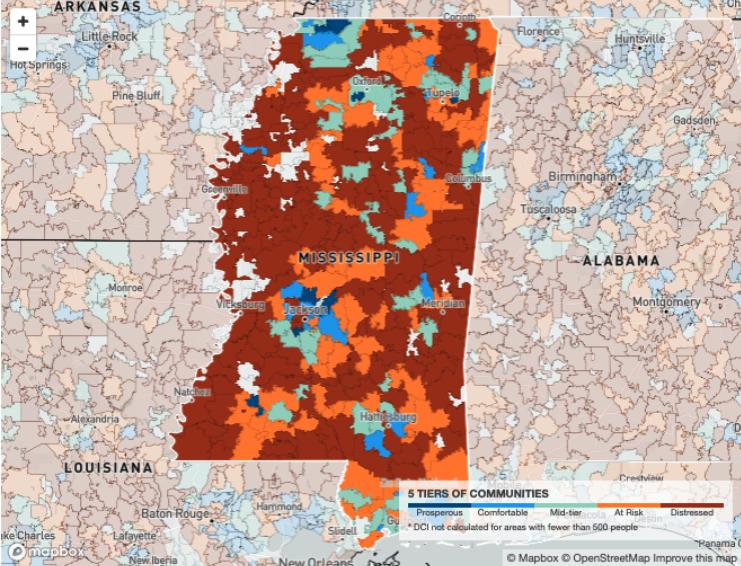
To learn more about how economic well-being varies across communities in these states and the country at large, explore the digital interactive maps and data dashboards available at eig.org/dci/interactive-map.