
Originally published on Agglomerations, the Substack newsletter from the Economic Innovation Group.
By Adam Ozimek, Benjamin Glasner, and Jiaxin He
From national security, to productivity growth and innovation, to qualitative ideas of what a “good job” is, manufacturing holds a special place in the minds of policymakers.
Because the sector motivates so many policy objectives, it would seem we should know some basic facts, like how many manufacturing workers there really are. But while that sounds like a simple question, determining who counts as a manufacturing worker is actually a fraught empirical exercise with plenty of noise and gray space.
There are generally two ways to measure industry employment: surveying businesses and surveying workers. If you ask American businesses, there were around 12.5 million manufacturing workers in 2023. But if you ask workers, there were around 15 million—a difference of a whopping 2.5 million jobs.
Understanding the causes of this discrepancy is critical to approaching the topic of manufacturing’s place in the American economy objectively. We discuss two methodological and reporting differences that mainly account for these “missing” 2.5 million manufacturing jobs and try to put them into the proper perspective.
- Businesses report their industry to government statistical agencies at the “establishment” (location) level. Determining what constitutes a business “establishment” is ambiguous.
- Workers often report their industry to agencies at the firm level or job level. Business categorizations have changed over time even while workers’ jobs have not.
Grasping these factors and the discrepancies they generate helps to clarify the manufacturing jobs picture. While economists generally advise deferring to surveys of businesses, in this analysis we dig into why the disagreement occurs and argue that the higher, worker-reported numbers are meaningful as well. We think the “right answer” to how many manufacturing workers there are depends on the context and lay out here why sometimes the workers themselves are worth listening to.
How we count workers
To over-simplify just a bit, government statistical agencies ask businesses, “what kind of business are you and how many workers do you have?” and they ask workers, “what kind of business do you work at?”
Business surveys, usually called “establishment surveys,” are filled out by the company. Businesses are asked to indicate the primary work done at a particular location or “establishment.” Sometimes these data are derived from a literal survey filed to a government statistical agency, and other times the agencies start with information from tax returns. In some cases, businesses are legally required to reply and so we end up capturing information on nearly the entire universe of non-farm employer businesses.
Government agencies then use the information to categorize businesses into standardized codes using the North American Industry Classification System (NAICS). A handful of these codes are grouped into the wider category of “manufacturing.”
Agencies then track employment over time at these businesses and aggregate that to the industry and/or geography level. This is how we measure, for example, how many manufacturing jobs there were in the Tuscaloosa, Alabama, metro area in September 1997 (14,814[1]) or how many worked in food manufacturing nationwide in September 2025 (1.771 million[2]). This broad approach is used for a variety of establishment surveys, including the Quarterly Census of Employment and Wages (QCEW), the Current Employment Statistics (CES), County Business Patterns (CBP), and the survey we will focus on most, the Business Dynamics Statistics (BDS). This approach is how the headline payroll growth is estimated with the CES every month on “Jobs Day.”
The other main approach to measuring employment is to survey individuals instead of businesses. One example is the Current Population Survey (CPS) which is used to measure the unemployment rate. The Decennial Census and American Community Survey (ACS) are also done this way.
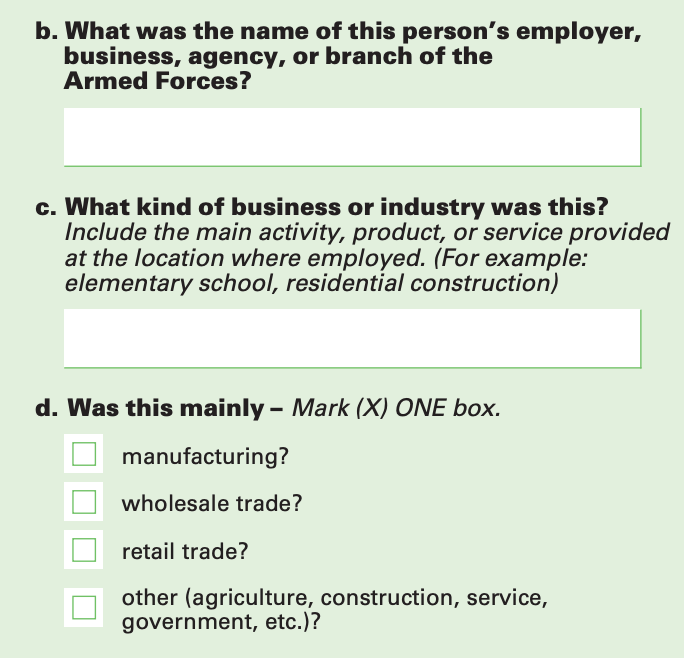
The ACS, which we will focus on most, asks the name of an individual’s employer and also asks this about it:
“What kind of business or industry was this? Include the main activity, product, or service provided at the location where employed. (For example: elementary school, residential construction).”[3]
The ACS then asks specifically if the employer is “mainly” in manufacturing, wholesale trade, retail trade, or other.
Figure 1: Actual ACS Questionnaire
Government statistical agencies categorize all of this information. Individual responses can then be aggregated to measure total industry employment.
When the data disagree
It turns out workers and businesses don’t always agree about the industry they are in. To see this, we can compare the number of workers in each sector in two datasets: the ACS (worker reported) and BDS (business reported).[4]
In 2023, the ACS recorded 15.1 million manufacturing jobs, while the BDS recorded 12.3 million, or 2.8 million fewer.[5]
As the chart below shows, manufacturing employment is 22.7 percent larger in the ACS than in the BDS in 2023, while in most other industries the discrepancy is flipped.
This divergence is not just about picking the two surveys that are farthest apart. Other business surveys are fairly close to BDS at around 12 to 13 million jobs. The CPS, another individual-level survey, is very close to ACS at about 15.1 million. What we see is a general discrepancy between survey types. If you ask workers, there are at least 2.2 million more people employed in manufacturing than if you ask businesses, regardless which survey you choose.
If manufacturing employment were actually 22.7 percent bigger than we thought, that would have serious implications, perhaps weakening the widespread argument that manufacturing employment has been “hollowed out.” To contextualize the discrepancy, the figure of 2.8 million manufacturing jobs is larger than the 2.5 million lost during the Great Recession, according to the Bureau of Labor Statistics’ business survey.[6] It’s also larger than the 2 to 2.5 million estimated job losses from the China Shock.[7] It would have made up for two-thirds of the 4.2 million total decline in manufacturing employment in business surveys from 2000 through 2023.
What the missing manufacturers do
The largest discrepancy numerically is in the auto industry (NAICS 336, including autos and other transportation equipment), which represents 28.9 percent of the missing manufacturing workers.
As the figure below shows, the reporting gap for the auto industry goes back decades but has grown recently. If we ask businesses, the auto industry employs around 1 million workers, which is just below the historical average of 1.1 million. If we ask workers, auto industry employment is essentially at a historical high today of 1.4 million workers.[8] This is well above the peaks that occurred before the rise of imports and is consistent with other evidence that the death of the auto industry has been greatly exaggerated.
Another example is textiles, apparel, and leather (NAICS 313-16), where there are almost twice as many workers observed in the ACS. There is little discernible pattern to which sectors have more or less employment in either survey.
In all but two subsectors of manufacturing there are more workers in the ACS than the BDS. The counterexamples are food and beverage manufacturing (NAICS 311-12) and primary and fabricated metals manufacturing (NAICS 331-32). BDS exceeds ACS by a small 2.6 percent in food and beverage manufacturing, which is better thought of as being consistent. The metals subsector stands out as the only case where ACS reports substantially lower employment than BDS—by 9.3 percent.
We can get even more detail on what missing manufacturing workers do from Emily Isenberg, Liana Landivar, and Esther Mezey (2013), who match ACS data to the Census Bureau’s Longitudinal Employer Household Dynamics (LEHD) program, which covers the universe of firms and workers.[9] They find that 23 percent of those identified in the LEHD as wholesale trade are counted as manufacturing in the ACS. The same is true for 28 percent of workers in management of companies, and 8 percent of workers in scientific, professional, and technical services.[10]
What feels like manufacturing but isn’t?
Do these discrepancies matter? Business surveys are generally seen as the more reliable estimate, since business owners or staff specifically designated with the task are expected to be more accurate than a random employee in identifying an establishment’s industry. The government statistical agencies also do a lot of work to make sure these numbers are correct.
As John Haltiwanger, Henry Hyatt, and James Spletzer write, “The LEHD industry measures are of high quality from the establishment-level programs at BLS and Census. These agencies have a strong incentive to track industry carefully as their detailed industry statistics are critical for the NIPAs and productivity statistics.”[11]
There is also plenty of evidence that individuals make mistakes in reporting their industry even at the sectoral level. For example, economists Matthew Dey, Susan Houseman, and Anne Polivka document that temp workers commonly self-report the wrong employer and end up in the wrong industry as a result.[12]
There is even more evidence that there is disagreement between types of surveys. Isenberg, Landivar, and Mezey found the same workers in both the ACS and LEHD and showed that the industry matched only 75 percent of the time.[13]
But there are a few reasons to believe there is valuable information in the ACS, and that these workers in important ways really are manufacturing workers.
One reason is that many economists also think that the manufacturing sector is bigger than it seems.
Consider what Andrew Bernard and Teresa Fort call “factoryless goods producing firms” or FGPFs.[14] These are businesses that are involved in the production of goods, but may not be doing the raw assembly of the goods themselves. This can include pre-production activities like research and development (R&D), market research, product design, and product engineering. It can also include post-production activities like marketing, sales, logistics, and customer service. As Bernard and Fort write, “FGPFs are manufacturing-like as they perform many of the tasks and activities found in manufacturing firms.”
In the U.S., Apple is the archetypal example of an FGPF. In the U.K., there is Dyson. Other examples include so-called “fabless” semiconductor companies like NVIDIA who design chips but don’t make them.
Not only are many factoryless businesses “manufacturing-like,” many of them were once involved in production as well. Apple, for example, used to assemble computers at its Elk Grove, California, campus. Today there is no assembly at that location, but thousands of Apple employees work there on logistics, distribution, repair, and customer support.[15]
The site of Harley-Davidson’s first factory in Milwaukee also does no production today, but is home to their corporate headquarters. This includes Harley-Davidson University, where employee training is done.
When a business stops producing goods at a specific establishment, that location stops “identifying” as manufacturing on business surveys. Researchers using one of those business surveys (of the type that includes the universe of businesses) showed that 40 percent of the lost manufacturing jobs from the China Shock were actually this type of phenomenon. [16] For these businesses, competition with Chinese imports didn’t mean closing up shop. It just meant a shift away from production towards R&D, marketing, and other activities. In the Harley-Davidson example, all Harley-Davidson workers, in some sense, have a job in manufacturing, but according to establishment surveys only those at manufacturing sites do.
These sorts of employees—who work adjacent to manufacturing, but not in categorized establishments—make up a big chunk of the 2.2 to 2.8 million missing manufacturing workers.
It shouldn’t be a huge surprise that some of the workers at these businesses think of themselves as working in manufacturing. After all, they are still contributing to the process of manufacturing goods, even if indirectly, and for many they might be doing the exact same non-production job they once did in a manufacturing establishment.
When the business is the same but definitions change
Changes in the operations of a business can clearly lead to missing manufacturing workers. Yet another issue is that sometimes the business hasn’t actually changed at all, but definitions have. An important illustration of this occurred in 1997 when U.S. statistical agencies changed their industry codes, switching from the Standard Industrial Classification System, which had been in place but with evolutionary changes since the 1930s, to the more modernized NAICS codes.
This change was consequential for manufacturing in some datasets (importantly, not the BDS, which has consistent definitions over time). Previously when a manufacturing firm had a specific location that only engaged in R&D, the workers there would be counted as manufacturing. Under the NAICS system, those workers are instead classified based on the primary activity of their specific business location, not what the wider firm does. Workers at an R&D location for a manufacturing firm are not counted in manufacturing employment. The same is true of a location that is solely the headquarters of a manufacturing company.
The change in method makes it clear that what is counted as a manufacturing job is a statistical choice, and one that government statisticians have made differently in the past.
Altogether, research from economists Teresa Fort and Shawn Klimek suggests that this change in industry definitions led to 1.4 million jobs being reclassified from manufacturing to services in the Census Bureau’s Longitudinal Business Database (LBD).[17] This likely represents another chunk of the missing manufacturing workers between at least some of the datasets.
What counts as a manufacturing establishment?
In some cases, the distinction between a manufacturing worker and a non-manufacturing worker seems almost arbitrary despite the huge policy implications.
Consider Boeing’s 1,000-acre facility in Everett, Washington.
Boeing builds jets in the main assembly building, which is the largest building in the world. But there are 200 separate buildings at the facility that contain activities ranging from R&D to safety certifications. An important measurement question is whether the 1,000 acres constitute a single manufacturing establishment, or whether the various functions performed in the other buildings are treated as separate establishments, with each assigned its own industry code.
It’s not clear which should be the case, nor is it clear which is the case for the various datasets we are considering. Yet the key issue of “how many manufacturing jobs we have” hinges on this question and many more instances like it.
Conclusion
The kind of work we care about varies by context. Whether a policy targets national security, productivity growth and innovation, or “good jobs” makes all the difference in how we should measure manufacturing employment.
Certainly when it comes to “good jobs,” whether a worker thinks they are in manufacturing is more consequential than what the business itself thinks. If a local policymaker promises to bring back manufacturing to their town, and a firm makes 1,000 new hires in R&D, marketing, human resources, and sales for a product manufactured in Vietnam, would that be regarded as a policy success? It seems likely it would.
On the other hand, if a politician promised manufacturing jobs and instead a business was created that simply served as janitorial services for manufacturers, that would be unlikely to be counted as a policy success.
In the context of productivity and innovation, the R&D work that is often excluded from official definitions of manufacturing would seem to be just as relevant as—and arguably more so than—assembly. However, to the extent innovation is bolstered by co-location with production, having production on-site may matter as well.
For national security, one can make an argument in both directions. If the U.S. is cut off from assembly, then our ability to design, sell, and ship goods may be of little help. On the other hand, manufacturing R&D and logistics could be just as essential to military deployment.
Accepting that there is information in what workers tell us does not necessitate abandoning the importance of assembly itself or the general reliability of business-based surveys. However, we should make sure that when talking about manufacturing, we are clear that there is more than one measurement and definition that may be relevant. When it comes to what workers think they are doing, we have a lot more manufacturing than is commonly reported.
Notes
- See the CES count of manufacturing employees in Tuscaloosa MSA.[↩]
- See the CES count of U.S. food manufacturing employees.[↩]
- This illustrates that like the business surveys, the ACS is referring to a specific business location rather than the company overall.[↩]
- The statistical agencies do a lot of work to update industry definitions over time to make sure they remain relevant to a changing economy. Some surveys like the BDS also attempt to ensure the data are comparable over time by applying a single vintage of industry codes over time. Indeed, the BDS is one of the surveys which is not really a survey because it captures all firms. In addition, they utilize information on tax returns. The hard work they put into that is why it is considered the most reliable for measuring employment trends over longer time periods, and why we will rely on it in this piece as the standard bearer for establishment data.[↩]
- It’s useful to note that the ACS measures 13.1 percent fewer private non-farm workers overall than the BDS. One reason for this is that an individual can have multiple jobs. We can control for this in individual surveys by asking about someone’s primary job, but business surveys count each job independently. As a result, we should expect the ACS to usually record smaller industry-level job totals than the BDS does. That makes the manufacturing discrepancy—in which the ACS reported 2.8 million more jobs in 2023 than the BDS—all the more remarkable.[↩]
- https://www.bls.gov/opub/btn/volume-12/as-manufacturing-sector-changes-production-occupations-disappear-1.htm[↩]
- https://www.aei.org/articles/you-autor-know/[↩]
- The CES dataset uses SIC industry codes prior to 1990. The reclassification of automotive manufacturing from SIC 371 to NAICS 3361-3 resulted in a discontinuity in employment levels due to definitional differences. Assuming that employment growth rates under the two classification schemes are comparable, we harmonize the CES time series by backcasting the 1990 automotive employment level (defined under NAICS) using the 1960–1989 SIC-based growth rates.[↩]
- Isenberg, Emily Pas, Liana Landivar, and Esther Mezey. “A comparison of person-reported industry to employer-reported industry in survey and administrative data.” US Census Bureau Center for Economic Studies Paper No. CES-WP-13-47 (2013).[↩]
- The discrepancies between the person and establishment-level surveys likely stem from multiple sources of error, the relative shares of which remain unknown. Some portion may arise from individual-level errors in the ACS, such as respondents misreporting their industry (for example, identifying as employed in warehousing when they actually work in wholesale) or reporting what they perceive to be their industry even when it no longer aligns with their establishment’s current classification (for example, indicating manufacturing even though production has been moved to a separate facility). The Census Bureau may also incorrectly categorize an establishment’s industry because their answer provides too little information. For example, if they provide only the name of a small business. The inclusion of a specific “manufacturing” check box mitigates this risk somewhat for the industry at hand.
Alternatively, some share of the discrepancy could originate in establishment-level data. It is possible that an imputed NAICS code was entered incorrectly and that the worker’s self-reported industry in the ACS is, in fact, more accurate. Moreover, differences in the units of observation across establishment and person-level surveys can create classification mismatches. Establishments receive NAICS codes based on their majority activity; if manufacturing accounts for less than 50 percent of the total value of shipments, then all employees at that establishment are classified as non-manufacturing, even if manufacturing still represents a nontrivial share of output. In such cases, an individual survey response identifying manufacturing work may be correct at the person level, even while the establishment’s classification as non-manufacturing is accurate given the operational definition used in the surveys.[↩]
- Haltiwanger, John, Henry R. Hyatt, and James R. Spletzer. “Increasing earnings inequality: Reconciling evidence from survey and administrative data.” Journal of Labor Economics 41.S1 (2023): S61-S93.[↩]
- Dey, Matthew, Susan Houseman, and Anne Polivka. 2010. What Do We Know About Contracting Out in the United States? Evidence from Household and Establishment Surveys in Labor in the New Economy, Katharine G. Abraham, James R. Spletzer, and Michael Harper, eds., Chicago: University of Chicago Press, pp. 267-304.[↩]
- Isenberg, Emily Pas, Liana Landivar, and Esther Mezey. “A comparison of person-reported industry to employer-reported industry in survey and administrative data.” US Census Bureau Center for Economic Studies Paper No. CES-WP-13-47 (2013).[↩]
- Bernard, Andrew B., and Teresa C. Fort. “Factoryless goods producing firms.” American Economic Review 105.5 (2015): 518-523.[↩]
- https://appleinsider.com/articles/18/10/11/apple-spends-42m-on-office-space-to-expand-elk-grove-presence[↩]
- Bloom, Nicholas, Kyle Handley, André Kurmann, and Philip A. Luck. The China Shock Revisited: Job Reallocation and Industry Switching in US Labor Markets. No. w33098. National Bureau of Economic Research, 2024.[↩]
- Fort, Teresa C., and Shawn D. Klimek. “The effects of industry classification changes on us employment composition.” Tuck School at Dartmouth (2016).[↩]