
By Eric Carlson and Kenan Fikri
Corrected March 6, 2024
The latest data on Opportunity Zones (OZs) merit cautious optimism about the policy’s local impacts. The most recent Census data from the American Community Survey (ACS), which covers the 2018 to 2022 period, shows that in the first years after the law took effect, the housing stock of OZs experienced a faster growth rate than peer census tracts.
While OZs are still lagging behind the national growth rate in housing, these areas are starting to converge with the rest of the country. Indeed, across nearly one-third of states, OZs experienced faster growth in housing units than the state itself. These tracts also registered faster improvement across several indicators of economic well-being–including poverty rates, vacancy rates, and income levels–over the period than their peers.
Setting Expectations
Although OZs were formally enacted into law at the end of 2017, the currently available public data sources make it difficult to capture the effects of the policy. Both the construction of small area estimates and the timing of OZ investments mean that the data presented in this report are likely to underestimate economic activity in OZ housing markets.
The Census Bureau’s highest-quality estimates on the social, economic, and demographic characteristics of the population in individual census tracts, as well as estimates on the quantity and character of housing units, comes from the ACS. These tract-level figures aggregate five years’ worth of survey data to capture a sufficiently large sample for small geographic areas. The December 2023 publication of the 2022 5-Year Estimates (which cover the years 2018 through 2022) marked the first vintage assembled with data collected almost exclusively after OZ designation in mid-2018.

While this 5-year aggregation increases the reliability of small-area population and housing estimates, it smooths over changes that occur within the period. As a result, the 5-year estimates are good at detecting large fluctuations between 5-year windows but bad at capturing changes that occur within those windows. This makes the ACS less than ideal for estimating the early impacts of OZs since the economic activity around OZs started from nothing in early 2018 before rising to $48 billion in direct OZ investment capital in 2020 and likely doubling again by the end of 2022. The amount of OZ investment capital at work went from $0 to $100 billion all within the frame of the single 5-year estimate that serves as this study’s endpoint.
Structural characteristics of the OZ incentive itself compound the measurement challenge. While OZ investment activity started ramping up quickly, there was still a 2-year lag from when OZs were enacted to when regulations governing the incentive’s use were promulgated and growth could really take off. Then there is a substantial lag between when capital is raised and when permits, construction, and other observable economic activity takes place. For example, it may take two years for an OZ investment on paper to translate into a new, occupied housing unit captured by the ACS. Suffice it to say that only the economic activity stemming from the very first years of (the then rather limited) OZ investment could be detectable in the ACS at this point in time.
Figure 1. Stylized phases of impact flowing from a mixed-use development
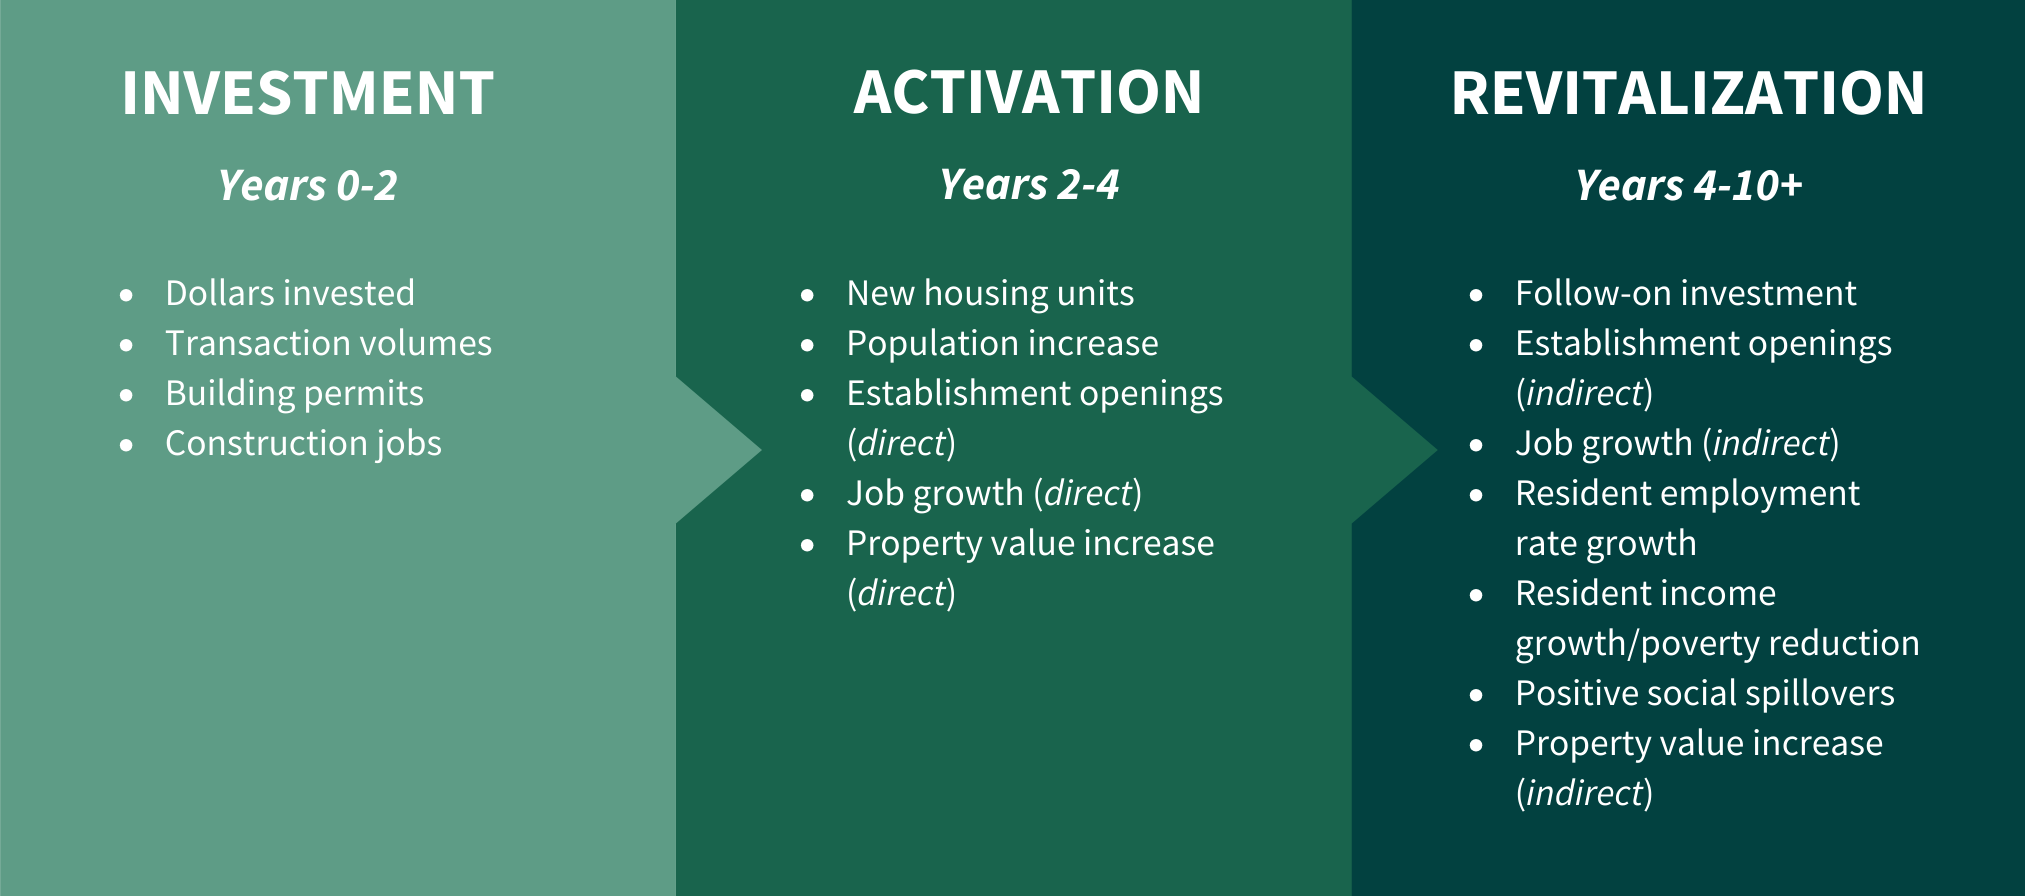
Source: Economic Innovation Group, “Are Opportunity Zones Working?”
Housing: the Leading Indicator of OZ Activity
Much of the first wave of private investment into OZs flowed into housing, which makes it a natural place to look for early impacts of the policy. Academic research has found significant increases in building permit activity in designated census tracts across cities using data through June 2022. Census tracts in the sample were 20 percent more likely to see development activity in any given month after being designated an OZ. More recently, OZs accounted for 20 percent of all new multifamily apartment units built nationwide in 2023, climbing gradually and then rapidly from 8 percent before the tax incentive was signed into law, according to private sector data.
Figure 2. OZ Tracts Have Experienced Rapid Growth of New Multifamily Units
Opportunity Zones are working as planned. The number of apartment units built in an OZ jumped 3x between 2016 (before legislation passed) and 2022, and then DOUBLED in 2023.
In 2023, 20% of all new apartments in the U.S. were located in an OZ… up from ~8% prior to the… pic.twitter.com/JCOuqZyraB
— Jay Parsons (@jayparsons) January 9, 2024
Those relatively dramatic findings stem from flow variables–the issuance of new building permits or the delivery of new rental units on the market–that isolate new activity registered in a place. The ACS contains only stock variables, however, limiting analysis to population-level changes. Thus, new activity will be spread across the base of existing activity–putting the marginal impact of OZs in context, but also yielding results that at least initially will appear more muted than those derived from flow variables.
Opportunity Zones Have Pulled Ahead of Their Peers
Based on the ACS, the housing stock (number of units) of designated OZs grew slightly slower than the housing stock of non-designated eligible tracts between 2012 and 2017. During this period, designated OZs had a housing stock growth rate of about 1.6 percent while eligible but non-designated tracts had a growth rate of about 1.8 percent. However, after the legislation was enacted, the housing stock grew at a rate of 2.7 percent in designated tracts compared to peer census tracts (low-income census tracts that were eligible for OZ designation but did not receive it), whose housing stocks grew at a rate of 2.6 percent. Between 2012 and 2017, OZ tracts accounted for about 17 percent of housing stock growth in all eligible census tracts. This grew to about 19 percent of housing stock growth in eligible census tracts between 2017 and 2022, an increase of two percentage points.
Figure 3. The Housing Unit Growth Rate in OZ Tracts Surpassed Their Peers in 2022
Opportunity Zones are Slowly Converging with National Trends
The ACS also shows that the rate at which OZs have added new housing units is catching up to the national growth rate. As shown in Figure 3, OZs narrowed the gap between their housing growth rate and the national average between the two periods.
In absolute terms, OZ census tracts accounted for 6.6 percent of the national increase in housing units between 2017 and 2022, up from 5.8 percent between 2012 and 2017. The total housing stock in OZs increased by 366,429 units between the 2017 and 2022 samples, 1.7 times as quickly as in the previous period (216,224 units). By contrast, the number of housing units increased just under 1.5 times as quickly between the two periods at the national level. Tracts that were eligible for OZ status but ultimately not selected experienced a similar housing acceleration to the national average, seeing the growth of housing units increase 1.5-fold.
OZs Show Heterogeneous Performance Across States
Looking across states, OZ designation was associated with significant changes in the trajectory of housing growth in some states during the study window and very little change in others.
Nationwide, the number of housing units grew 4.1 percent between 2017 and 2022. OZs across 18 states beat that figure (see Figure 4). These ranged from western states that are experiencing rapid population growth, such as Colorado and Utah, to New York and several of its neighbors where no such population tailwinds are supporting the numbers. Many of these OZ housing unit leaders (DC, Utah, and Oregon, specifically) also showed high levels of OZ investment penetration in the incentive’s early years, with three-quarters of all eligible census tracts already seeing OZ investment by the end of 2020.
Figure 4. States with the Highest Rate of Housing Unit Growth
</divBuilding activity was high in some leading states irrespective of OZ status, however. In DC, OZ growth was basically in line with District-wide growth. In Utah, which ranked first nationally for building permits activity in 2021, OZs trailed the statewide increase in housing units. The number of housing units in Texas OZs grew half as quickly as statewide, a notable outlier. This heterogeneity stems from multiple factors starting with the very different ways states set about selecting their OZs. Governors were given wide latitude to determine which of their low-income census tracts would be designated for the incentive. Each state brought its own approaches and priorities to the selection process, which took place in the first half of 2018 when the incentive was still new and knowledge about how it would ultimately be applied in the marketplace was limited. This first ACS offers nothing conclusive, of course, but it provides preliminary hints as to which states may have designated census tracts where investment into housing in particular was more responsive to the new incentive.A closer look at the experience of OZs relative to peer census tracts in the West and Northeast show this heterogeneity in action. In Nevada and Washington, housing unit growth in OZs lagged significantly behind peer low income communities (LICs) and state averages from 2012 to 2017. By 2022, OZs had fully caught up or slightly pulled ahead. In Oregon, OZ tracts went from being on par with peer benchmarks to well ahead, with the rate of growth more than doubling. In Utah, by contrast, OZs moved within a much narrower band amid the statewide development boom. In Colorado, OZ growth accelerated but still lags other benchmarks. Figure 5. OZ Tracts Experienced Accelerated Housing Unit Growth Relative to Peer Tracts
Colorado also serves as a useful reminder of the limits of relying on a single metric to gauge success at any stage, especially given the versatility of the OZ incentive (i.e. its ability to help finance any number of investments including but well beyond housing). The state deliberately targeted rural census tracts and opportunities for new business growth when it selected its OZs, eschewing areas where development was more certain. Its strategy has borne fruit: the state is a national leader on eliciting OZ investment in startups in industries from tourism to aerospace. Much of the state’s OZ activity has taken root in struggling parts of the rural Western Slope, as intended.
The evidence from several northeastern states indicates that OZs may be helping to unlock supply to meet pent-up demand in parts of the country where it is notoriously difficult to build. In a number of states in the region, the rate of increase in housing units in OZs accelerated dramatically to significantly outpace benchmark rates in the later period. From 2012 to 2017, the housing stock increased by only 0.7 percent in census tracts that would become OZs in New Jersey, before shooting to 8.6 percent between 2017 and 2022, after designation for a 12-fold increase. Similarly dramatic increases can be seen across the northeast. In Connecticut, Massachusetts, New Jersey, and Vermont, OZ census tracts went from trailing or being even with other LICs and statewide averages to significantly outpacing them after designation. Even in New York, the rate of housing growth in OZs accelerated more than twice as quickly as statewide.
Figure 6. Strong Housing Growth Acceleration in OZ Tracts of Northeastern States
Not only is the heterogeneity of experiences across OZ tracts across states in line with expectations given how census tracts were designated, but it also comports with the early evidence scholars have begun analyzing from the initial batch of OZ tax records. For example, Kennedy and Wheeler (2021) show a wide distribution of investment per resident in OZ census tracts in 2019. This ranges from less than $5 per resident in some cases to over $50,000 per resident in others. Early impacts on top-line, population-level statistics such as that explored here–the number of housing units in a census tract–will very much reflect not just whether a tract likely received an OZ investment, but also how much and what type (only investments in housing would register, in this case, and only those projects that have been completed). It will be important to monitor how OZ investment diffuses across eligible areas as the incentive matures.[1]
Opportunity Zones show Disproportionate Improvement on Multiple Indicators of Well-Being
Progress kicked into a relatively higher gear in OZ census tracts across numerous other indicators of well-being as well.
Looking across area poverty rates, vacancy rates, and income levels, OZs improved faster, from lower baselines, than comparison groups. The poverty rate in the average OZ tract fell by 3.6 percentage points between 2017 and 2022, compared to 2.0 percentage points in eligible non-designated tracts. It fell by more than twice as much as the national rate (1.4 percent). Similarly, median household income grew by 24 percent in OZs over the period, double the 12 percent growth of the national median household income. Housing vacancy rates fell by 1.3 percent, as well. Across all three measures, the gap between the typical OZ and its low-income, non-designated peers narrowed, as did their gap with the nation.
To be clear, these figures say nothing about the causal effect of OZs. The 2017 to 2022 period coincided with an era of economic gains finally accruing to the bottom of the income distribution. These household-level gains will have filtered into the statistics pertaining to low-income communities, too. However, the fact that OZs performed better on average than their low-income peer census tracts somewhat controls for the stronger performance of lower-earning populations and areas late in the 2010s macroeconomic cycle. Still, there may be unobservable factors that made OZ census tracts qualitatively different from non-OZ low-income tracts (and indeed econometric work by a range of scholars cited here suggests that this is the case), warranting caution in interpreting these signals of convergence as causal at this time.
Cautious Optimism
There are serious limits to what can be gleaned from the first vintage of ACS data covering the period immediately following OZ designation. Many of these limits stem from the structure of the data itself, combined with the roll out and ramp up of the policy. As the statistical resource of record, however, keeping tabs on how the descriptive statistics associated with OZs are changing relative to different benchmarks on the ACS is an important exercise–even if the dataset provides some of the most conservative estimates available on the changes underway in designated tracts.
That OZs appear to be closing the gap between themselves and the nation, and claiming a greater share of national housing growth since designation than in the period prior, is therefore notable. Combined with all of the other data points rolling in attesting to the scale and emerging impact of the incentive–including IRS data reporting $48 billion in direct OZ equity investment reaching 3,800 census tracts as early as 2020–the new ACS confirms the importance of OZs as an experiment in place-based policy to keep watching closely.
Correction notice: The original version of this analysis was posted on February 7, 2024, and contained a tabulation error. A corrected version was posted on March 6, 2024. The core findings regarding the performance of OZs relative to benchmark groups were unaffected by the error, but the magnitude of several reported growth rates have been revised.
Notes
- It is also important to note that only a fraction of any investment into designated census tracts (and possibly none of it) will actually be taking advantage of the incentive, making it nearly impossible to make any causal inferences with available data.[↩]