Today, the Economic Innovation Group is excited to release the beta version of our Distressed Communities Index (DCI) online dashboard — an interactive visualization of economic conditions in zip codes, counties, cities, and states throughout the U.S.
 Click here for DCI dashboard.
WHY?: The DCI was designed to provide a simple way to identify and evaluate distressed communities around the country, as well as to understand key economic challenges on a local and regional level. Good data is essential for good public policy; we want this data in the hands of those working to drive economic growth in areas that need it most — policymakers, academics, entrepreneurs, and Americans of every background who care about their communities. We hope the DCI draws new attention to the need for investment, entrepreneurship, and economic growth to provide opportunity for millions of Americans trapped in struggling regions of the country.
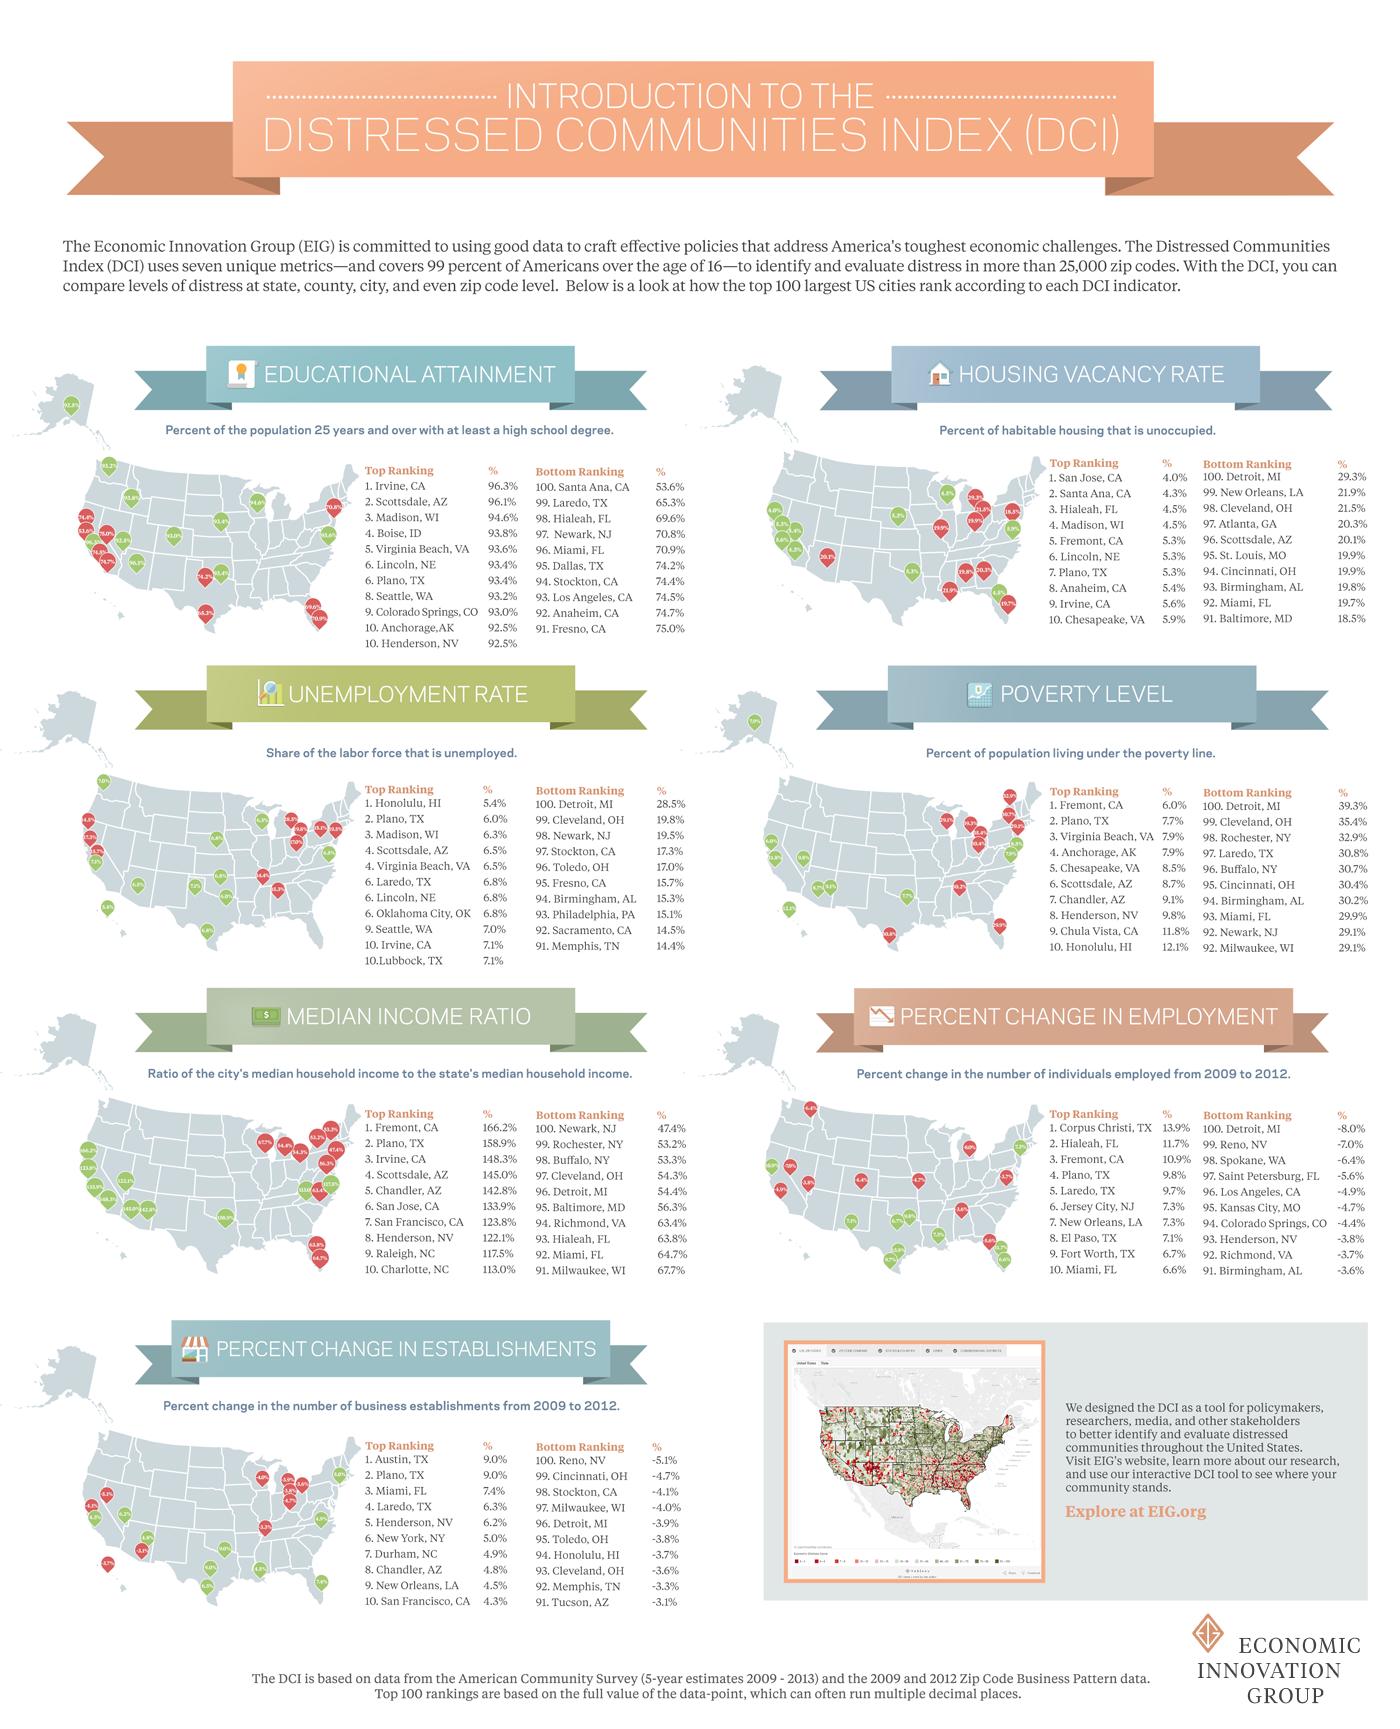
HOW?: The DCI was built using data from more than 25,000 zip codes (those with populations over 500 people). In all, it covers 244 million Americans — 99 percent of those over the age of 16. Each zip code is given a distress score based upon the ranking of seven economic indicators: educational attainment, housing vacancy, unemployment rate, poverty rate, median income, change in employment, and change in business establishments. There is an infographic below that ranks the top and bottom cities for each indicator. Users can identify how a target geography performs in those seven metrics and compare it to other communities throughout the country. The result is a first-of-its-kind interactive “heat map” of distress and prosperity.
WHAT’S NEXT?: In the coming months, we’ll continue to refine the dashboard and update the DCI with new data as it becomes available. In the meantime, take a minute to try out the dashboard for yourself and send us your feedback at [email protected]. You can share the DCI on social media using our Twitter handle @innovateeconomy and #EIGIndex.


