by August Benzow
Key Findings
- Only counties in the prosperous and comfortable quintiles of the Distressed Communities Index had a net gain in employment from Q2 2019 to Q2 2022, which indicates a full recovery of jobs lost during the pandemic.
- Distressed communities, which collectively only gained around 10,000 jobs from Q2 2016 to Q2 2019, were still down 100,000 jobs in Q2 2022 compared to Q2 2019.
- Business or establishment growth in distressed communities surged from 2021 to 2022 at a rate that exceeded the at risk quintile above it and tied the mid-tier quintile.
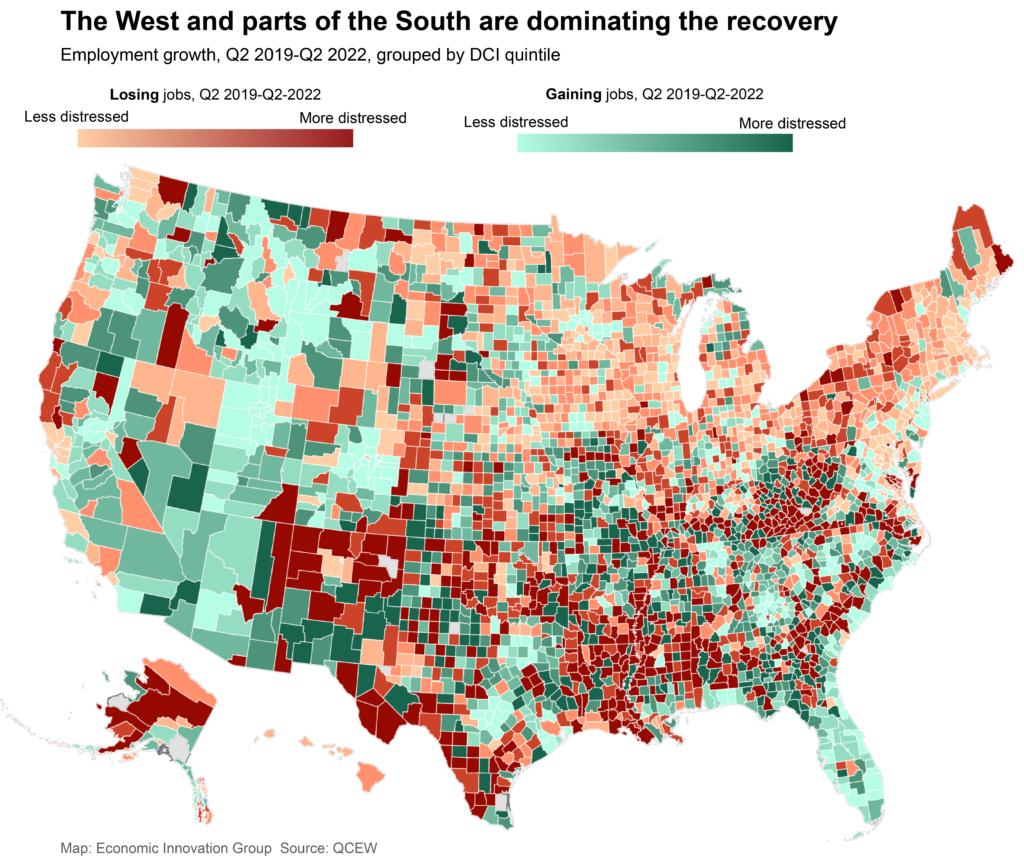
- Economic prosperity and positive employment trends are the norm for much of the West and urban South. Distressed counties that saw a decline in jobs from Q2 2019 are concentrated in the Deep South and Appalachia, while many prosperous counties in the Upper Midwest and New England have not returned to pre-pandemic employment levels.
- Utah has the highest share of counties that gained jobs from Q2 2019: just two of its 29 counties have fewer jobs than they did before the pandemic By contrast, only four of New York state's 62 counties experienced increases in employment from 2019 to 2022.
- Prosperous counties were the only quintile that managed to gain jobs outside of metro areas, but at around half the rate compared to those inside metro areas.
- In the professional and business services sector, prosperous counties added a half million jobs from Q2 2019 to Q2 2022 even as the bottom three quintiles were still in the red.
EIG's Distressed Communities Index (DCI) sorts all U.S. counties using seven complementary economic indicators, which are then combined into a single measure with five levels or quintiles of well-being: prosperous, comfortable, mid-tier, at risk, and distressed. The most recent iteration of the DCI uses 2020 data. Paired with more recent data from the Bureau of Labor Statistics' Quarterly Census of Employment and Wages, available through the second quarter of 2022, the DCI can be used to show the uneven economic recovery from the Covid-19 pandemic.
The country lost 16.5 million jobs from the second quarter of 2019 to the same quarter in 2020, nearly three times the number of jobs gained from 2016 to 2019, a comparable time span of three years that establishes a pre-pandemic trend. By Q2 2022, the country not only regained all those 16.5 million lost jobs but had added 1.8 million more jobs than in 2019. Despite this rapid recovery on a national level, 54 percent of counties had fewer jobs in Q2 2022 compared to three years prior. With signs that national job growth may be beginning to slow, there is a clear danger that communities that were left behind in the pre-pandemic economic growth period may be left even further behind this time around.
Distressed counties struggle to recover jobs lost during the pandemic
Only counties in the top two quintiles had a net gain in employment from Q2 2019 to Q2 2022, with 790,700 and 112,200 jobs added, respectively. At the other end of the spectrum, distressed counties saw just 0.3 percent growth in employment in the pre-pandemic period from Q2 2016 to Q2 2019 and have since seen a 2.6 percent decrease in jobs over the past three years. Put another way, distressed communities collectively gained around 10,000 jobs from 2016 to 2019 and have lost nearly 100,000 since 2019. These communities have been gaining back jobs since 2020, but at half the pace of the top tiers and not enough to even get back to 2016 numbers.
Western counties and Southern metropolitan areas are seeing the largest employment gains
Increases in employment from Q2 2019 to Q2 2022 are concentrated in the western United States. Utah has the highest share of counties that gained jobs over that time period: just two of its 29 counties have fewer jobs than they did before the pandemic. By contrast, only four of New York state's 62 counties experienced increases in employment from 2019 to 2022. Other well-defined pockets of positive employment trends can be found across the country including most of Florida, central Texas, and many of the more urban counties in Tennessee, North Carolina, and Georgia. Distressed counties with negative job growth from Q2 2019 to Q2 2022 are concentrated in the Deep South and Appalachia, while more prosperous counties with negative job growth are most commonly found in the Upper Midwest and New England.
Counties outside metropolitan areas are still down jobs compared to 2019 across every DCI quintile except prosperous
For the prosperous and comfortable quintiles of the DCI, net employment growth from Q2 2019 to Q2 2022 was higher in metropolitan counties compared to their nonmetropolitan counterparts. Among nonmetropolitan counties, only those in the prosperous quintile have surpassed their pre-pandemic employment numbers, but at around half the rate compared to those inside metro areas. In every other DCI quintile, nonmetropolitan counties still have not recovered jobs lost during the pandemic. For the mid-tier, at risk, and distressed quintiles, employment growth from Q2 2019 to Q2 2022 was negative in both metropolitan and nonmetropolitan counties, but declines from 2019 figures were steeper in metropolitan counties, especially for the at risk quintile. This quintile includes large urban counties like Wayne County, MI (Detroit) and New Orleans Parish, LA that are still far from gaining back jobs lost during the pandemic.
White-collar job growth is concentrated in prosperous counties
Sector-level employment data reveals significant differences across industries and between quintiles. Trade, transportation, and utilities is the only sector that saw positive employment growth for every DCI quintile from Q2 2019 to Q2 2022. Distressed counties lost jobs in every other sector, and at risk counties only saw additional employment increases in the construction sector. Meanwhile, natural resources and mining, leisure and hospitality, and other services continue to post lower employment numbers compared to pre-pandemic across every quintile. However, some of the largest disparities between quintiles were found in white-collar sectors like information and financial activities, where prosperous counties posted big gains in employment and significantly outperformed even the comfortable quintile. In the professional and business services sector, prosperous counties added a half million jobs since Q2 2019 even as the bottom three quintiles were still in the red. This sector saw the single biggest sector-level employment increase for a prosperous county, with 89,000 jobs added in King County, Washington (Seattle).
Every DCI quintile is seeing robust business establishment growth
A very different narrative plays out with business establishment growth, as every quintile of the DCI has been buoyed by robust national startup rates and establishment growth. Establishment growth in distressed communities surged from Q2 2021 to Q2 2022 at a rate that exceeded the at risk quintile above it and tied the mid-tier quintile—a significant departure from pre-pandemic trends. From 2017 to 2021, year-over-year establishment growth in distressed communities never exceeded one percent and was negative in 2017. Prosperous counties still out-performed these distressed counties with 5.3 percent growth in establishments from Q2 20221 to Q2 2022, but the distressed cohort outpaced pre-pandemic growth in prosperous counties. Even though this trend has not translated into positive job numbers for distressed communities, it is nonetheless a bright spot for the country's most economically challenged areas.
This analysis shows that the geographic disparities that set the map of economic prosperity and distress before the pandemic continue to define the recovery of jobs lost in the initial shock of the Covid-19 recession. Many of the country's most distressed counties are still struggling to climb out of a deep hole and, if they lose what little momentum they have, might never fully recover before the next economic crisis. Robust establishment growth across all DCI quintiles has yet to bolster employment numbers for many counties, and it is still unclear if this trend will support durable growth.